

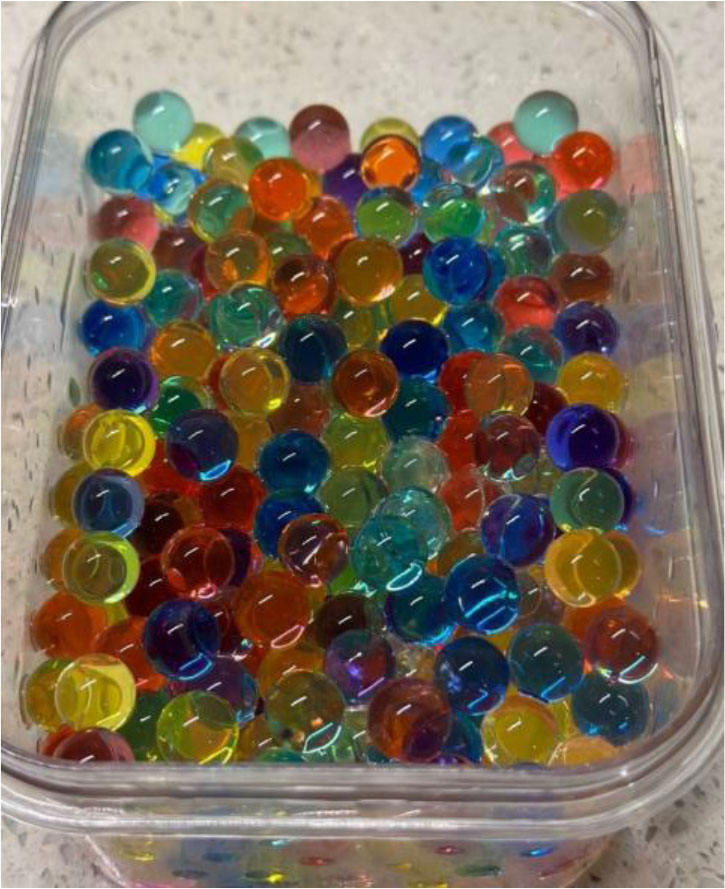
Figure 1:
Water absorption polymer balls (WAPB) in concrete mixes
Table 1:
Details of mix design
| Mix symbol | Cement [kg/m3] | Fine aggregate [kg/m3] | Coarse aggregate [kg/m3] | Pumice [kg/m3] | Water [L/m3] | SP [%] | Water absorption polymer balls [%] |
|---|---|---|---|---|---|---|---|
| Rw | 460 | 730 | 875 | - | 173 | 0.6 | - |
| Rair | 460 | 730 | 875 | - | 173 | 0.6 | - |
| WAPB | 460 | 730 | 875 | - | 173 | 0.6 | 10 |
| 50% LWA | 460 | 730 | 437.5 | 180 | 173 | 0.6 | - |
| Hybrid | 460 | 730 | 656.3 | 90.15 | 173 | 0.6 | 5 |
| LWAw | 452 | 705 | - | 415 | 152 | 0.6 | - |
| LWAair | 452 | 705 | - | 415 | 152 | 0.6 | - |
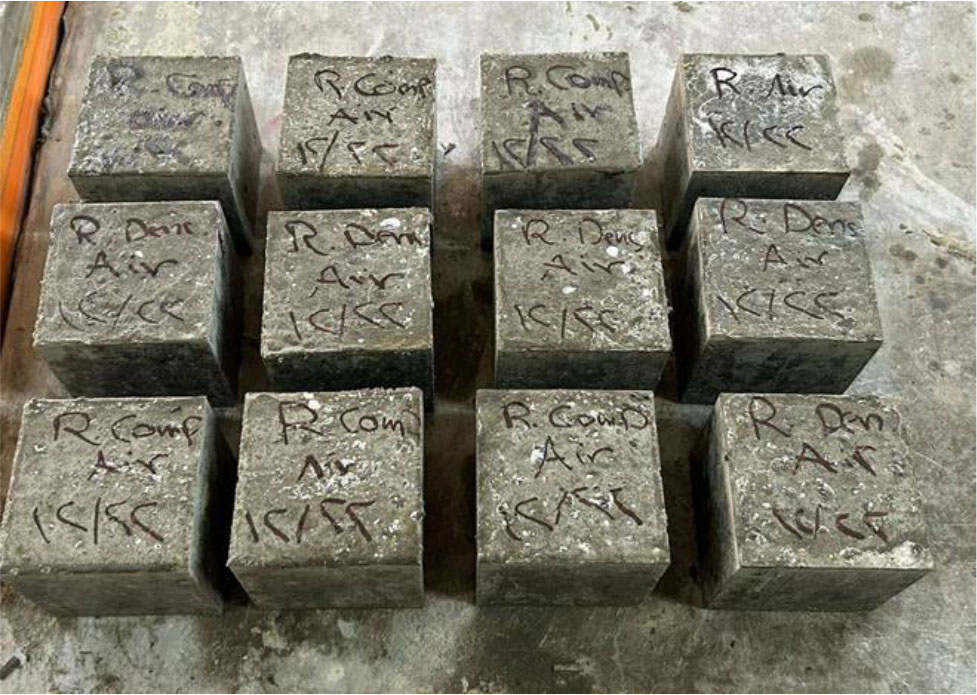
Figure 2:
Cube specimens
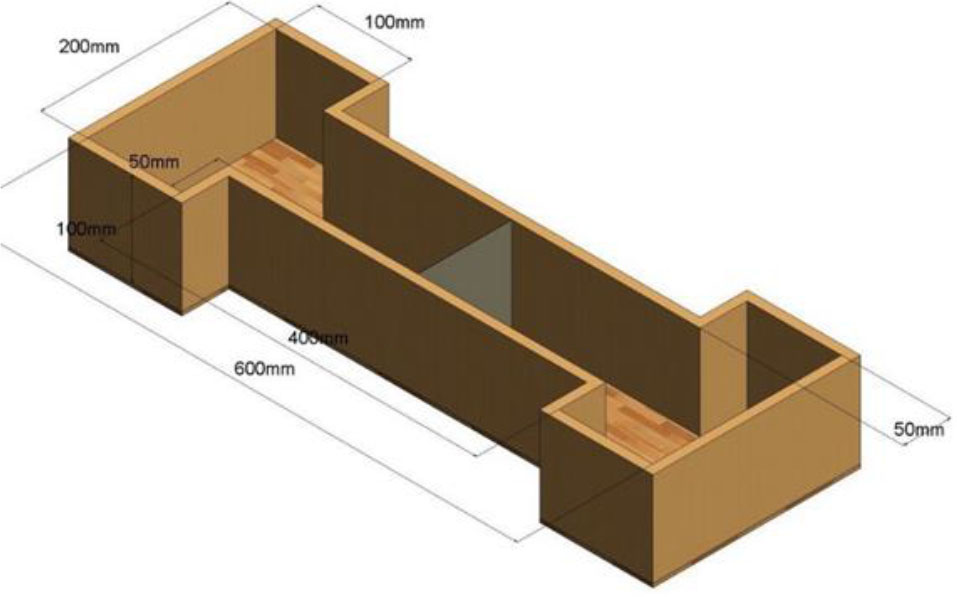
Figure 3:
I shape mold
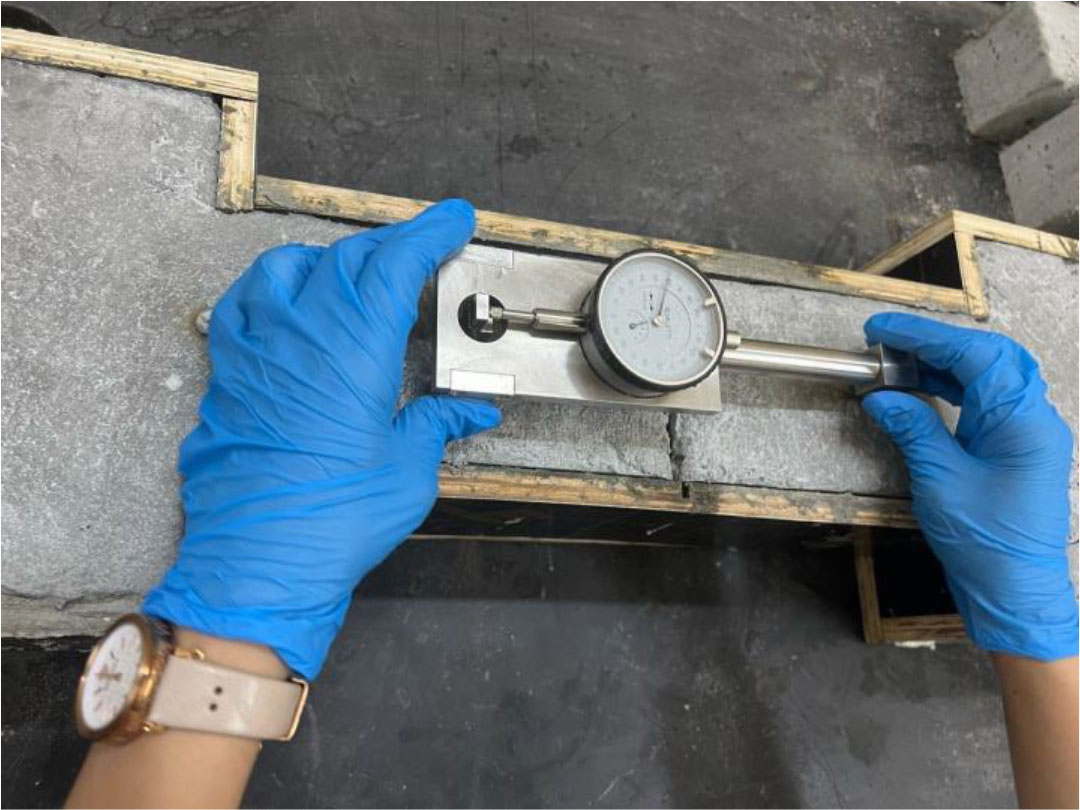
Figure 4:
I-shaped specimen with central groove and Demec points, showing the autogenous shrinkage test setup using a mechanical extensometer
Table 2:
Result of dry bulk density
| Mix symbol | Dry bulk density at 28 [d] [kg/m3] |
|---|---|
| Rw | 2510 |
| Rair | 2504 |
| WAPB | 2300 |
| 50% LWA | 2017 |
| Hybrid | 2049 |
| LWAw | 1783 |
| LWAair | 1712 |
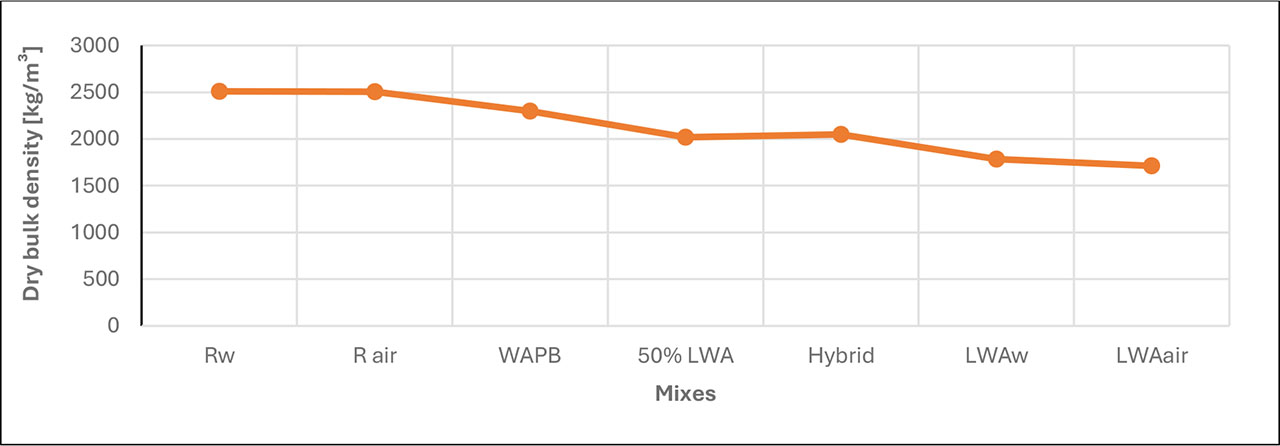
Figure 5:
Relationship between dry bulk density and mixes at 28 [d]
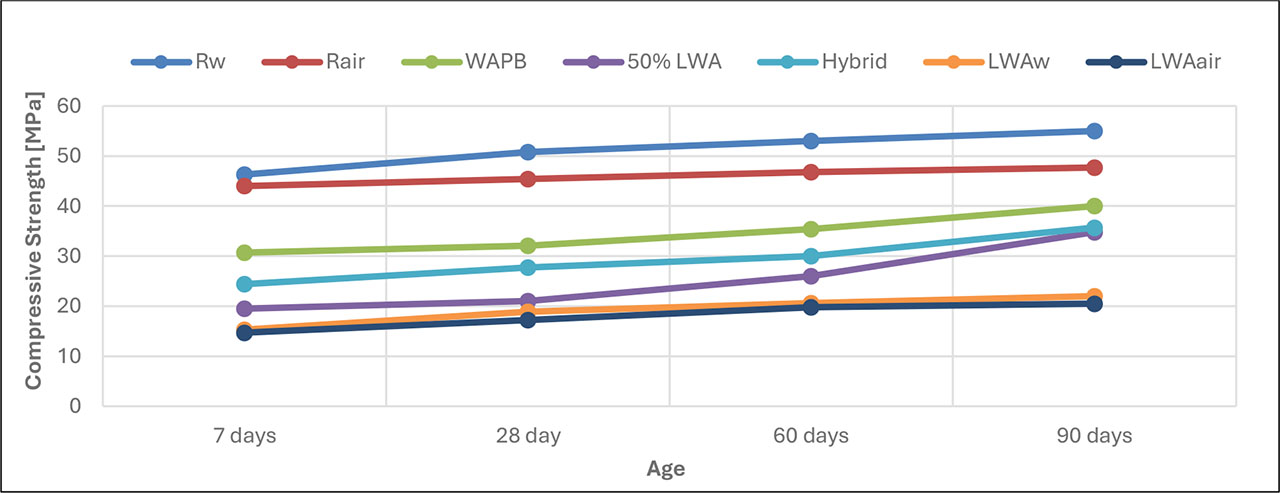
Figure 6:
Compressive strength development of different mixes with time
Table 3:
Results of compressive strength test [MPa]
| Mix symbol | 7 [d] | 28 [d] | 60 [d] | 90 [d] |
|---|---|---|---|---|
| Rw | 46.3 | 50.8 | 53 | 55 |
| Rair | 44 | 45.4 | 46.8 | 47.7 |
| WAPB | 30.7 | 32.1 | 35.4 | 40 |
| 50% LWA | 19.5 | 21 | 26 | 34.8 |
| Hybrid | 24.4 | 27.7 | 30 | 35.7 |
| LWAw | 16.3 | 18.88 | 20.6 | 22 |
| LWAair | 15.7 | 17.23 | 19.8 | 20.5 |
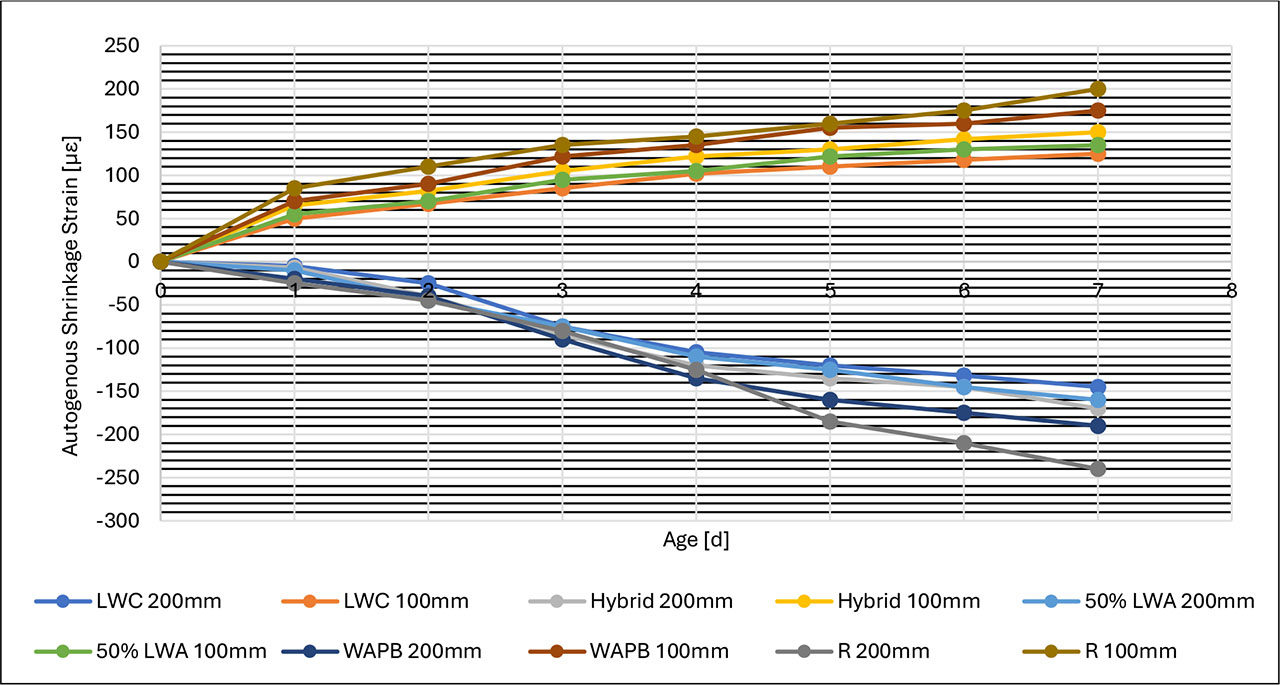
Figure 7:
Autogenous deformation of all mixtures up to 7 days at 100 mm (shrinkage) and 200 mm (groove opening) gauge locations