

Table 1:
Chemical characteristics of SRPC
| Chemical composition | Cement 1 B.I.=2.08 | Cement 2 B.I.=2.81 | Cement 3 B.I.=3.21 | IQS 5 (2019) limits % |
|---|---|---|---|---|
| SiO2 | 16.90 | 18.82 | 19.50 | |
| AL2O3 | 4.92 | 4.62 | 3.84 | |
| Fe2O3 | 4.60 | 4.00 | 5.01 | |
| CaO | 59.81 | 60.69 | 59.81 | |
| MgO | 2.27 | 2.27 | 1.14 | ≤5.0 |
| SO3 | 1.85 | 1.92 | 1.06 | ≤2.5 |
| Free lime | 1.21 | 1.28 | 1.19 | |
| Loss of ignition | 2.40 | 0.27 | 0.21 | ≤4.0 |
| Insoluble residue | 1.00 | 1.10 | 1.00 | ≤1.5 |
| Main compounds | ||||
| C3S | 36.99 | 51.05 | 54.40 | |
| C2S | 32.87 | 17.97 | 14.87 | |
| C3A | 2.55 | 2.45 | 1.70 | ≤3.5 |
| C4AF | 15.25 | 15.64 | 15.25 | |
| L.S.F. | 86.53 | 93.38 | 94.54 | |
Table 2:
Physical characteristics of SRPC
| Physical properties | Cement 1 B.I.=2.08 | Cement 2 B.I.=2.81 | Cement 3 B.I.=3.21 | IQS 5 (2019) limits % |
|---|---|---|---|---|
| Consistency | 0.29 | 0.29 | 0.285 | |
| Initial setting time [min.] | 120 | 105 | 90 | |
| Final setting time [min.] | 255 | 270 | 285 | |
| Autoclave % | 0.23 | 0.21 | 0.20 | ≤ 0.8 |
| Blaine fineness [cm2/g] | 3315 | 3365 | 3345 | |
| Compressive strength [N/mm2] | ||||
| 2-day | 18.3 | 16.5 | 15.2 | ≥ 10 |
| 28-day | 38.8 | 36.3 | 35.1 | ≥ 32.5 |
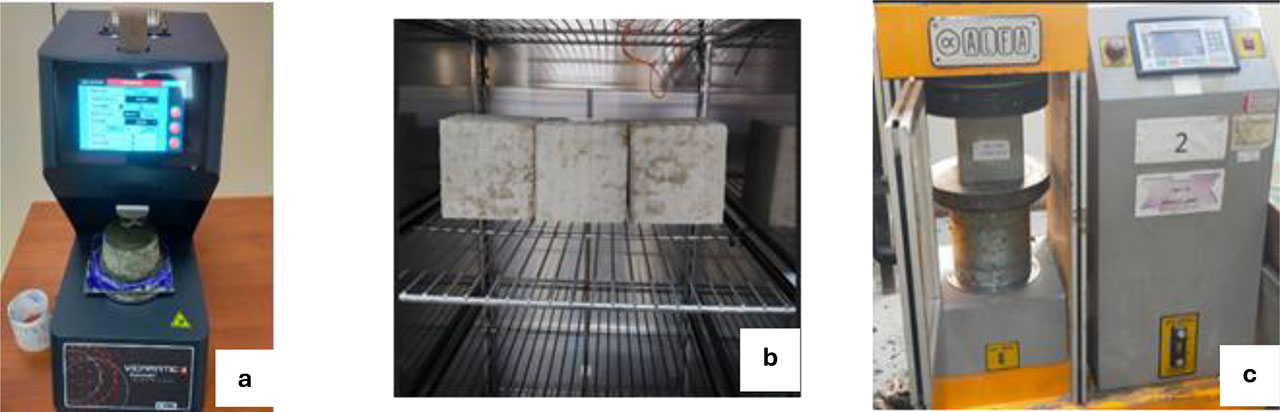
Figure 1 a: Final setting time test, Figure 1 b: Curing specimens, Figure 1 c: Compressive strength test
Table 3:
Ingredients of all concrete mixes
| Design strength [N/mm2] | Materials weight [kg/m3] | |||
|---|---|---|---|---|
| Cement | Fine. Agg. | Coarse Agg. | Water | |
| 20 | 300 | 770 | 1060 | 170 |
| 35 | 450 | 800 | 960 | 190 |
Table 4:
Final setting time with various burnability index at different temperatures
| Design strength [N/mm2] | B.I. | Final setting time [min.] | ||
|---|---|---|---|---|
| Temperature [°C] | ||||
| 7 | 21 | 34 | ||
| 20 | 2.08 | 285 | 255 | 240 |
| 2.81 | 300 | 270 | 255 | |
| 3.12 | 315 | 285 | 255 | |
| 35 | 2.08 | 270 | 255 | 240 |
| 2.81 | 285 | 255 | 240 | |
| 3.12 | 300 | 270 | 240 | |
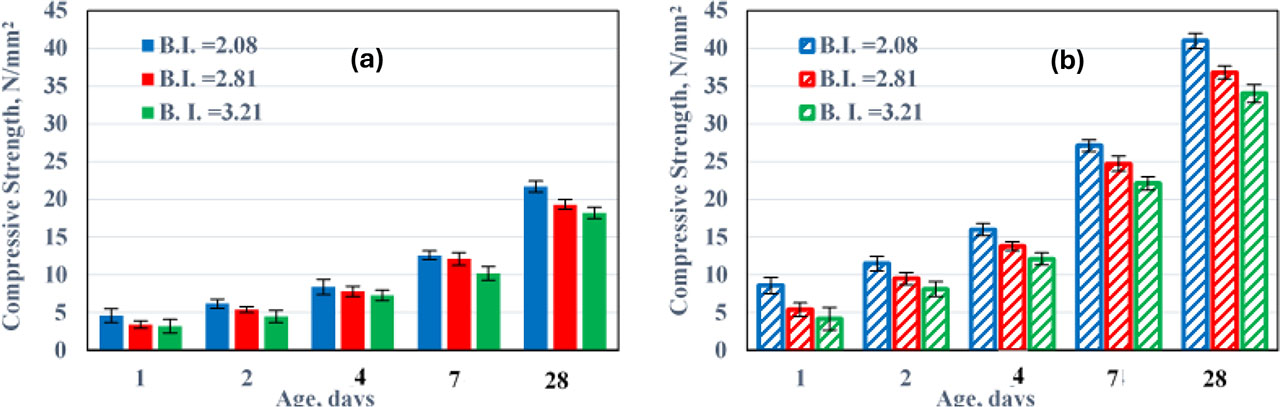
Figure 4:
Compressive strength of concrete specimens contained different burnability index, cured at 7 °C, (a) designated for 20 N/mm2, (b) designated for 35 N/mm2
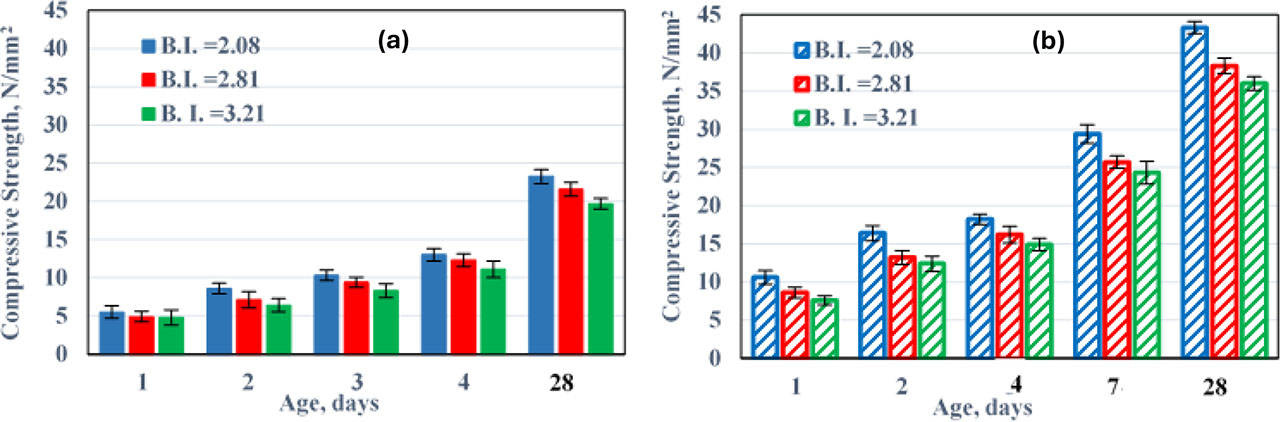
Figure 5:
Compressive strength of concrete specimens contained different burnability index, cured at 21 °C, (a) designated for 20 N/mm2, (b) designated for 35 N/mm2
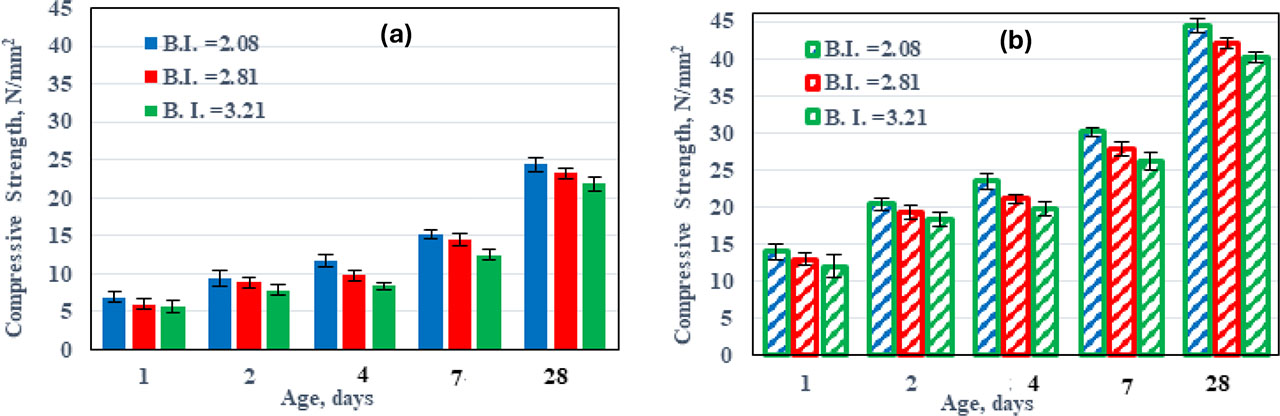
Figure 6:
Compressive strength of concrete specimens contained different burnability index, cured at 34 °C, (a) designated for 20 N/mm2, (b) designated for 35 N/mm2
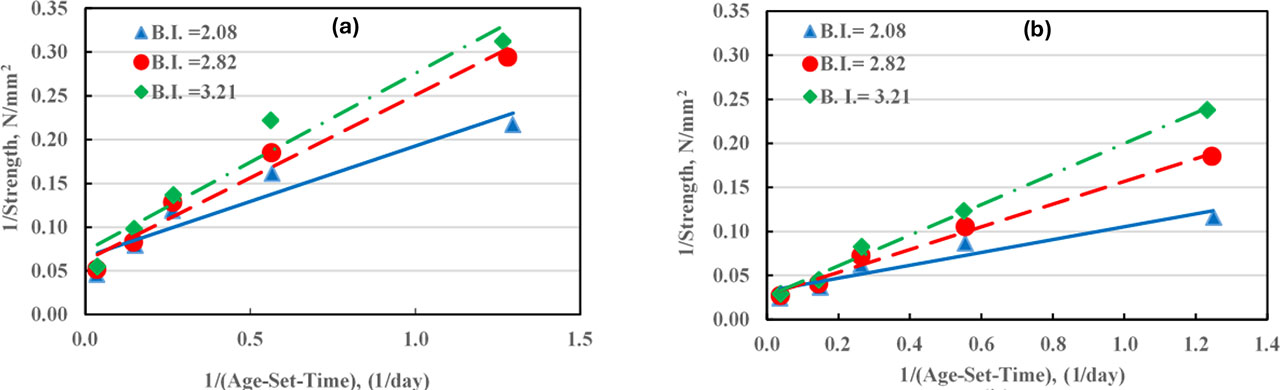
Figure 7:
Inverse of strength against inverse of age after time of final set-time, cured at 7 °C, (a) designated for 20 N/mm2, (b) designated for 35 N/mm2
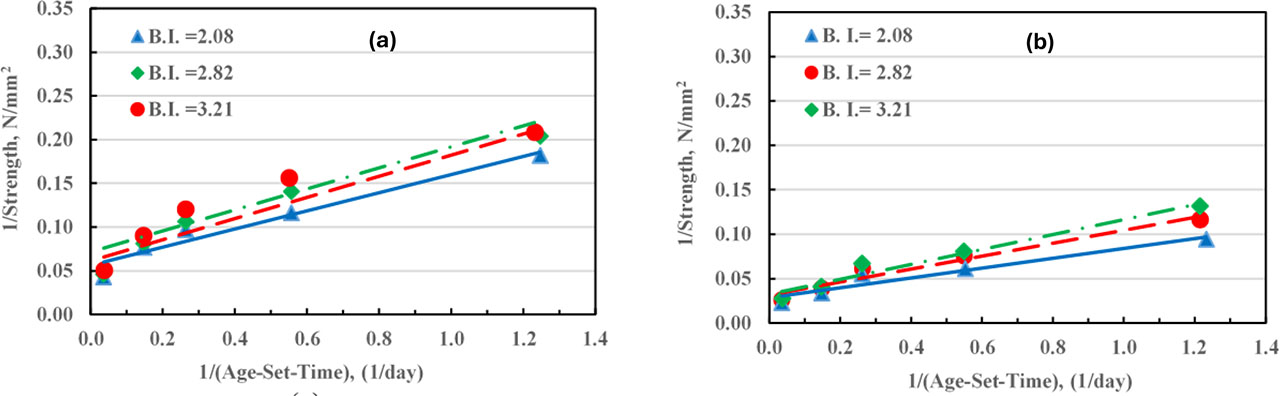
Figure 8:
Inverse of strength against inverse of age after time of final set-time, cured at 21 °C, (a) designated for 20 N/mm2, (b) designated for 35 N/mm2
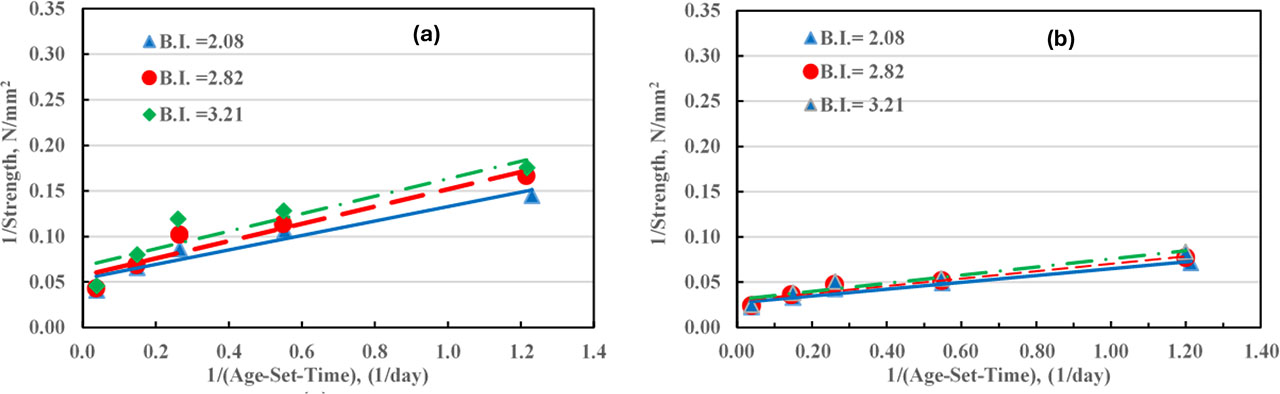
Figure 9:
Inverse of strength against inverse of age after time of final set-time, cured at 34 °C, (a) designated for 20 N/mm2, (b) designated for 35 N/mm2
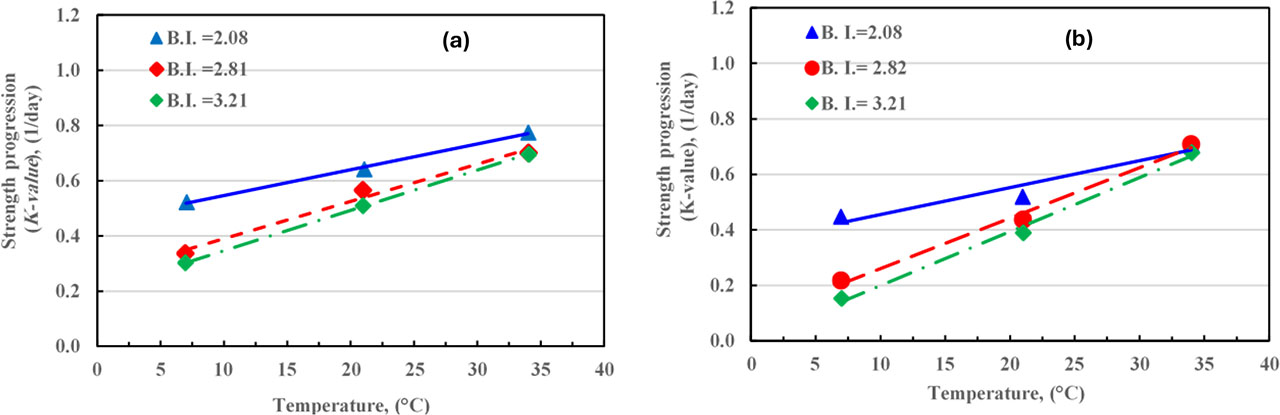
Figure 10:
Strength progression (K-value) against curing temperature, (a) designated for 20 N/mm2, (b) designated for 35 N/mm2
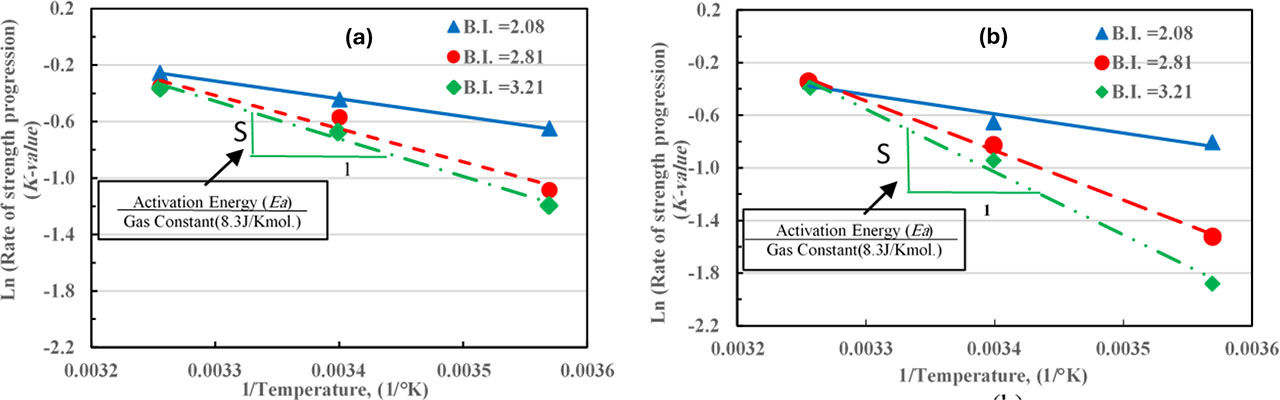
Figure 11:
Logarithmic of k-value against inverse curing temperature, (a) designated for 20 N/mm2, (b) designated for 35 N/mm2
Table 5:
Strength progression (k-value) and activation energy (Ea) of concrete
| B.I. | Strength progression (K –value) [1/day] % | Activation energy (Ea) [J/mol] | ||||||
|---|---|---|---|---|---|---|---|---|
| Strength design [N/mm2] | Strength design [N/mm2] | |||||||
| 20 | 35 | |||||||
| Curing temperature [°C] | 20 | 35 | ||||||
| 7 | 21 | 34 | 7 | 21 | 34 | |||
| 2.08 | 54.5 | 58.9 | 69.3 | 44.7 | 52.0 | 71.1 | 10,443 | 12,159 |
| 2.81 | 30.3 | 50.9 | 69.6 | 21.8 | 43.7 | 70.9 | 19,557 | 31,321 |
| 3.21 | 33.7 | 56.6 | 70.1 | 15.3 | 38.9 | 67.9 | 22,159 | 39,697 |
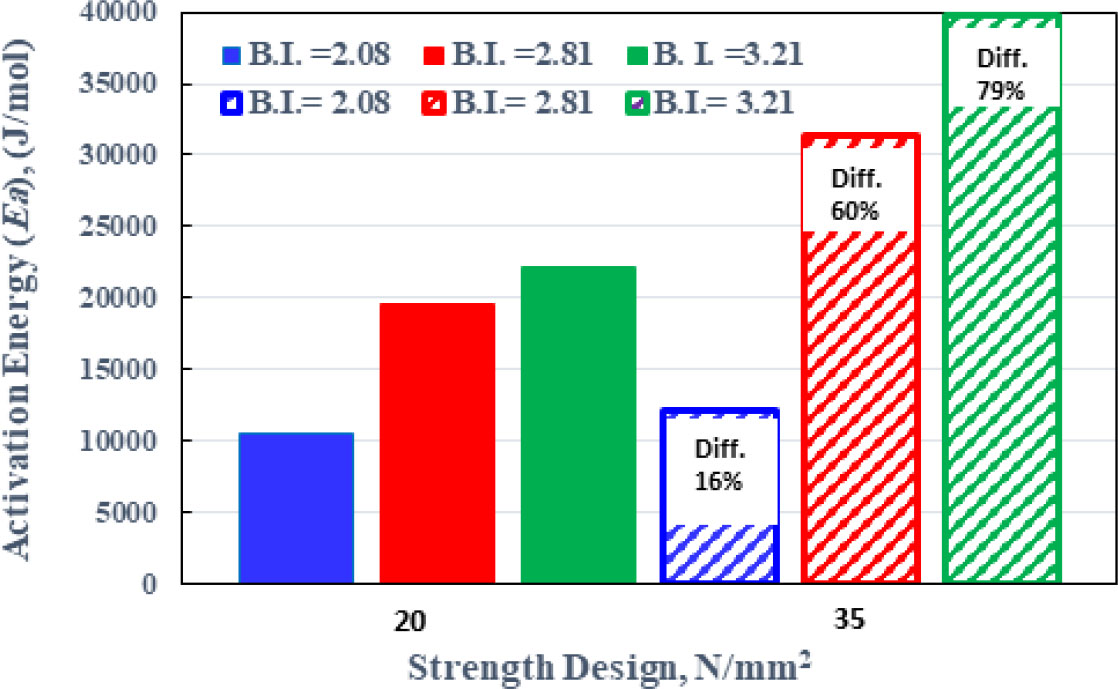
Figure 12:
Activation energy of concrete containing different B.I. designed for 20 and 35 N/mm2