

1. Introduction
Using sulphate-resistant Portland cement (SRPC) has been beneficial for the constructions exposed to alkaline soil or sulphate salts in water that could be a threat for concrete containing conventional Portland cement. The basic compounds of Portland cement are C3S, C2S, C3A, and C4AF, with other minor constituents. The C3S and C2S are mostly responsible for producing hydration products; C3S, however, hydrates quicker than C2S, and it is reliable for early strength progression (Mindess et al., 2003), (Neville, 2011), and (Labidi et al., 2018). C3A is more sensitive to concrete contact with sulfate because it reacts with expansive gel, causing cracks; therefore, C3A should be limited for the concrete subjected to sulphate salts. The modification of the conventional Portland cement is necessary to withstand the environmental conditions, and SRPC could be manufactured by optimizing the chemical composition of cement, limiting the percentage of C3A to below 3%, and adjusting (2C3A+C4AF) to less than 20%. This can be achieved by a high kiln temperature to maintain the stability of these compounds and simulate the easy clinker formation, represented by the burnability index that equals the ratio of silica and alumina to iron oxide (C3S/(C4AF+C3A)) (Labidi et al., 2018). The burnability index plays a role in cement properties and production efficiency and is affected by cement composition, kiln temperature, and residence time. In 2013, the effect of curing temperature was evaluated on cement properties, specifically the development of C-S-H and strength for late ages. The study found that increasing temperature exhibited a denser layer of C-S-H (Rolo, 2013). Radu and Ghizdavet (2016) statistically investigated the correlation degree for different burnability indices in raw mixes obtained from industry and laboratories to select the optimum raw mix. Radu and Ghizdavet (2017) also theoretically examined the intensity of burnability impact by the basicity gradient of oxides within raw materials. The study found the burnability, represented by CaO, has a strong effect, and it should be considered for the optimal oxide composition in the clinker and raw materials. Korkmaz (2019) explored the hypothesis that burnability can be significantly affected by the basicity gradient among the oxides standing in the raw meal. The study uses a high-temperature X-ray deviation (HT-XRD) to define the mass transfer of unprocessed meal components to clinker phases and the pre0sence of free CaO (burnability). It reveals intermediate phases and early reactions in the kiln of cement. The quartz particle size affects crystal expansion and SiO2 polymorph formation, but there's a lack of knowledge about β-quartz's influence on free CaO reduction. Labidi and Megriche (2022) examined the stability of manufacturing of SRPC by optimizing the integration of natural raw materials, including limestone, siliceous limestone, black and grey marl, iron, and fluorescence. The optimization depended on the variation between the burnability index and the chemical composition of each raw material. The results concluded the interaction of fluorescence in the required raw meals, based on the calculations and chemical composition of each material, while considering the variation in the burning modulus. Zhao et al. (2025) evaluated the critical factors (C3S and C2S) impact on strength development through curing time and then utilized them to optimize the manufacture of cement to be suitable for sustainable buildings. A study by Ahmed and Ibrahim (2025) utilized an adopted approach of ASTM C1074 to estimate the rate of strength progression (K-value) in the concrete contained variation replacements of pozzolanic materials at different curing temperatures to calculate the activation energy of each concrete and estimate the strength in terms of this energy.
The main motivation for this study was due to some engineering projects in the city that encountered variations in compressive strength values, especially at early ages, and fluctuations between winter and summer. Therefore, the study focused specifically on evaluating the effect of the burnability index, a value that varies during the production of SRPC. The significance of this study is to assess the behavior of concrete mixes containing SRPC from different sources that are locally available based on strength progression. The assessment included analysis of the combination effect of C3S, C3A, and C4AF, expressed by the burnability index, in variation samples of SRPC on strength progression from early to standard test ages at different curing temperatures. The strength gaining was identified by calculating the activation energy of SRPC, following the methodology of ASTM C1074 (2019), at three curing temperatures (7°C, 21°C, and 34°C) for three samples of SRPC. The study additionally examined the effect of the burnability index in combination with cement quantity on the rate of strength gained by testing two groups of mixes designed for two compressive strengths (20 N/mm2 and 35 N/mm2).
2. Methodology
2.1. Research Design
The study experimentally examined the rate of strength progression for concrete prepared from three samples of SRPC, each with a specific burnability index (2.08, 2.81, or 3.21), and cured at three temperatures of 7°C, 21°C, and 34°C at different ages of 1, 2, 4, 7, and 28 days. The study was applied on two groups of concrete, one with a design strength of 20 N/mm2 and another with a design strength of 35 N/mm2.
2.2. Materials and Procedure
Materials:
Cement: Three samples of SRPC, with different proportions of compounds, were used for all mixes in a grade of 32.5. The chemical and physical characteristics of cement are listed in Table 1 and Table 2.
Aggregate: For fine aggregate, the river sand, obtained from Kanhash in Iraq, was used with a maximum size of 2.36mm. The fineness modulus of fine aggregate is 2.85. The specific gravity of fine aggregate is 2.56, and absorption is 1.7%, based on ASTM C128 (2022). For coarse aggregate, natural coarse aggregate, obtained from Kanhash in Iraq, was used with a maximum size of 19 mm. The specific gravity is 2.67, and absorption is 0.8%. The gradation of all aggregates meets the specifications in ASTM C136 (2020). All mixes used aggregate in the saturated-surface dry (SSD) status.
Water:
For mixing and curing, tap water was used.
Table 1:
Chemical characteristics of SRPC
| Chemical composition | Cement 1 B.I.=2.08 | Cement 2 B.I.=2.81 | Cement 3 B.I.=3.21 | IQS 5 (2019) limits % |
|---|---|---|---|---|
| SiO2 | 16.90 | 18.82 | 19.50 | |
| AL2O3 | 4.92 | 4.62 | 3.84 | |
| Fe2O3 | 4.60 | 4.00 | 5.01 | |
| CaO | 59.81 | 60.69 | 59.81 | |
| MgO | 2.27 | 2.27 | 1.14 | ≤5.0 |
| SO3 | 1.85 | 1.92 | 1.06 | ≤2.5 |
| Free lime | 1.21 | 1.28 | 1.19 | |
| Loss of ignition | 2.40 | 0.27 | 0.21 | ≤4.0 |
| Insoluble residue | 1.00 | 1.10 | 1.00 | ≤1.5 |
| Main compounds | ||||
| C3S | 36.99 | 51.05 | 54.40 | |
| C2S | 32.87 | 17.97 | 14.87 | |
| C3A | 2.55 | 2.45 | 1.70 | ≤3.5 |
| C4AF | 15.25 | 15.64 | 15.25 | |
| L.S.F. | 86.53 | 93.38 | 94.54 | |
Table 2:
Physical characteristics of SRPC
| Physical properties | Cement 1 B.I.=2.08 | Cement 2 B.I.=2.81 | Cement 3 B.I.=3.21 | IQS 5 (2019) limits % |
|---|---|---|---|---|
| Consistency | 0.29 | 0.29 | 0.285 | |
| Initial setting time [min.] | 120 | 105 | 90 | |
| Final setting time [min.] | 255 | 270 | 285 | |
| Autoclave % | 0.23 | 0.21 | 0.20 | ≤ 0.8 |
| Blaine fineness [cm2/g] | 3315 | 3365 | 3345 | |
| Compressive strength [N/mm2] | ||||
| 2-day | 18.3 | 16.5 | 15.2 | ≥ 10 |
| 28-day | 38.8 | 36.3 | 35.1 | ≥ 32.5 |
Procedures:
The experimental work included measuring the final setting time of three samples of SRPC pastes and the compressive strength of SRPC concretes prepared with different burnability index.
Final setting time test:
Two groups of SRPC paste were examined for final setting time, which indicates the time required for the cement paste to turn to the hardened condition. Each group had a different amount of cement, as shown in Table 3. Each group included nine samples; three of them owned a specific B.I. of 2.08, 2.81, and 3.21 and were cured at three temperatures of 7°C, 21°C, and 34°C. A Vicat Needle Test was utilized in this study to measure the final setting time for all SRPC pastes, following ASTM C191 (2021), as shown in Figure 1 a.
Compressive strength test:
Two groups of SRPC concrete specimens were cast in 150 mm cubes, designed for two compressive strengths of 20 N/mm2 and 35 N/mm2. Each group included forty-five specimens; each fifteen specimens owned a specified B.I. and were cured at three temperatures of 7°C, 21°C, and 34°C, as shown in Figure 1 b. All specimens were tested at an early age, up to the standard age of 28 days, as shown in Figure 1 c. The mix proportions of the first group were 1:2.57:3.53/0.57, while the proportions for the second one were 1:1.78:2.13/0.42, as listed in Table 3. All specimens were subjected to a compressive strength test following BS EN 12390-4 (2000) at 1, 2, 4, 7, and 28 days to examine the real strength and monitor the strength development.
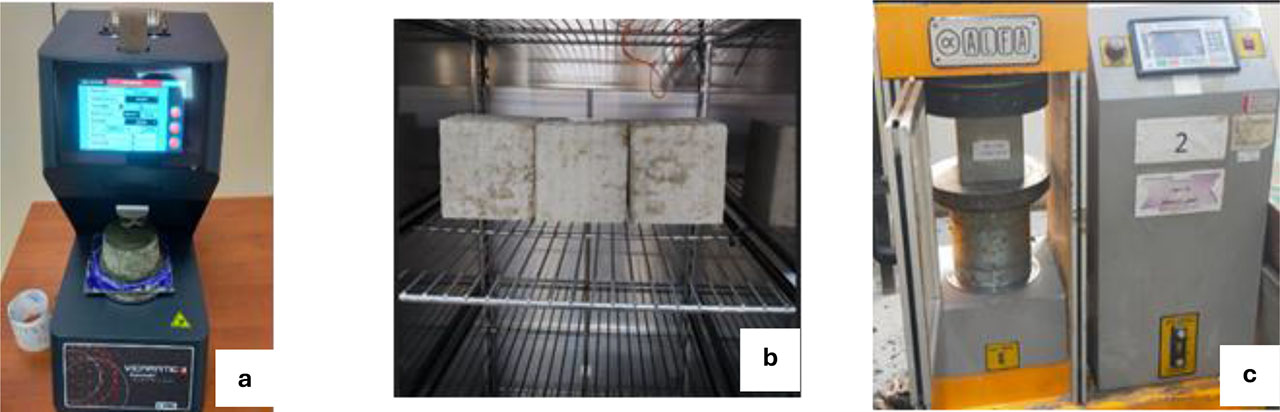
Figure 1 a: Final setting time test, Figure 1 b: Curing specimens, Figure 1 c: Compressive strength test
2.3. Data Collection
The rate of strength progression (K-value) of concrete was calculated following a method recommended by ASTM C1074 (2019). Therefore, the method requires determination of the final setting time of all SRPC pastes. Nine pastes of SRPC were examined for the final setting time; each three pastes contained the B.I. of 2.08, 2.81, or 3.12 and were placed at 7°C, 21°C, or 34°C. To monitor the K-value of concrete mixes, 270 cubic SRPC concrete specimens were tested for the compressive strength; each 135 specimens were designed for a strength of either 20 or 35 N/mm2. The 135 specimens were separated into three groups, each with different B.I., cured at different temperatures, and tested at ages of 1, 2, 4, 7, and 28 days. The compressive strength of each age was equal to the average of the compressive strength of three specimens.
3. Results
Final setting time:
The results of the final setting time for three SRPC pastes are listed in Table 4. The results showed that the final setting time of cement increases with increasing B.I. and decreasing curing temperature. In addition, the SRPC pastes that contained a greater amount of cement induced a reduction in final setting time.
Table 4:
Final setting time with various burnability index at different temperatures
| Design strength [N/mm2] | B.I. | Final setting time [min.] | ||
|---|---|---|---|---|
| Temperature [°C] | ||||
| 7 | 21 | 34 | ||
| 20 | 2.08 | 285 | 255 | 240 |
| 2.81 | 300 | 270 | 255 | |
| 3.12 | 315 | 285 | 255 | |
| 35 | 2.08 | 270 | 255 | 240 |
| 2.81 | 285 | 255 | 240 | |
| 3.12 | 300 | 270 | 240 | |
Compressive Strength:
The findings of strengths for two groups of concrete at different ages are depicted in Figure 4, Figure 5, and Figure 6 for curing temperatures of 7°C, 21°C, and 34°C, respectively. The results showed that the compressive strength generally increased with the raising of the curing temperature, and this increase was consistent at all curing temperatures. The compressive strength of concrete, however, decreased with increasing the B.I. of SRPC concrete, specifically at the age of 28 days, as shown in the figures. The effect of B.I. on the strength reduction of concrete was increased with lower curing temperature of 7°C. In addition, the reduction in strength with increasing B.I. was more pronounced in the concrete that contained a high cement quantity (35 N/mm2) compared with other concrete. Based on the results of Student T-Test, the effect of B.I. on strength reduction of concrete was significant at all ages and temperatures.
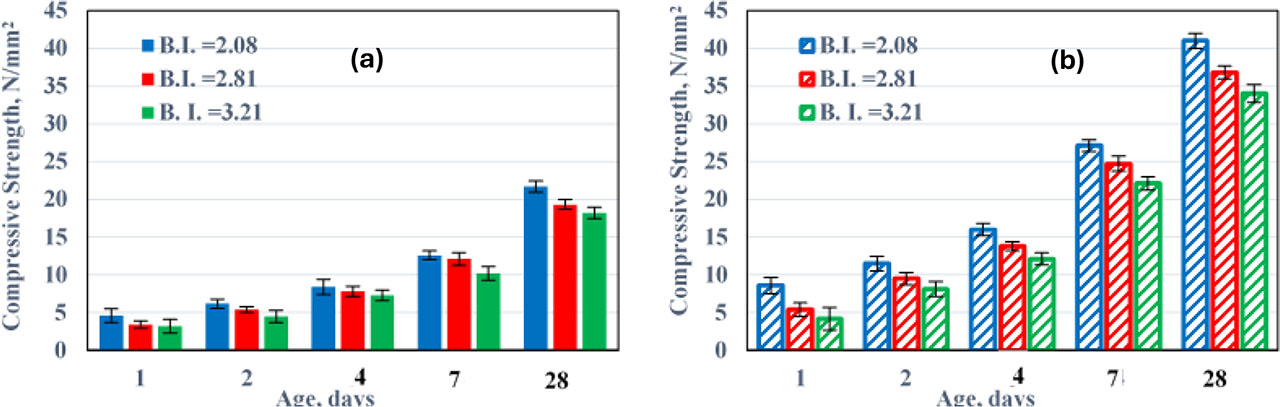
Figure 4:
Compressive strength of concrete specimens contained different burnability index, cured at 7 °C, (a) designated for 20 N/mm2, (b) designated for 35 N/mm2
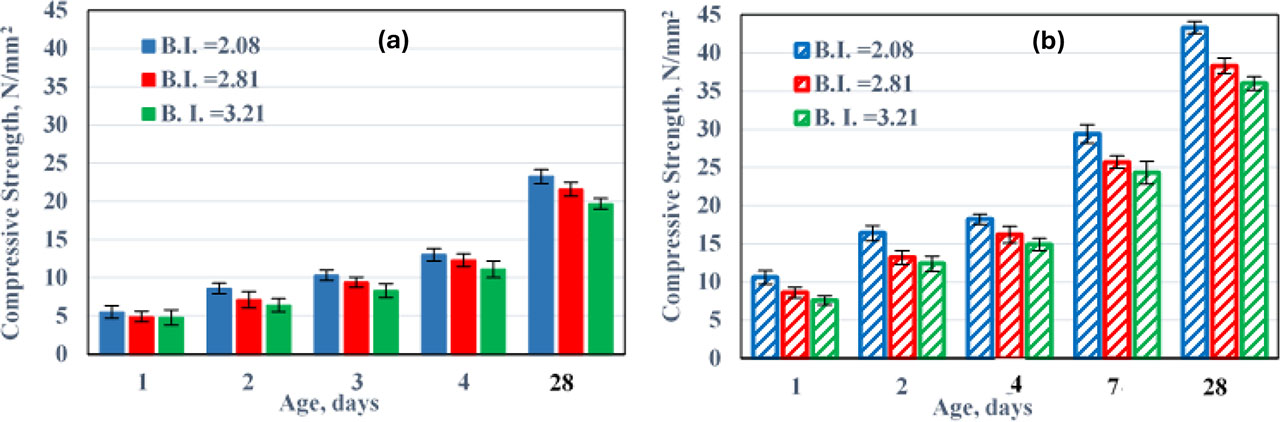
Figure 5:
Compressive strength of concrete specimens contained different burnability index, cured at 21 °C, (a) designated for 20 N/mm2, (b) designated for 35 N/mm2
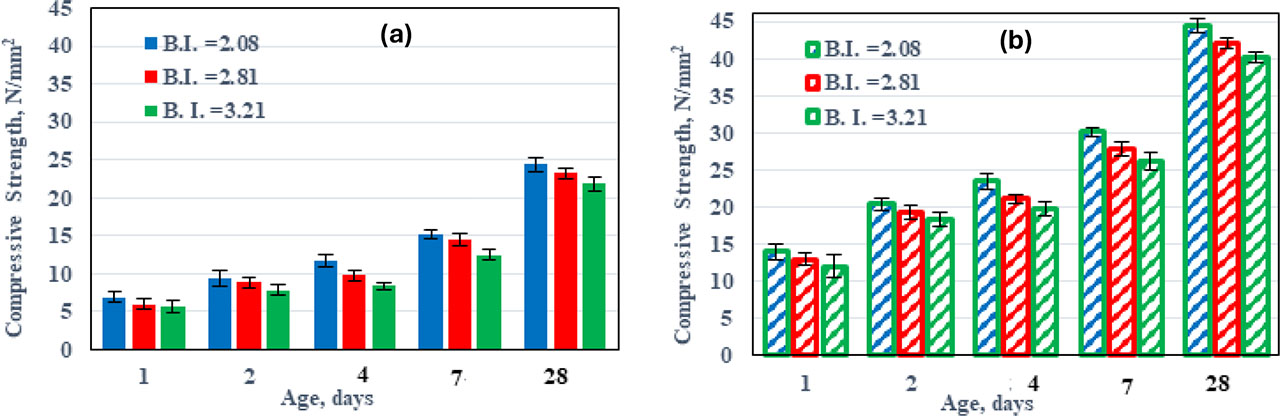
Figure 6:
Compressive strength of concrete specimens contained different burnability index, cured at 34 °C, (a) designated for 20 N/mm2, (b) designated for 35 N/mm2
Strength progression (K-value):
ASTM C1074 (ASTM C1074, 2019) was used to detect the rate of strength development (K-value) at different curing temperatures. A strength inverse was plotted against the inverse of the age beyond final-set time at three curing temperatures (7°C, 21°C, and 34°C) and two groups of strength, as shown in Figure 7, Figure 8, and Figure 9, respectively. The decline and interception of the best-fit line for the last three figures of each group was then used to calculate the strength propagation (K-value) for each temperature and two groups of strength, as seen in Figure 10. The results found that a B.I. of cement significantly impacts strength development (K-value) at low temperature (7°C), especially for the concrete strength design of 35 N/mm2, according to Student T-Test results. Thus, the difference in K-value when the B.I. increased from 2.08 to 3.21 was 66% at 7°C, while the difference between them reached 25% at 21°C and ended at 9% at 34°C.
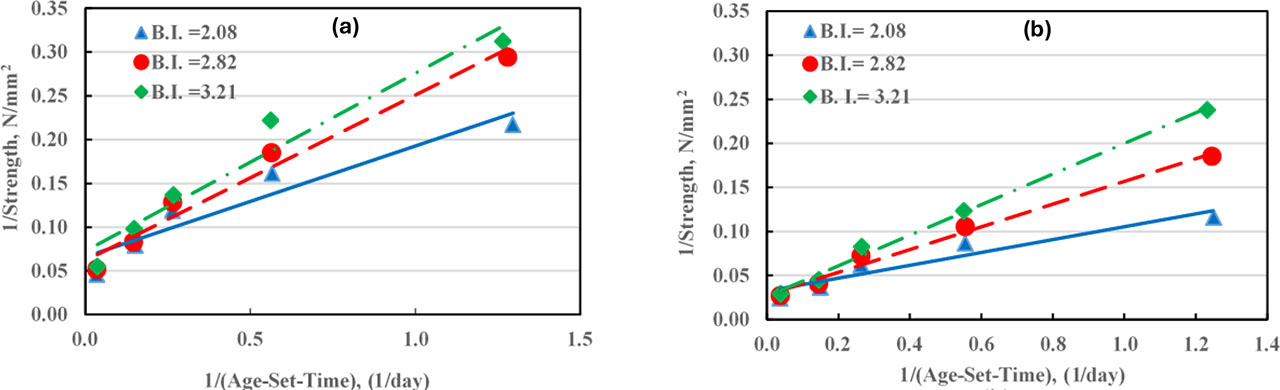
Figure 7:
Inverse of strength against inverse of age after time of final set-time, cured at 7 °C, (a) designated for 20 N/mm2, (b) designated for 35 N/mm2
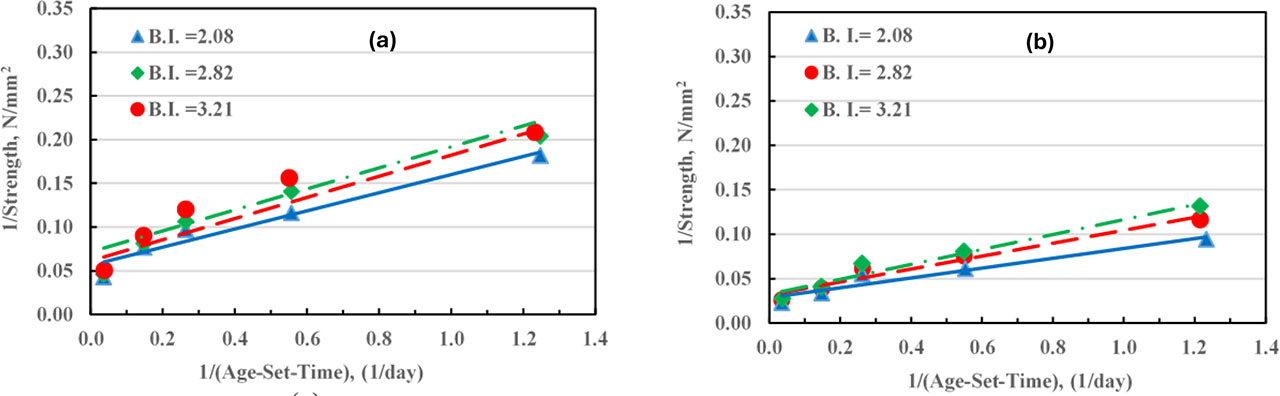
Figure 8:
Inverse of strength against inverse of age after time of final set-time, cured at 21 °C, (a) designated for 20 N/mm2, (b) designated for 35 N/mm2
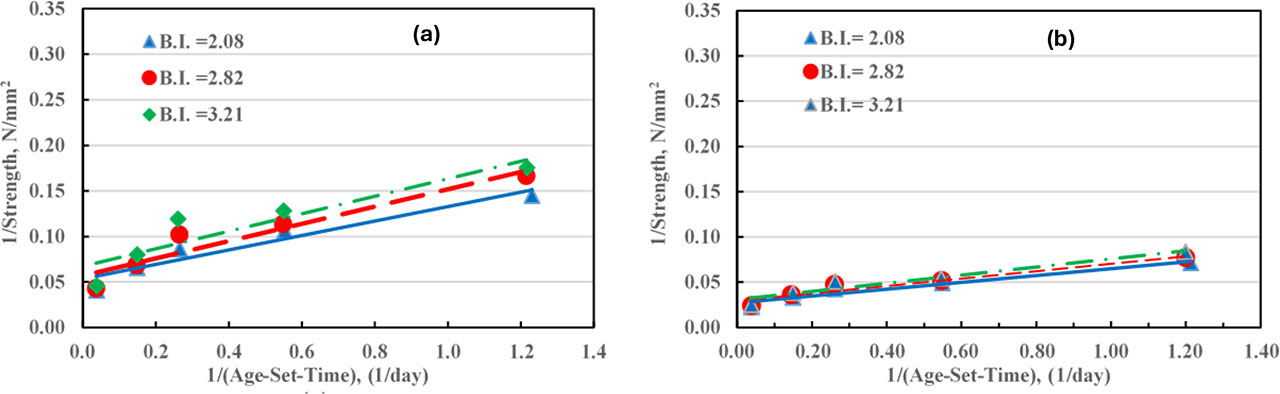
Figure 9:
Inverse of strength against inverse of age after time of final set-time, cured at 34 °C, (a) designated for 20 N/mm2, (b) designated for 35 N/mm2
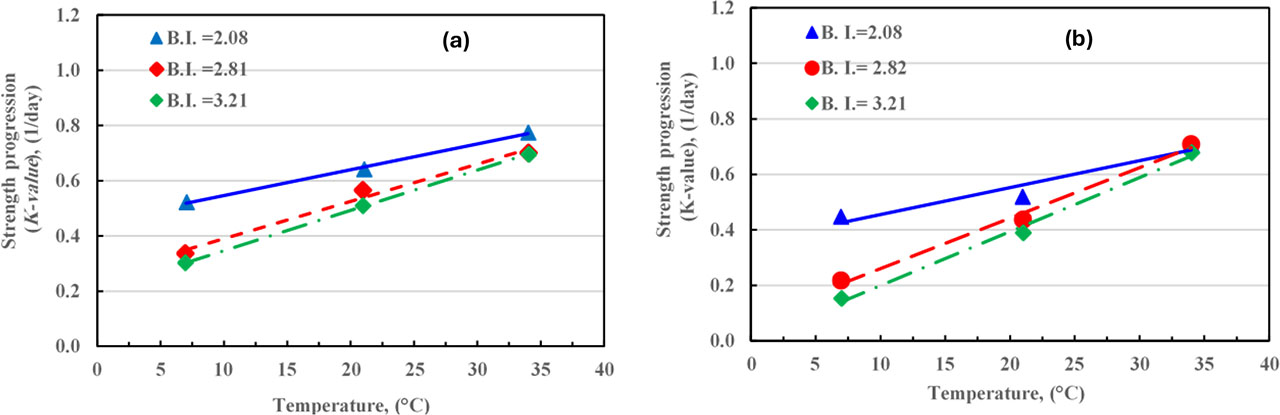
Figure 10:
Strength progression (K-value) against curing temperature, (a) designated for 20 N/mm2, (b) designated for 35 N/mm2
Verification strength progression using activation energy (Ea:):
Finally, to verify the strength progression at different temperatures, an activation energy (Ea) was calculated utilizing an approach adopted in ASTM C1074. A relationship between the logarithm of the K-value and inverse temperature was figured, as shown in Figure 11. The S value that represented the slope of the fitting line was found for each B.I. and then multiplied by the gas constant (G) to calculate Ea, following Eq. 1 in ASTM C1074 (ASTM C1074, 2019). All K-values and Ea are announced in Table 5. The comparison of the Ea for concrete containing different B.I. for both strengths (20 and 35 N/mm2) is shown in Figure 12. The results concluded that the Ea increased with increasing the B.I.; this increase was more pronounced in higher amount of cement.
Where:
Ea - activation energy [J/mol],
G - constant of Gas = [8.314 /Jmole k],
S - slope of fit line to the logarithmic of (1/setting time [hr.]) against 1/Temp. [Kelvin].
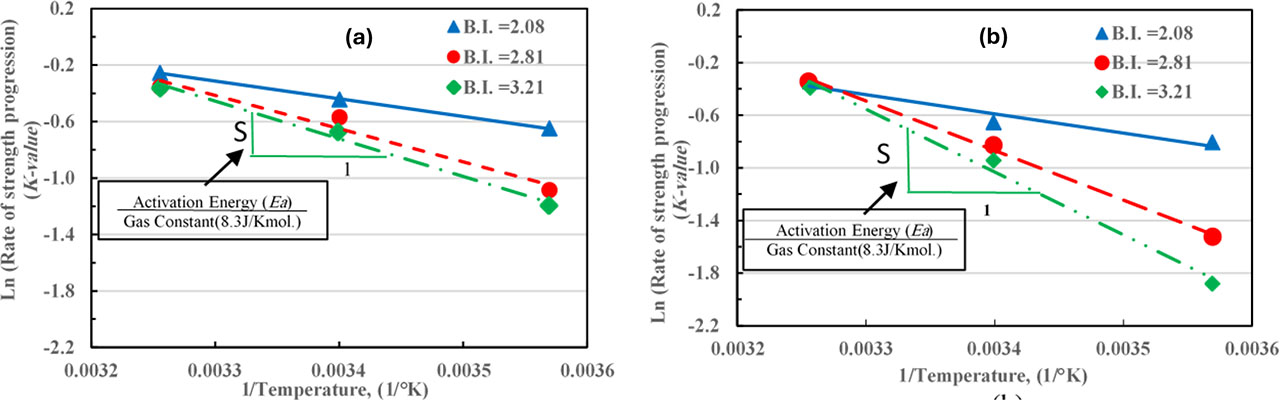
Figure 11:
Logarithmic of k-value against inverse curing temperature, (a) designated for 20 N/mm2, (b) designated for 35 N/mm2
Table 5:
Strength progression (k-value) and activation energy (Ea) of concrete
| B.I. | Strength progression (K –value) [1/day] % | Activation energy (Ea) [J/mol] | ||||||
|---|---|---|---|---|---|---|---|---|
| Strength design [N/mm2] | Strength design [N/mm2] | |||||||
| 20 | 35 | |||||||
| Curing temperature [°C] | 20 | 35 | ||||||
| 7 | 21 | 34 | 7 | 21 | 34 | |||
| 2.08 | 54.5 | 58.9 | 69.3 | 44.7 | 52.0 | 71.1 | 10,443 | 12,159 |
| 2.81 | 30.3 | 50.9 | 69.6 | 21.8 | 43.7 | 70.9 | 19,557 | 31,321 |
| 3.21 | 33.7 | 56.6 | 70.1 | 15.3 | 38.9 | 67.9 | 22,159 | 39,697 |
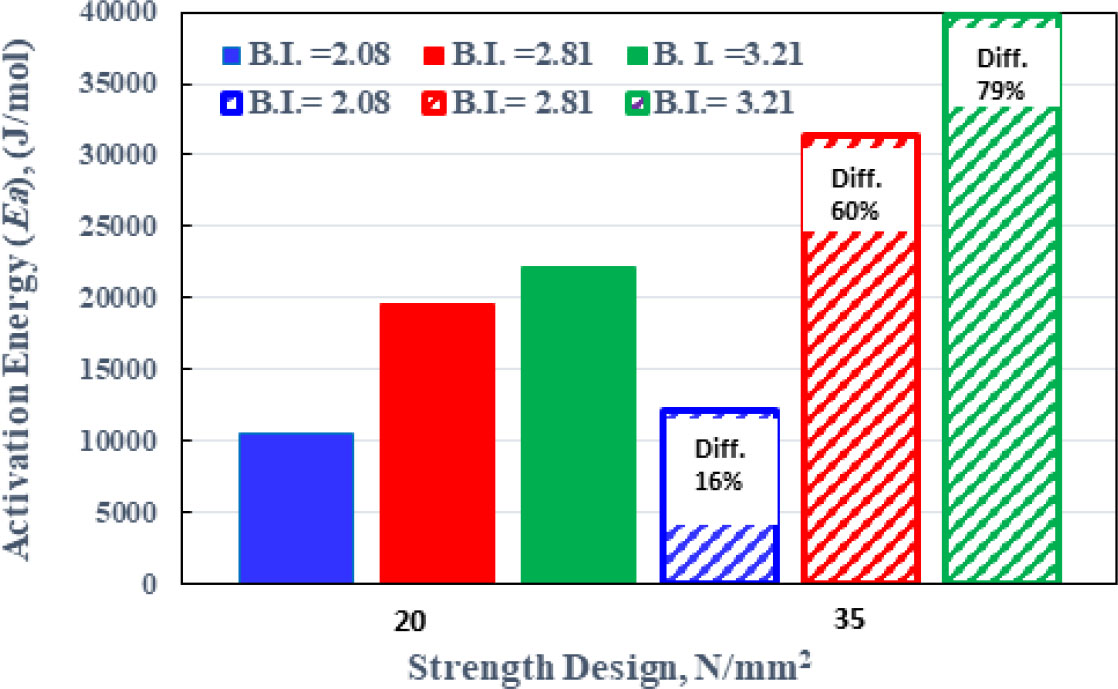
Figure 12:
Activation energy of concrete containing different B.I. designed for 20 and 35 N/mm2
3. Discussion
The increase of B.I. exhibited an increase of the final setting time of cement because of C3A's impact on accelerating cement hydration and shortening the final setting time, and the presence of sulfates in the SRPC interacts with the C3A, affecting the formation of hydrated products and further modulating the setting behavior (Zacak et al., 2007). In addition, increasing curing temperature accelerated the cement hydration process, reducing the final setting time. Besides, the 35 N/mm2 specimens that contained a greater amount of cement induced a reduction in final setting time compared to the 20 N/mm2 specimens, due to the increase of surface area of cement particles that accelerates cement hydration (Mindess, 2003) and (Neville, 2011). The compressive strengths of concrete generally increased with the raising of the curing temperature, and this increase was consistent at all curing temperatures. Higher temperature increases the kinetic energy of molecules, causing more reactions and gaining strength (Labidi et al., 2018), (Mindess, 2003), and (Ahmed et al., 2023). The compressive strength of concrete, however, decreased by increasing the B.I. at all ages, specifically at 28 days, as shown in the figures. The reduction in strength with increasing B.I. was significantly increased with lower curing temperature of 7°C. In addition, this reduction in strength was more pronounced in the concrete that contained a high amount of cement (35 N/mm2) compared to the other. The percentage decrease in strength at 28 days was 17% for 35 N/mm2 concrete compared to 9% for 20 N/mm2 concrete at 21°C. In terms of the rate of strength development (K-value) of concrete, the results established that a B.I. of cement impacts the K-value at low temperature (7°C). Thus, the difference in K-value when the B.I. increased from 2.08 to 3.21 was 66% at 7°C, while the difference between them reached 25% at 21°C and ended at 9% at 34°C. The results also revealed that the effect of B.I. on K-value was more observed in the concrete containing a high cement quantity (35 N/mm2). For activation energy (Ea), the results revealed that the Ea increased with increasing the B.I.; this increase was more pronounced with higher amounts of cement. The difference in Ea between two strengths reached 44% for B.I. of 3.21, 38% for B.I. of 2.81, and 14% for B.I. of 2.08, as shown in Figure 12.
4. Conclusions
The interaction effect of the basic compounds of SRPC (C3S, C3A, and C4AF), represented by the burnability index (B.I.) (C3S/(C3A+C4AF)), was examined on the strength progressing with time at different seasons (using various curing temperatures of 7°C, 21°C, and 34°C). In addition, the impact of cement quantity was also evaluated along with B.I. on the rate of strength development. The study concluded the following points:
The increase in B.I. of SRPC slightly reduces cement hydration, causing an increase in the final setting time of SRPC paste.
The increase in B.I. of SRPC reduces the compressive strength of SRPC concrete from early to later ages (28 days), at which the impact is more observed.
The effect of B.I. of SRPC on the reduction of compressive strength of SRPC concrete increases with lower curing temperature (7°C).
The effect of B.I. of SRPC on the reduction of compressive strength of SRPC concrete is more pronounced in the concrete that contained a higher amount of cement (concrete strength design of 35 N/mm2).
The effect of B.I. of SRPC on the rate of strength development (k-value) is more observed in the concrete containing a higher amount of cement (concrete strength design of 35 N/mm2), and this effect increases at low curing temperatures.
The increase of B.I. of SRPC dramatically increases the activation energy (Ea) in concrete, especially in concrete containing a higher amount of cement (concrete strength design of 35 N/mm2).
Acknowledgements
Many thanks to all workers in the Construction Materials Lab/Civil Engineering/The University of Mosul for their assistance in performing the experimental part of this research.
Notes
[1] Contributed by Author Contributions
I.E. conducted the experiments, performed the statistical analysis, and contributed to data interpretation and manuscript drafting. A.S. conceived and outlined the study, collected the data, and contributed to data interpretation. All authors critically reviewed and approved the final version of the manuscript and agreed to be accountable for all aspects of the work.