

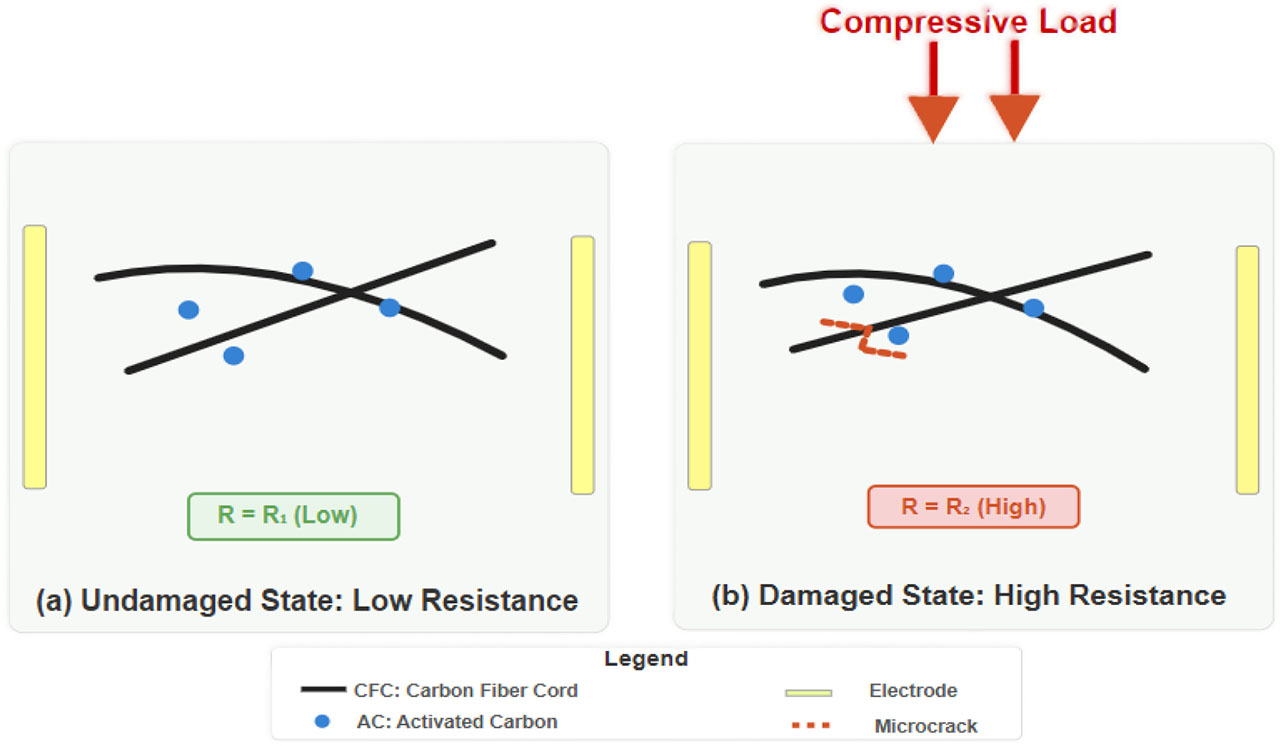
Figure 1:
Diagram of the piezoresistive self-sensing mechanism in the proposed hybrid ECC: (a) Undamaged condition: low-resistance conductive network (R1), and (b) Damaged condition under load: high-resistance conductive network (R2)
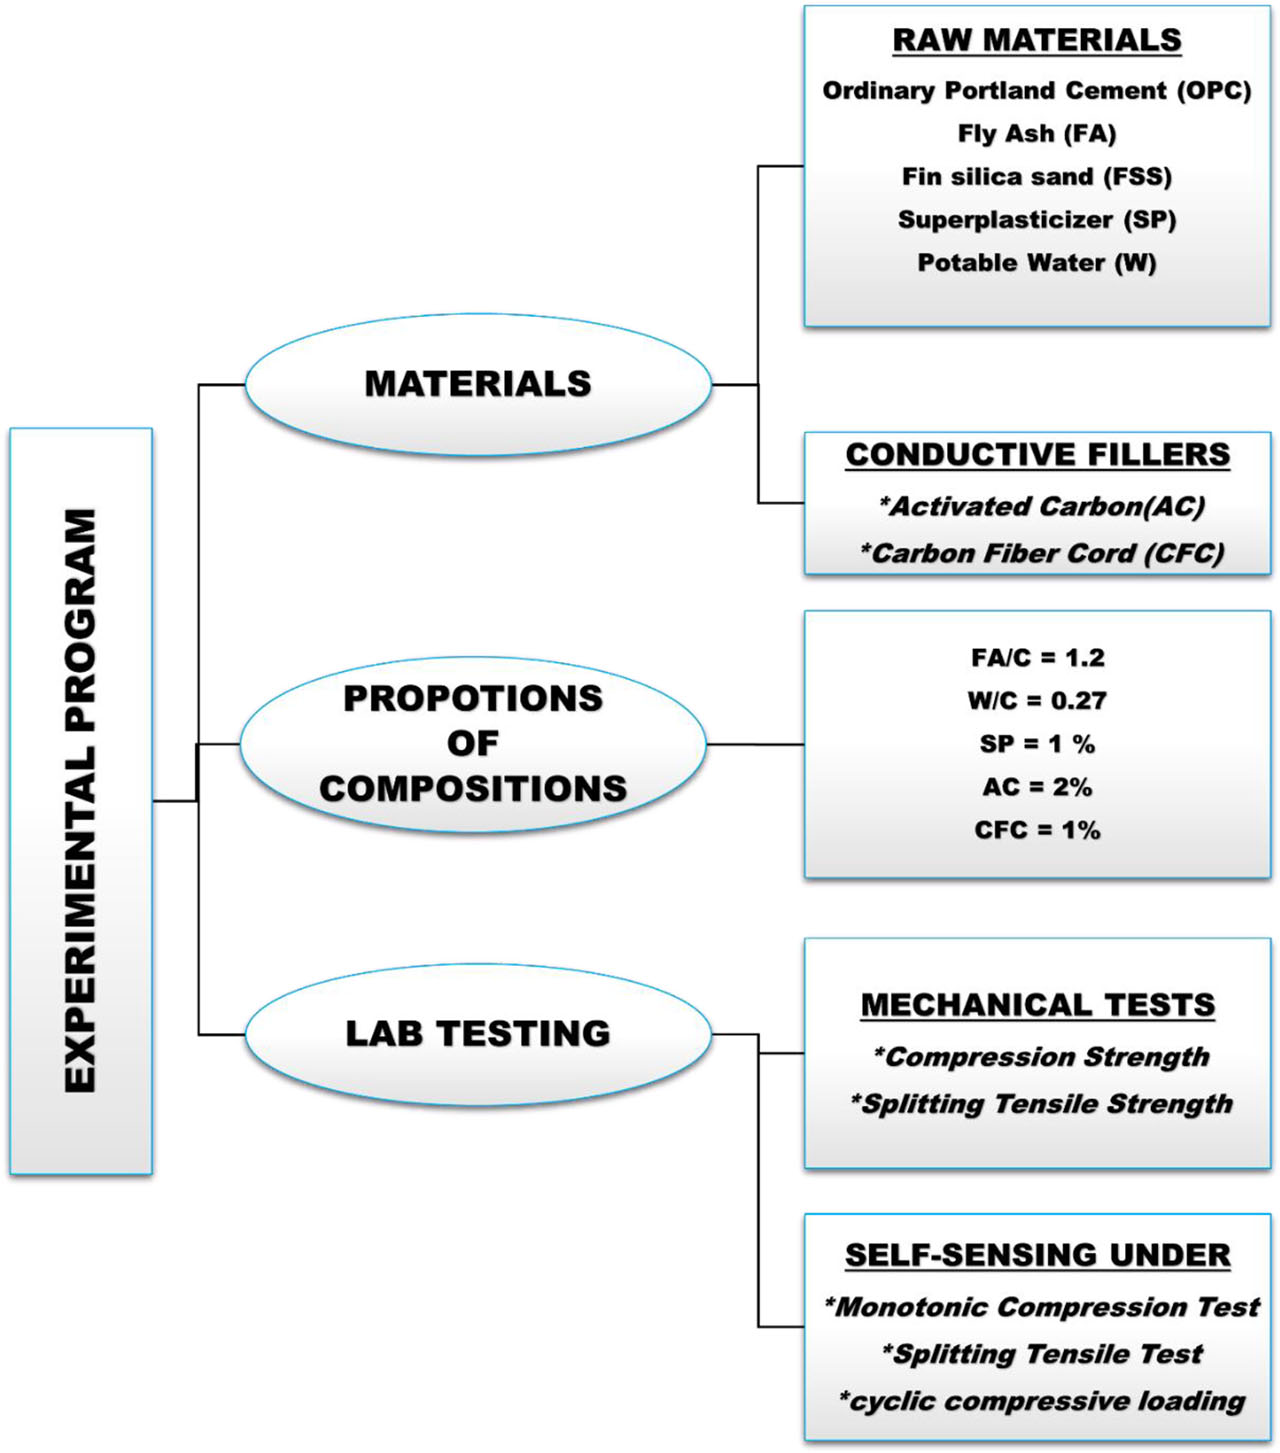
Figure 2:
Flowchart of the experimental work
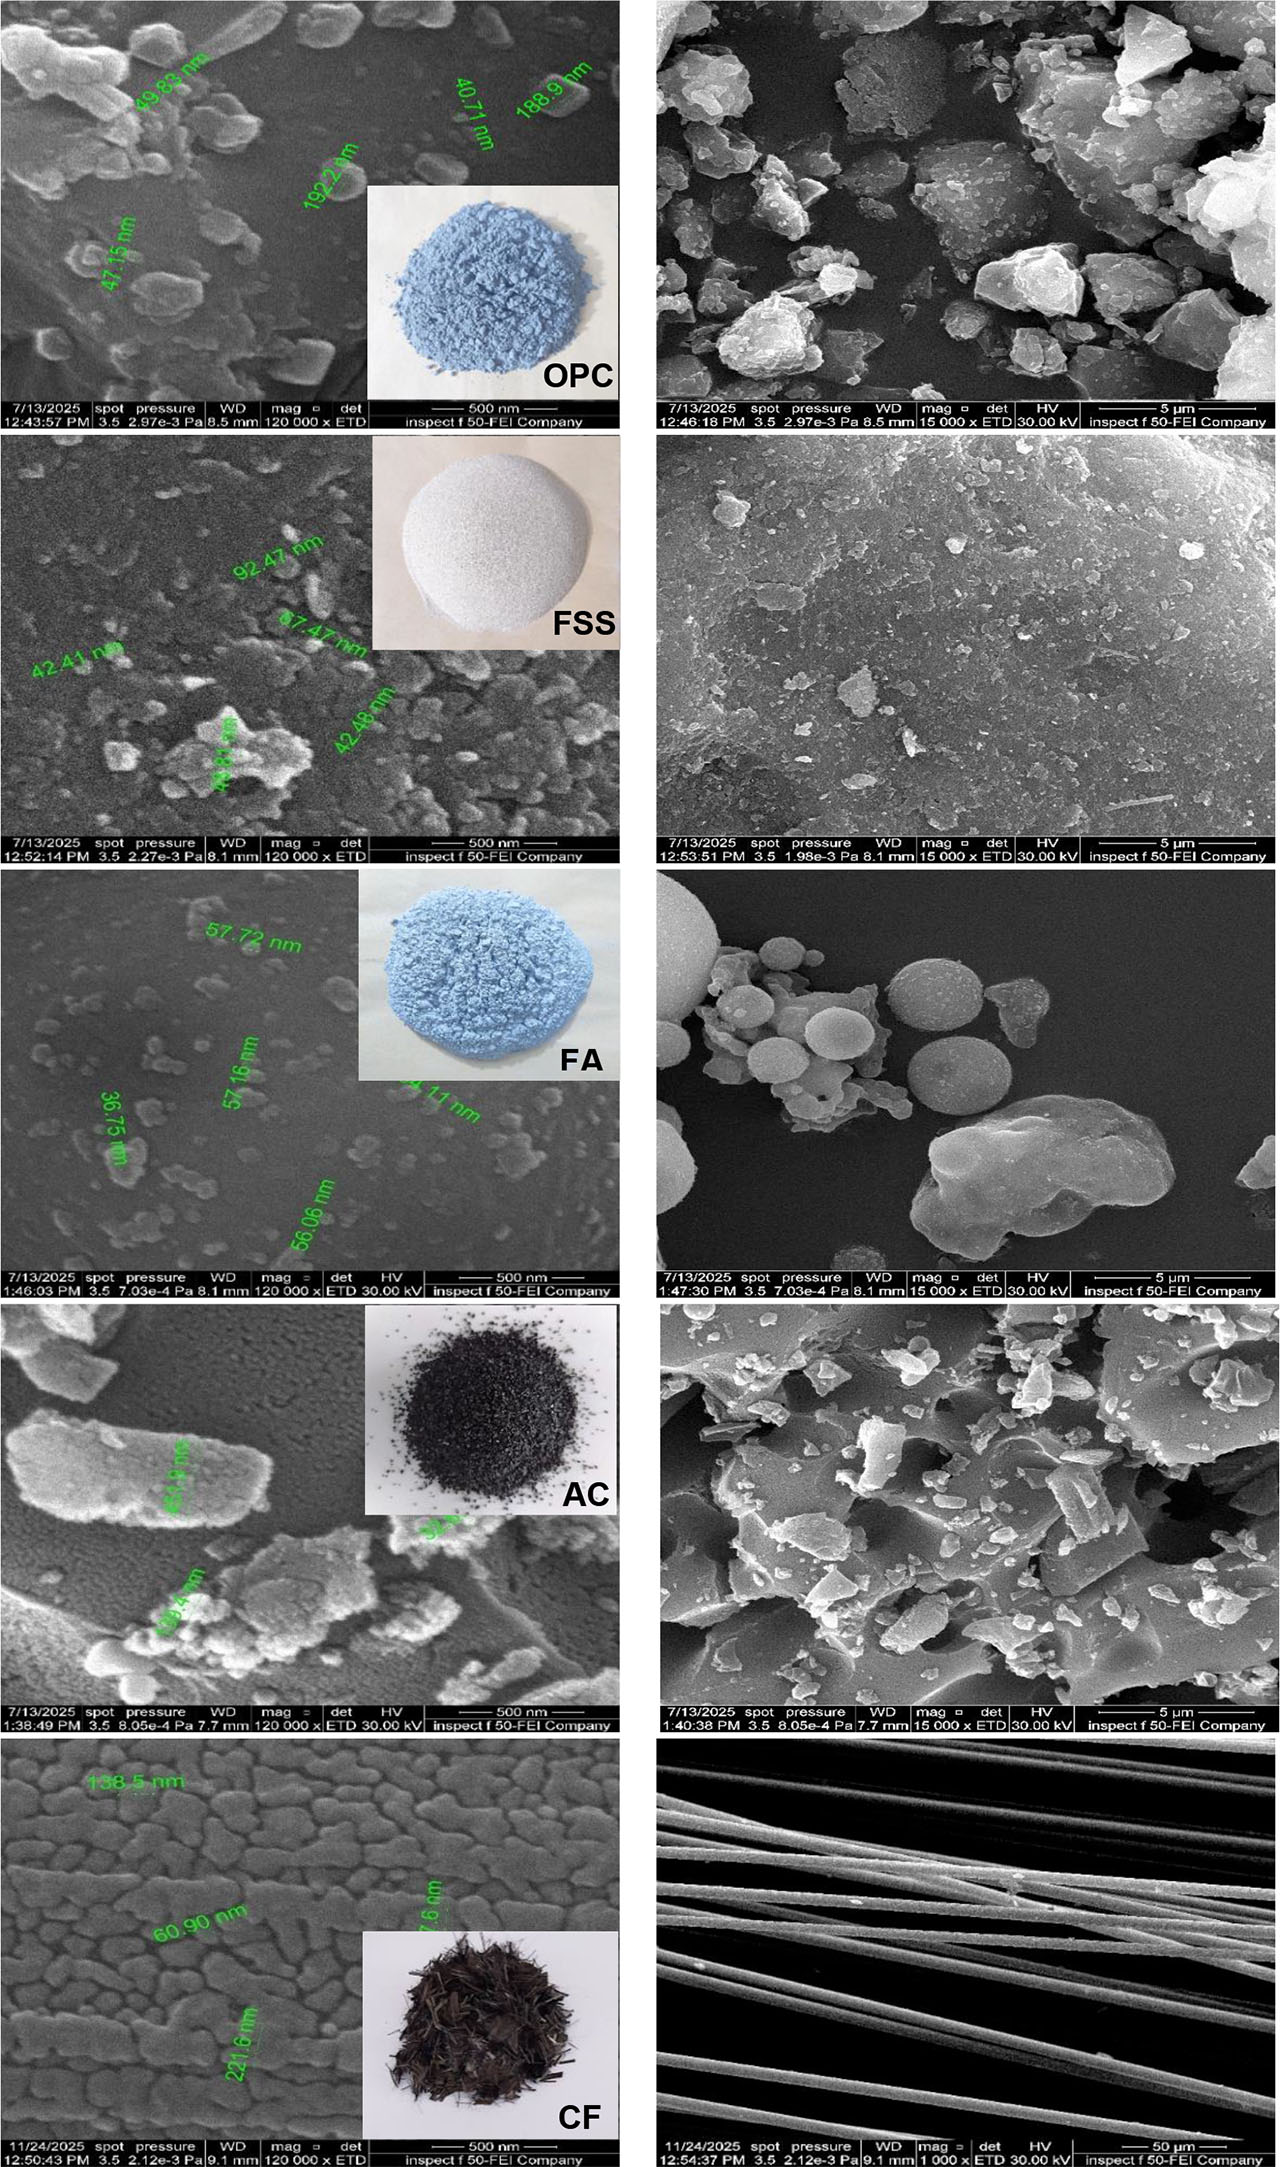
Figure 3:
Digital picture of the base and conductive materials, with FESEM images of each material, Nanoscale on the left and microscale on the right
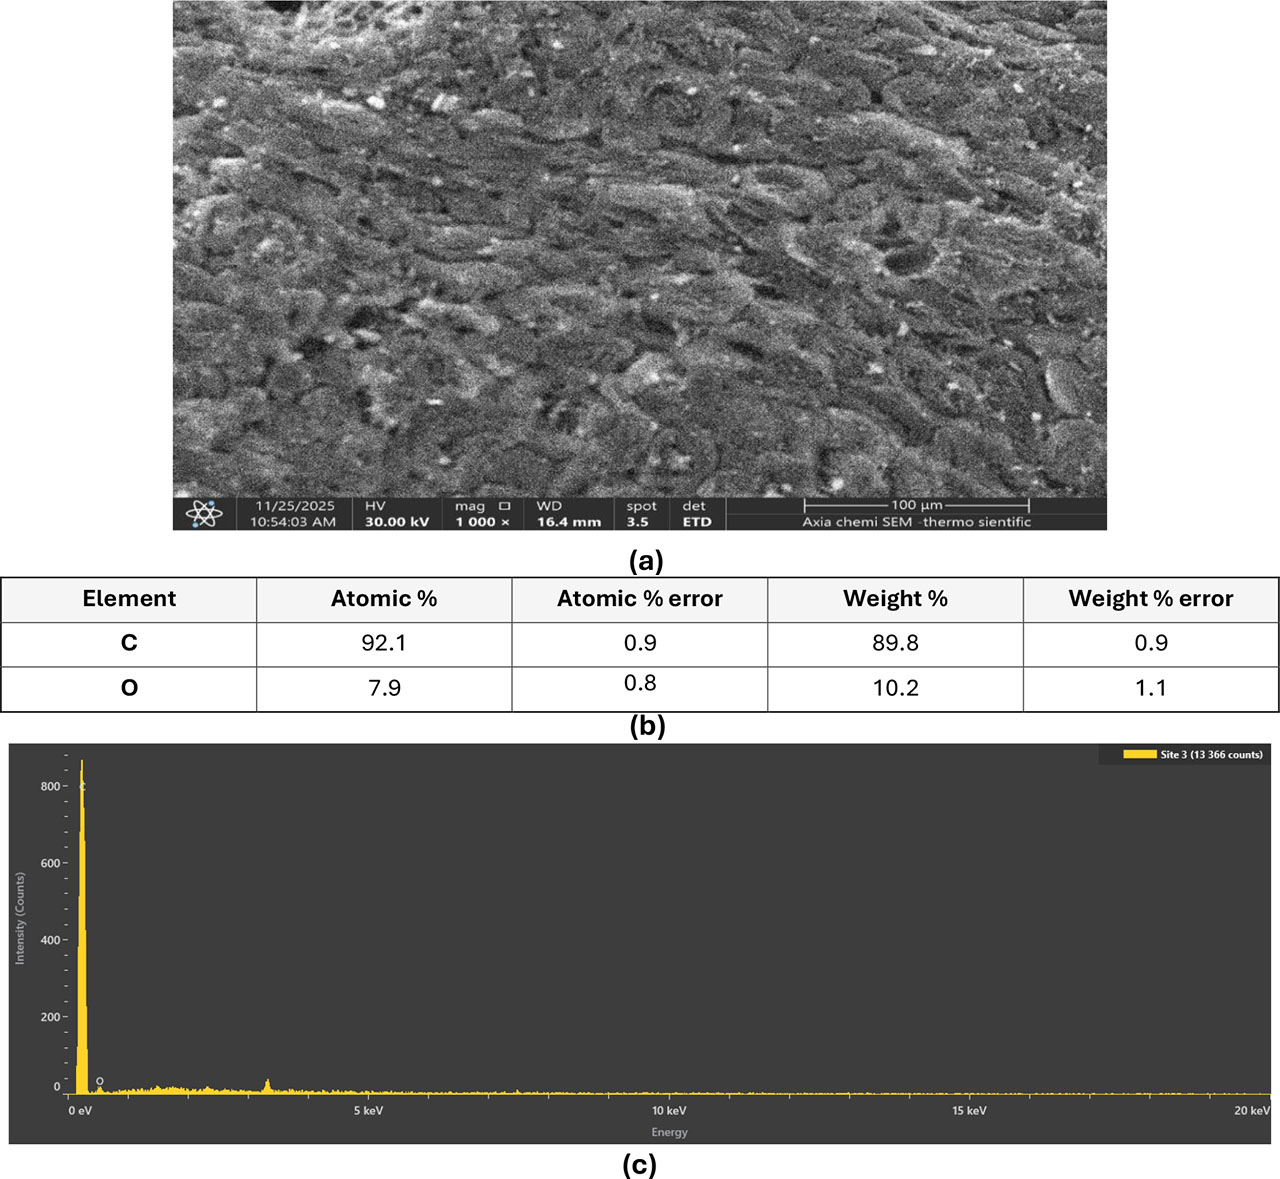
Figure 4:
EDS analysis of AC: (a) SEM image [1000× magnification; 30 kV]. (b) Quantitative EDS analysis [weight percentage]. (c) Corresponding EDS spectrum
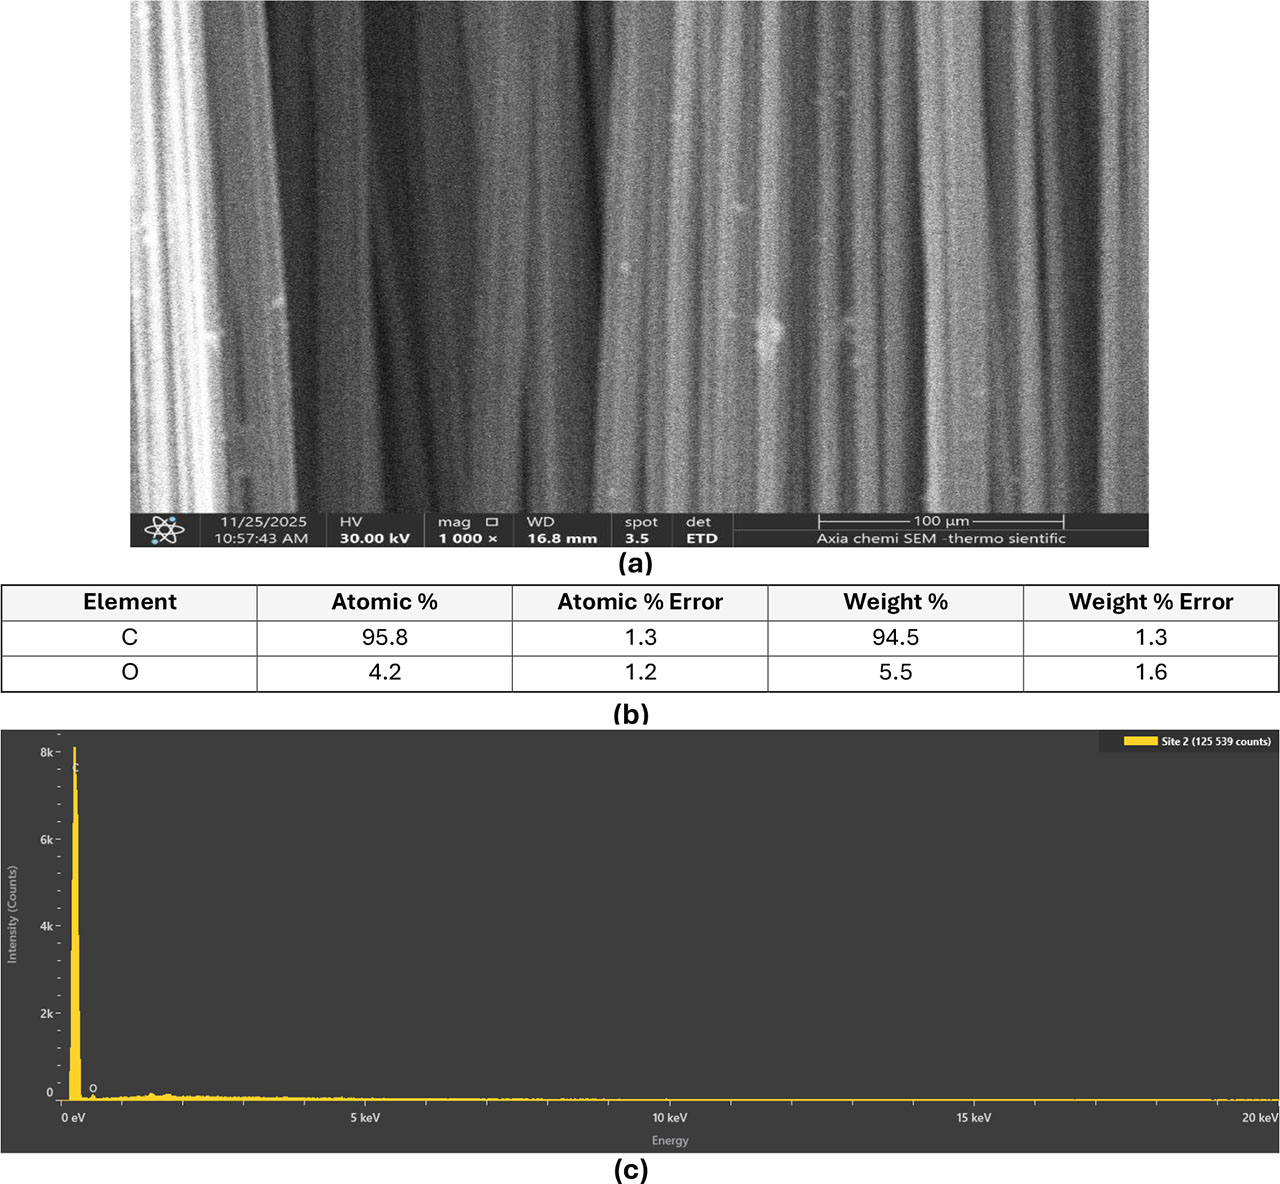
Figure 5:
EDS analysis of CFC: (a) SEM image [1000× magnification; 30 kV]. (b) Quantitative EDS analysis [weight percentage]. (c) Corresponding EDS spectrum
Table 1:
The chemical and physical characteristics of the raw ingredients [wt.%] utilized in the ECC matrix
| Oxide composition | OPC | FA | FSS | AC |
|---|---|---|---|---|
| CaO | 62.30 | 7.90 | 0.019 | 4.21 |
| SiO2 | 21.30 | 51.20 | 99.80 | 56.60 |
| Al2O3 | 3.77 | 17.03 | 0.061 | 25.30 |
| Fe2O3 | 4.69 | 6.65 | 0.022 | 4.64 |
| MgO | 3.71 | 2.23 | 0.01 | 0.78 |
| SO3 | 2.08 | 0.02 | - | 0.26 |
| Loss on ignition | 2.06 | 10.40 | 0.08 | 3.07 |
| Insoluble residue | 0.7 | - | - | - |
| Lime saturation factor | 0.93 | - | - | - |
| Physical properties | ||||
| Specific gravity | 3.11 | 2.13 | 2.60 | |
| Blaine fineness [cm2/g] | 3945 | 2689 | - | - |
Table 2:
Physical parameters of the AC used in ECC as supplied by the producer
| Raw material | Activated carbon with coconut |
|---|---|
| Mass density [g/cm3] | 0.42–0.55 |
| Ash content [%] | <10 |
| Hardness [%] | >92 |
| Moisture content, % | >5 |
| pH value | 9–11 |
| Iodine value [mg/g] | 900 |
| Surface area [cm2/g] | 1150 |
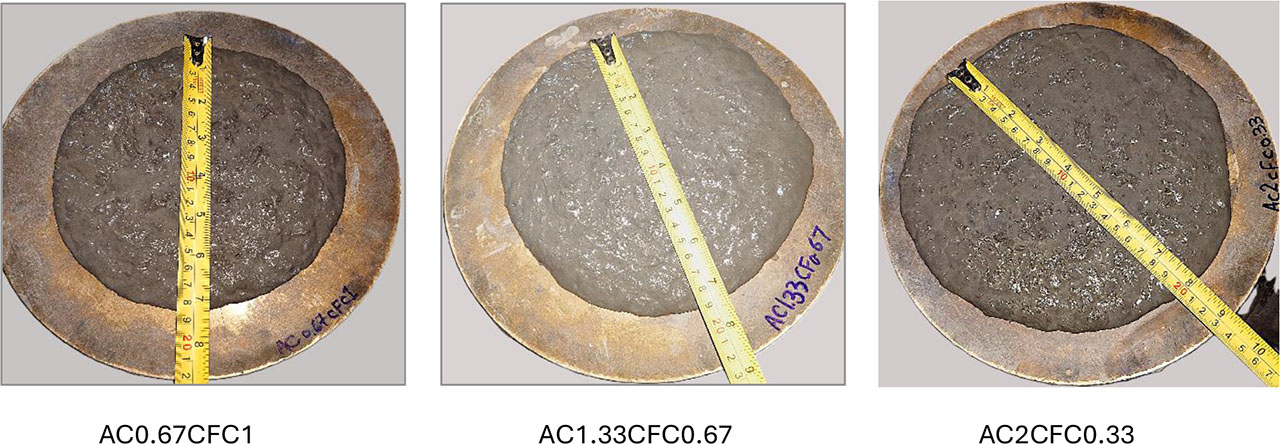
Figure 6:
The degrees of distortion in the matrices that were put through the mini-slump flow test
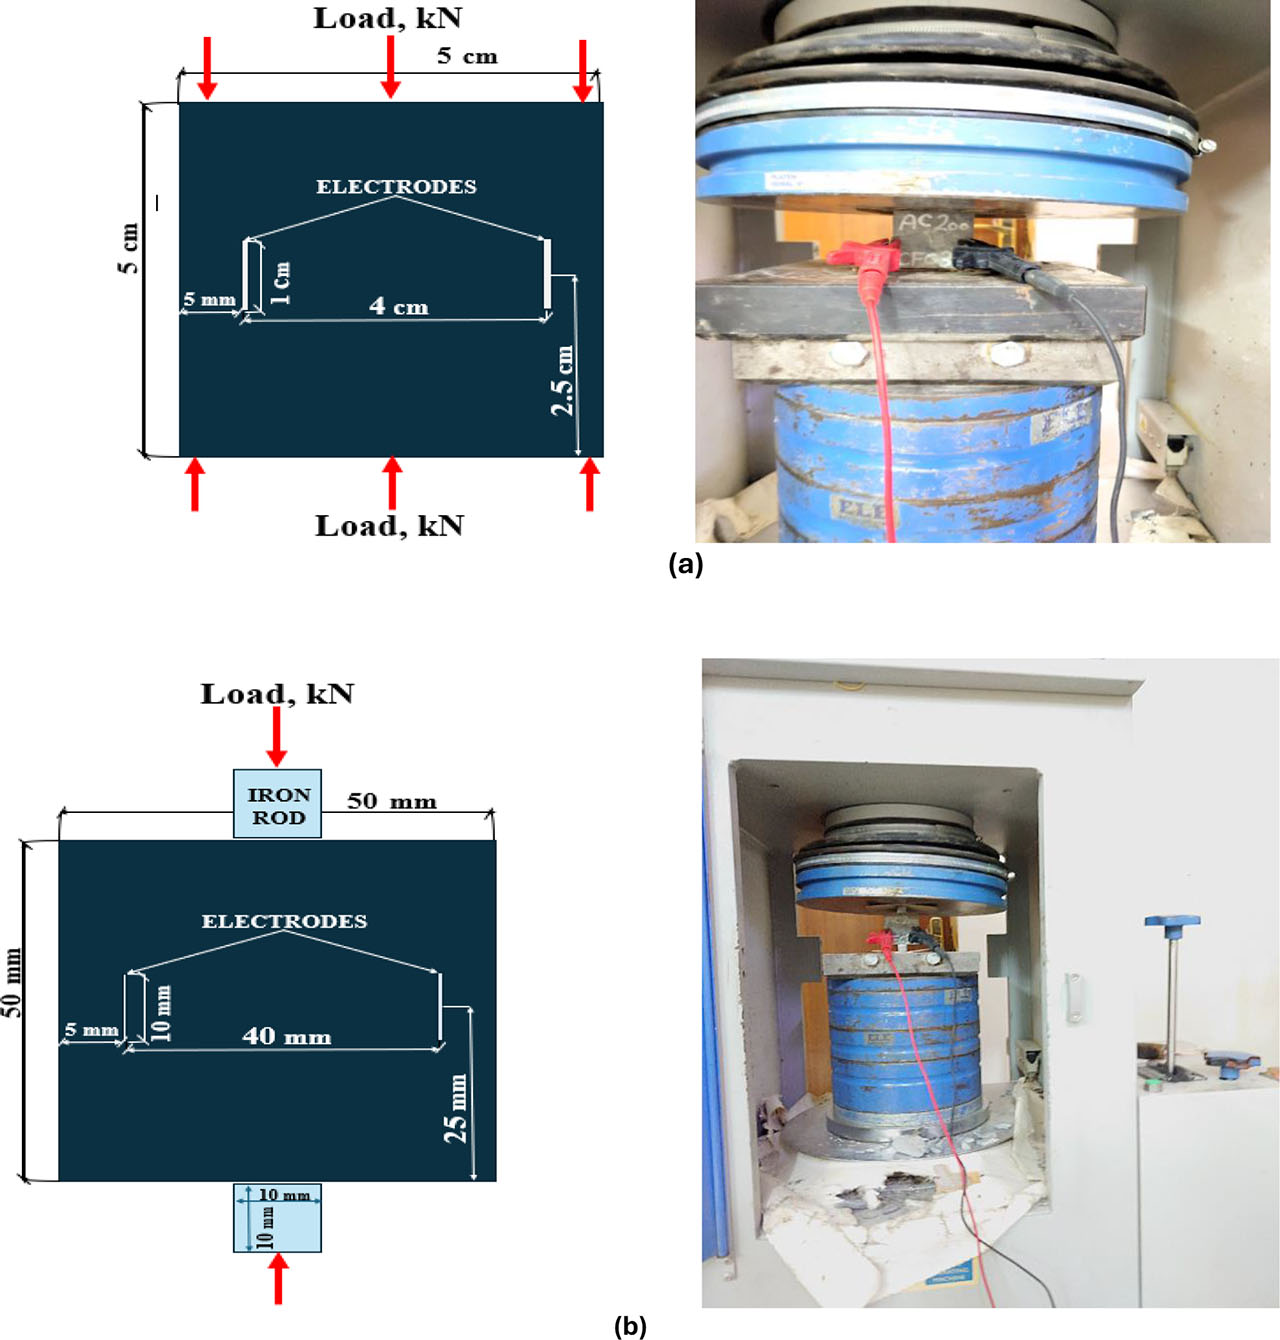
Figure 7:
Geometric design of specimens and mechanical and self-sensing setup: a) uniaxial compression; b) splitting tension
Table 4:
Summary of average values of mechanical and self-sensing performance metrics for all mixture designs
| No. | Mixture ID | Mechanical properties | Self-sensing properties | |||||
|---|---|---|---|---|---|---|---|---|
| Compression [MPa] | Splitting tension [MPa] | FCER [% under compression] | FCER [% under splitting tension] | FCER [% under cyclic compression loading] | ||||
| Parallel | Perpendicular | parallel | Perpendicular | |||||
| 1 | Control | 61 | 69 | 2.6 | 112.07 | −48.1 | 166.2 | - |
| 2 | AC0.67CFC1 | 84.2 | 67.7 | 7 | −14.88 | −89.27 | 33.68 | −273.4 |
| 3 | AC1.33CFC0.67 | 53.6 | 51.8 | 5.5 | −73.96 | −53.42 | 6.5 | −18.3 |
| 4 | AC2CFC0.33 | 78.4 | 80 | 4.3 | −35.11 | −70.92 | 14 | −20.8 |
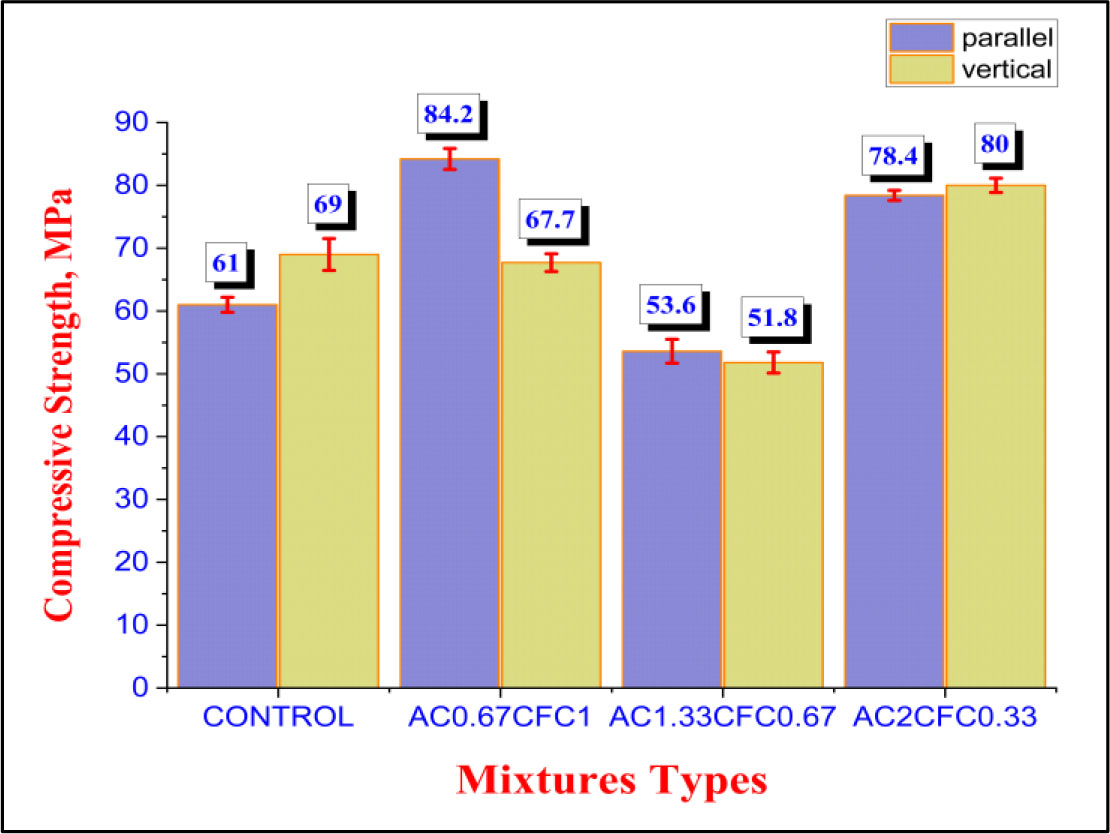
Figure 8:
Compressive strength results of both control and smart mixes at 28 days of age
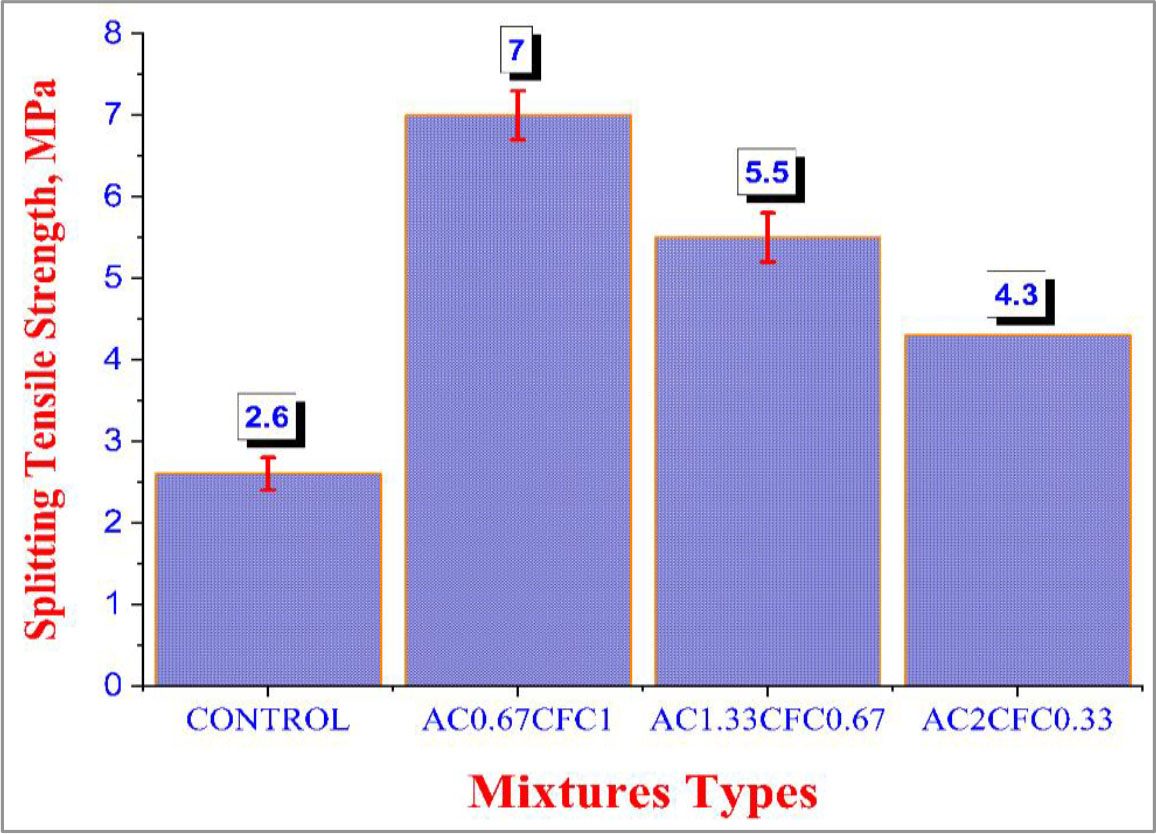
Figure 9:
Average splitting tensile strength results for hybrid matrices at 28 days
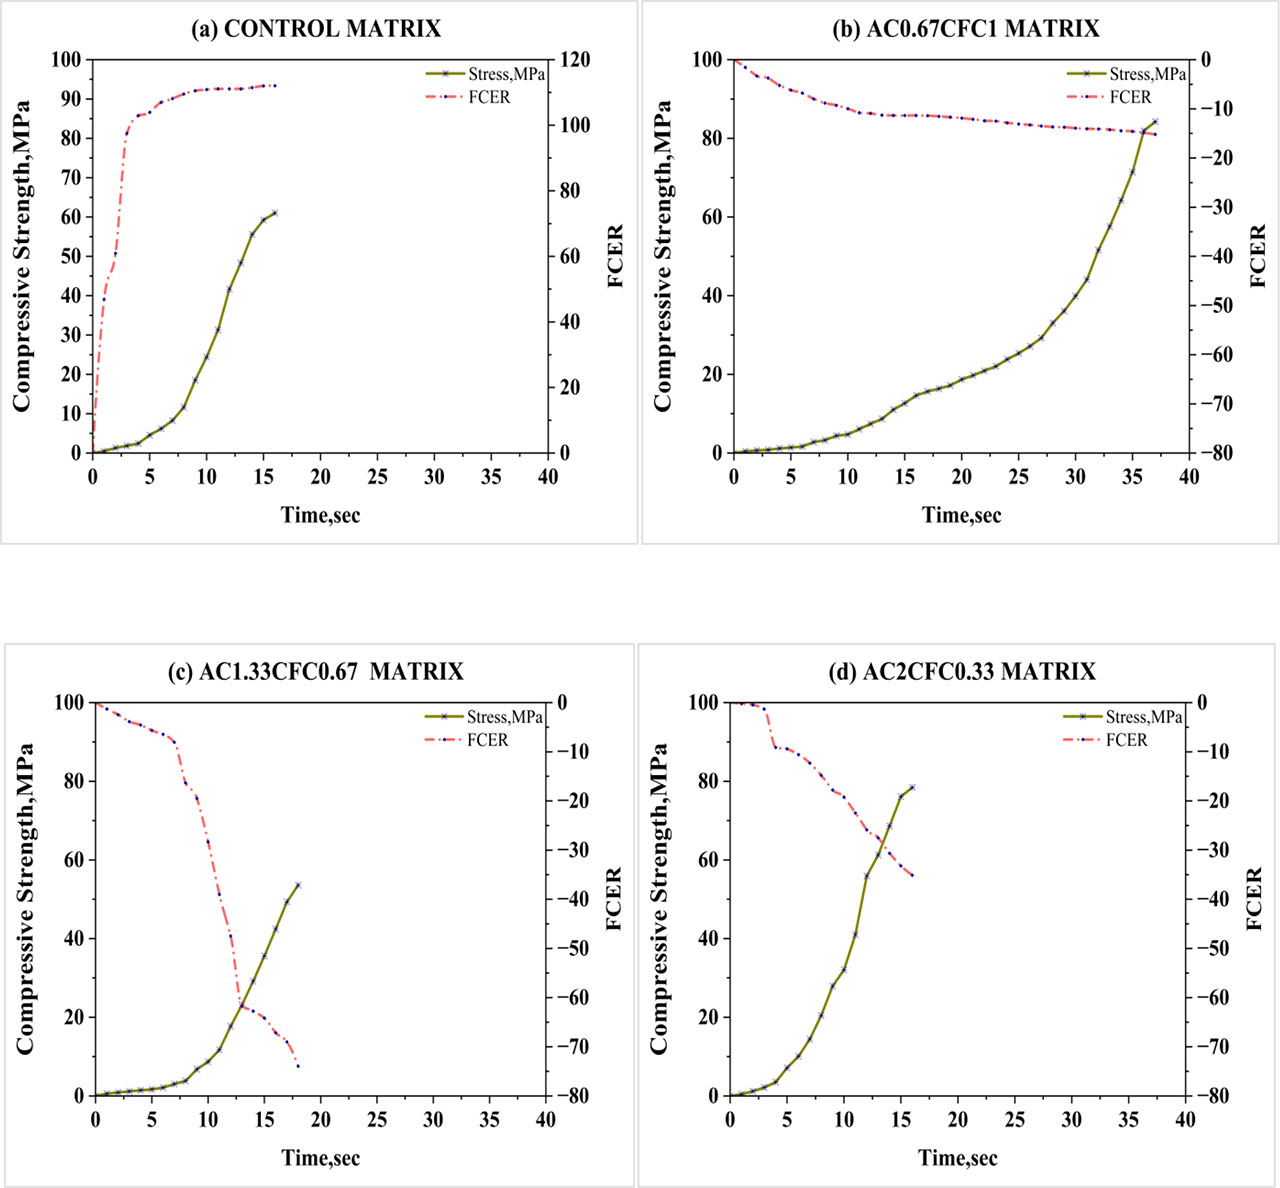
Figure 10:
Self-sensing response to monotonic compressive loads in parallel setup
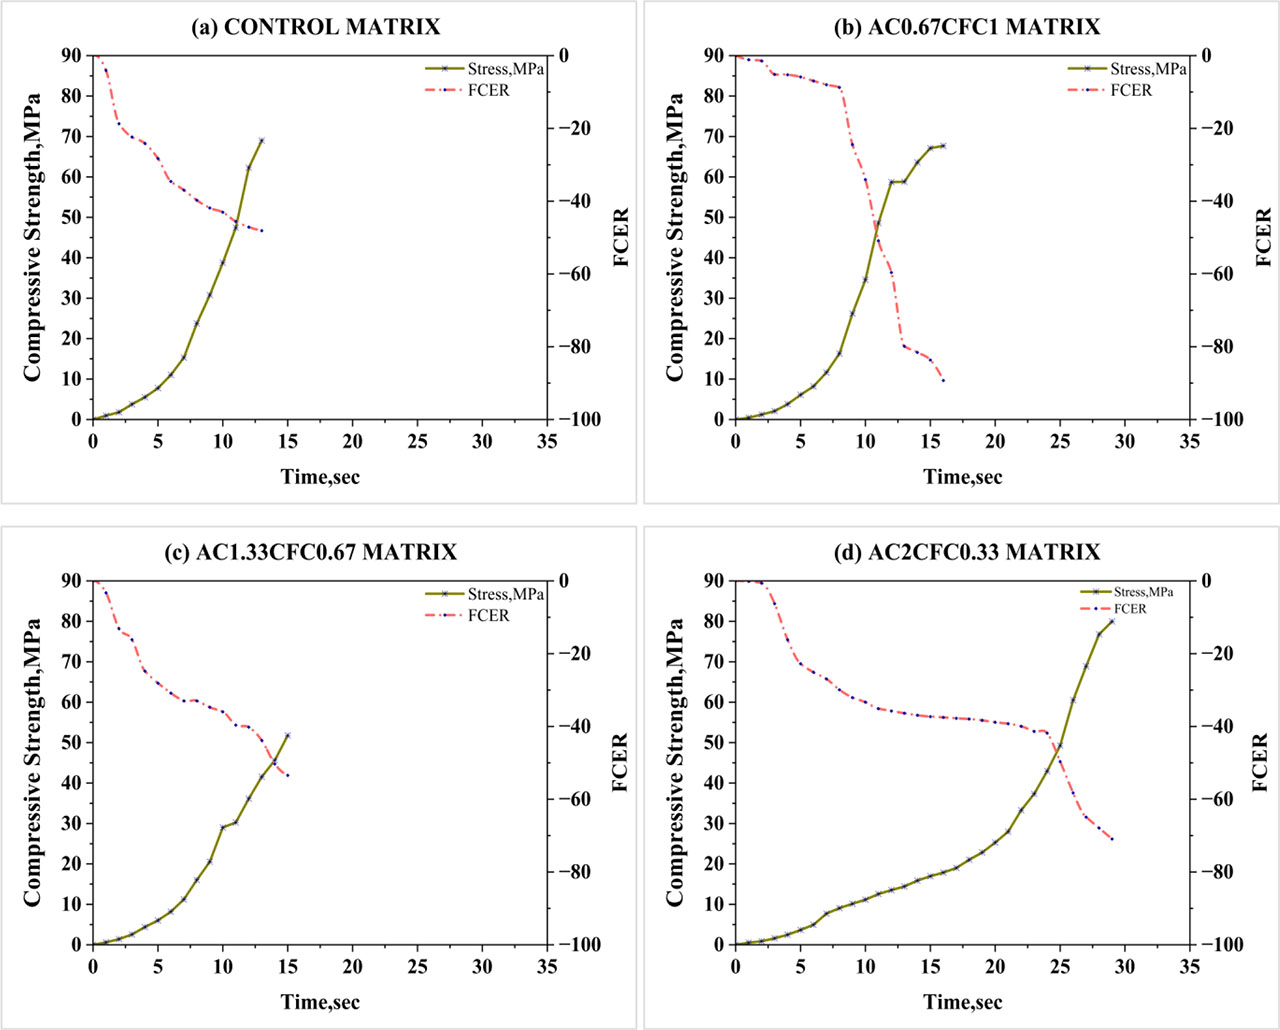
Figure 11:
Self-sensing response to monotonic compressive loads in vertical setup
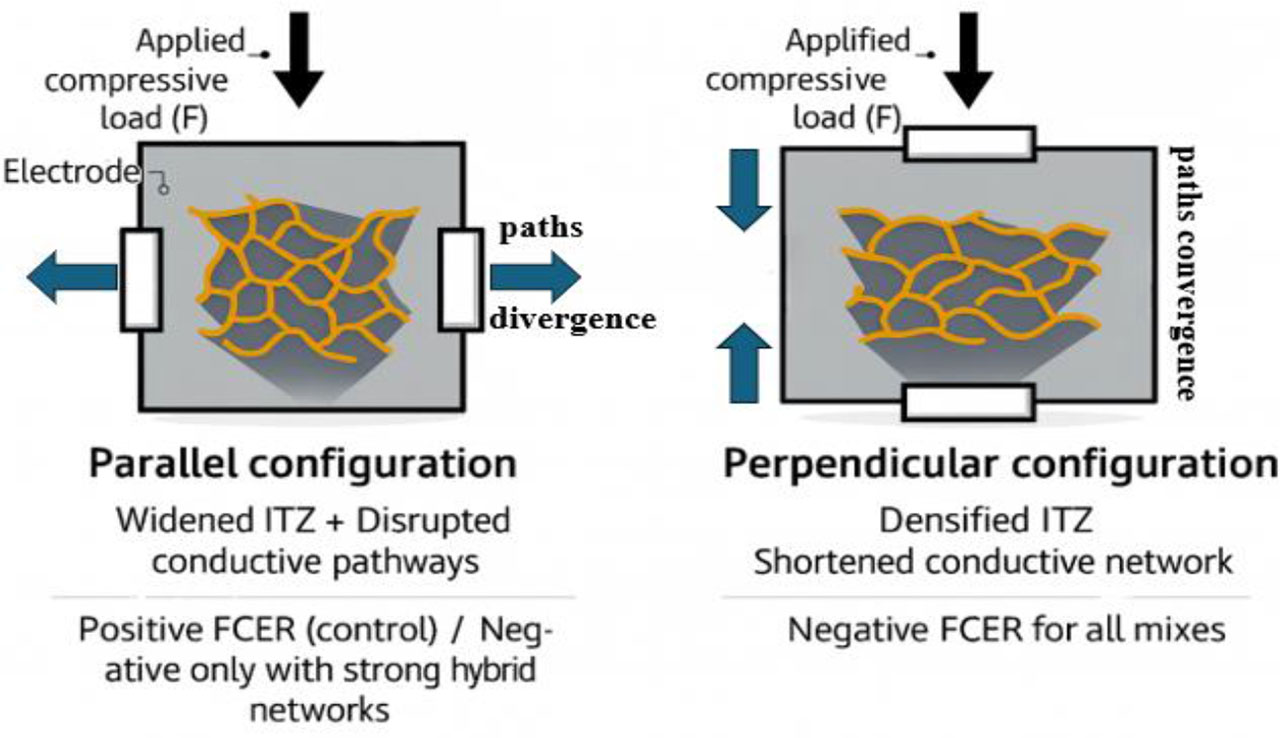
Figure 12:
The schematic representation illustrates the effect of electrode orientation – parallel versus perpendicular - under uniaxial compressive loading
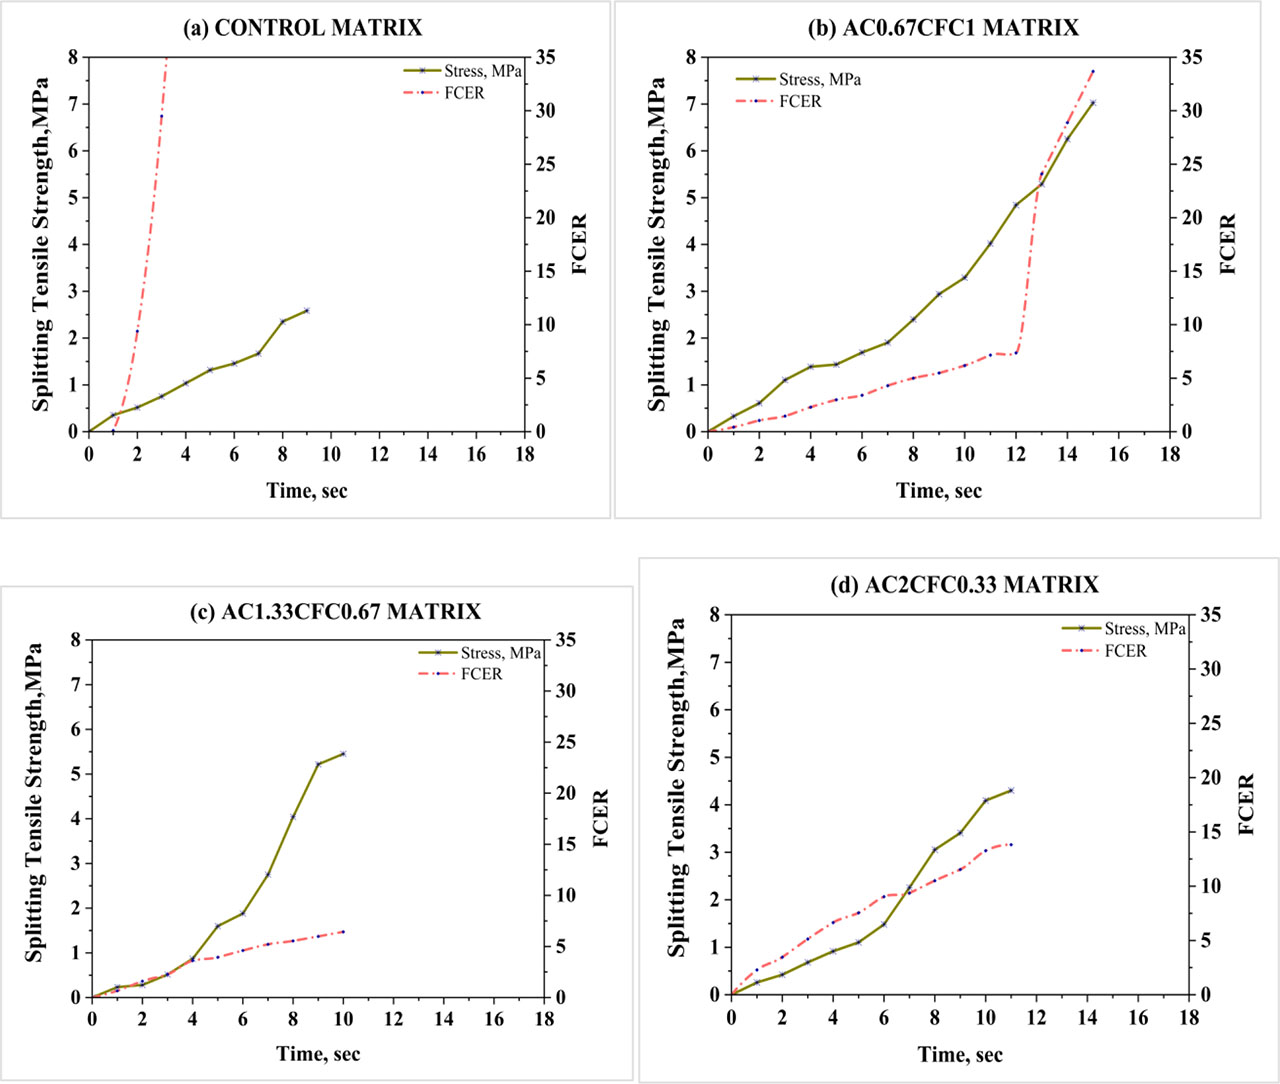
Figure 13:
Self-sensing response to splitting tensile loads
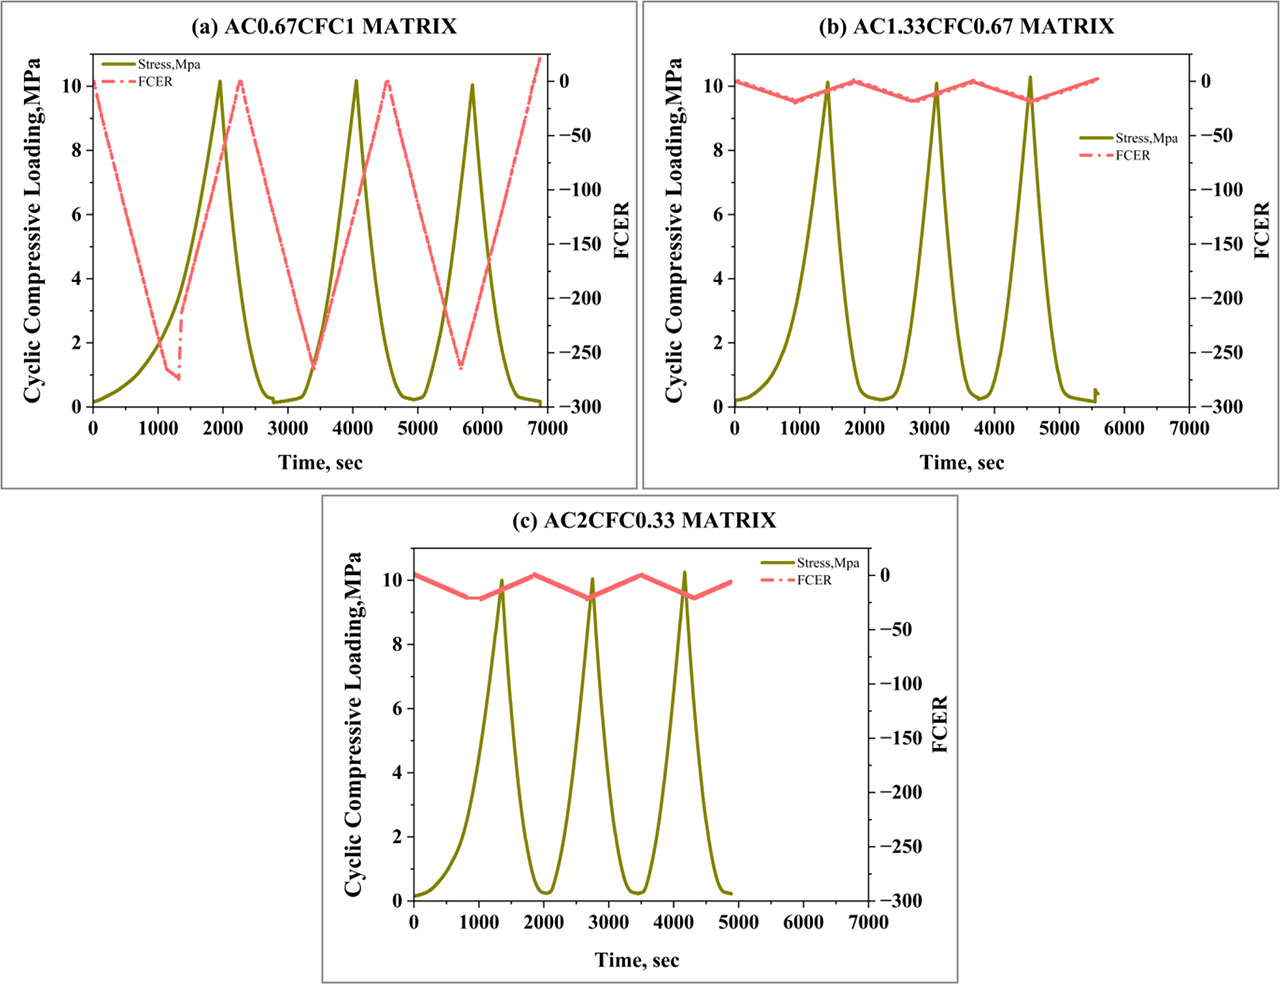
Figure 14:
The self-sensing ability of hybrid matrices under cyclic compression loading at 28 days