

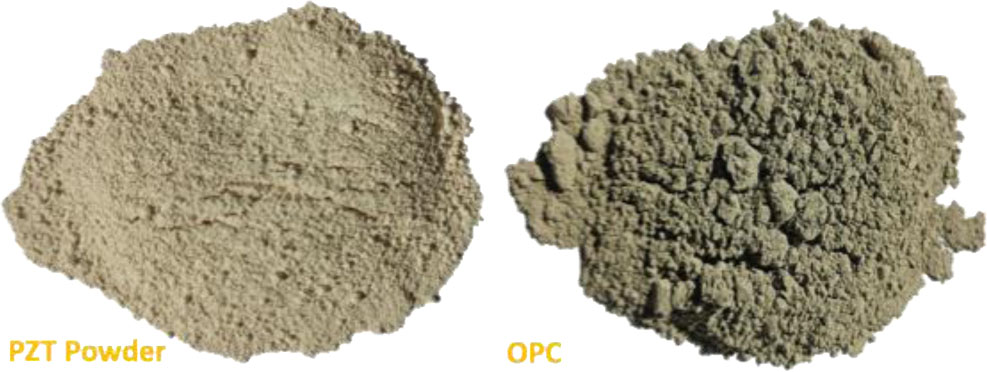
Figure 1:
Sensor raw material
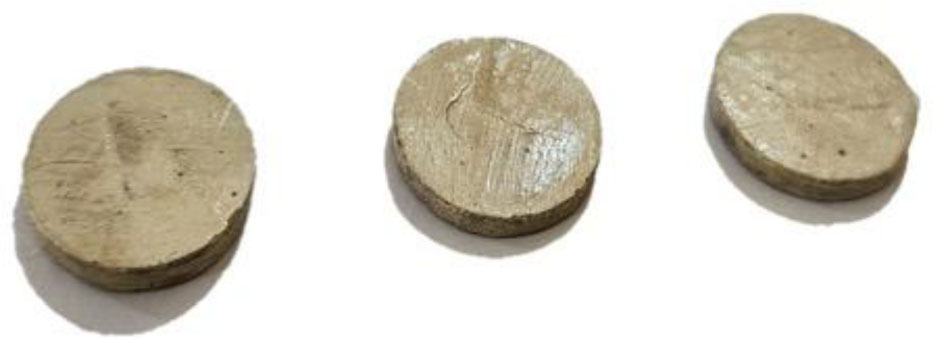
Figure 2:
The disk-like CPCs
Table 1:
Polling condition
| Codes | Electric Field [V/mm] | Duration [Minutes] | Temperature [°C] |
|---|---|---|---|
| C1 | 250 | 40 | 150 |
| C2 | 250 | 60 | 150 |
| C3 | 375 | 40 | 150 |
| C4 | 375 | 60 | 150 |
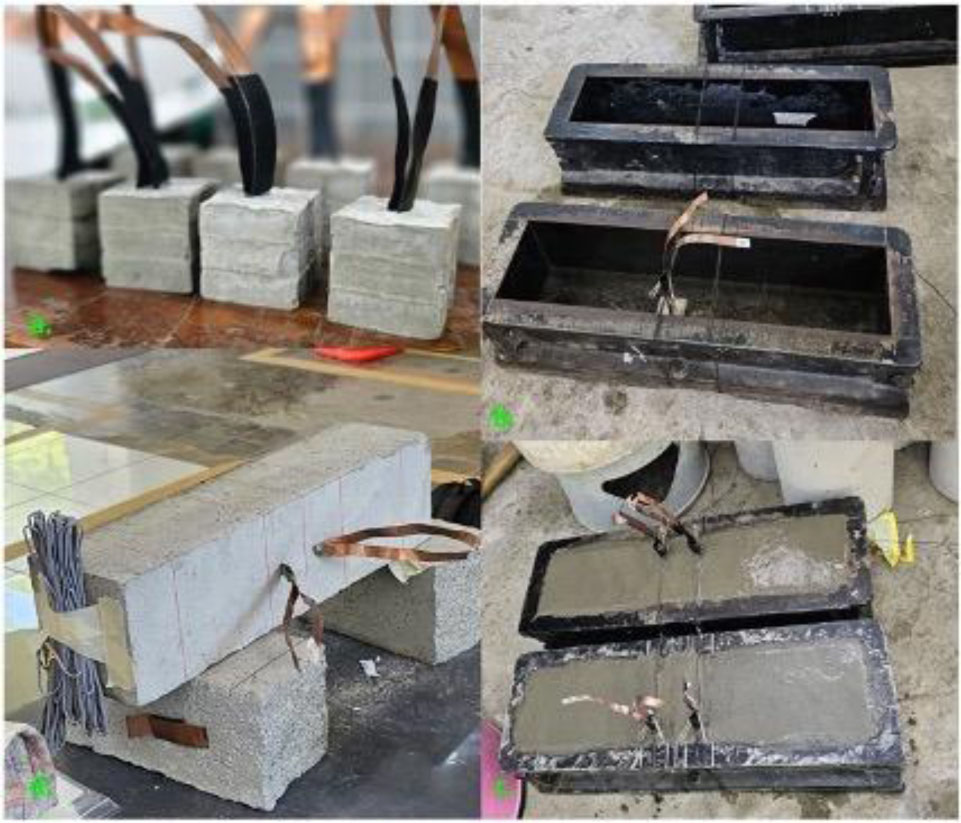
Figure 3:
Sensor and beam preparation
Table 2:
Load increments
| Max. Flexural Load | 1330 [kg] |
|---|---|
| Incremental Load | |
| 20% | 266 |
| 50% | 665 |
| 60% | 798 |
| 70% | 931 |
| 80% | 1064 |
| 90% | 1197 |
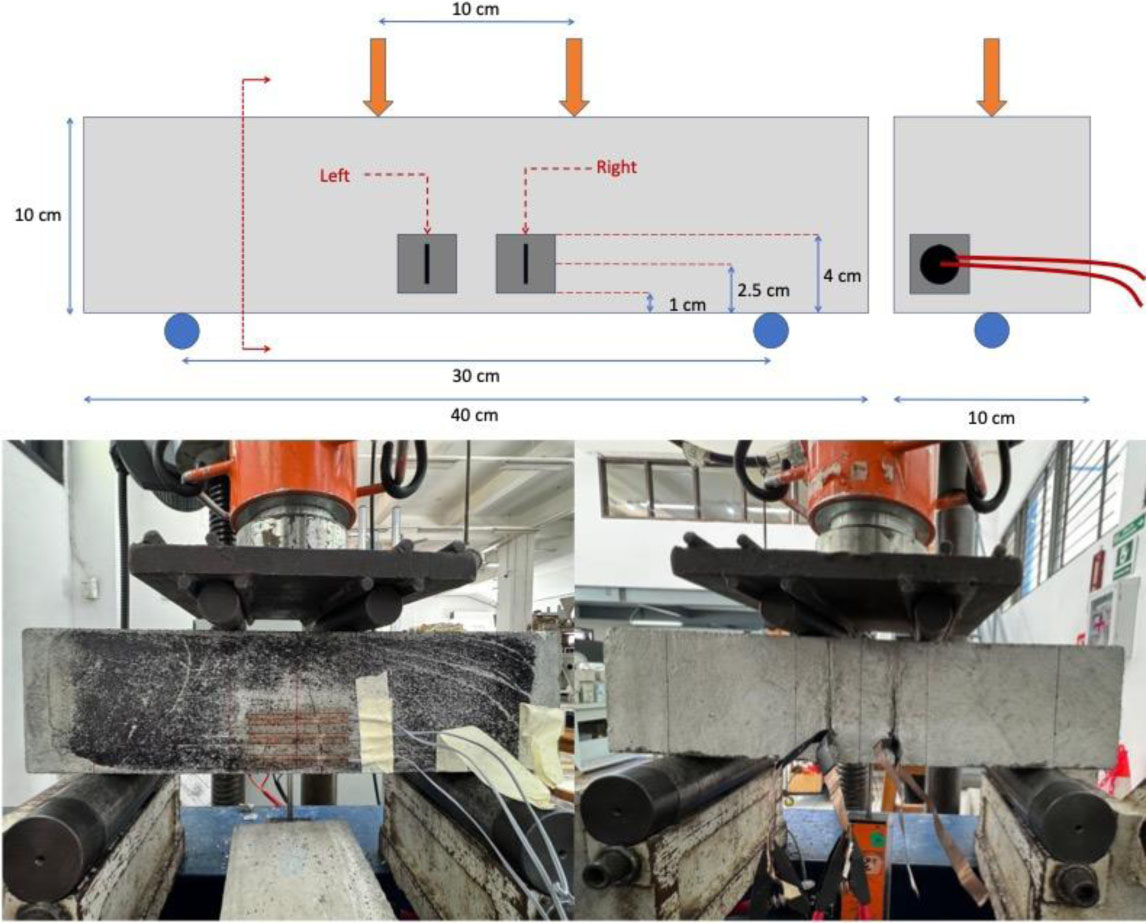
Figure 4:
Four-point bending test setup
Table 3:
The effective frequency range
| Variation | Effective Frequency Range [kHz] | Average Difference [%] |
|---|---|---|
| C1 | 610–650 | 85 |
| C2 | 430–730 | 21 |
| C3 | 660–720 | 40 |
| C4 | 510–770 | 8 |
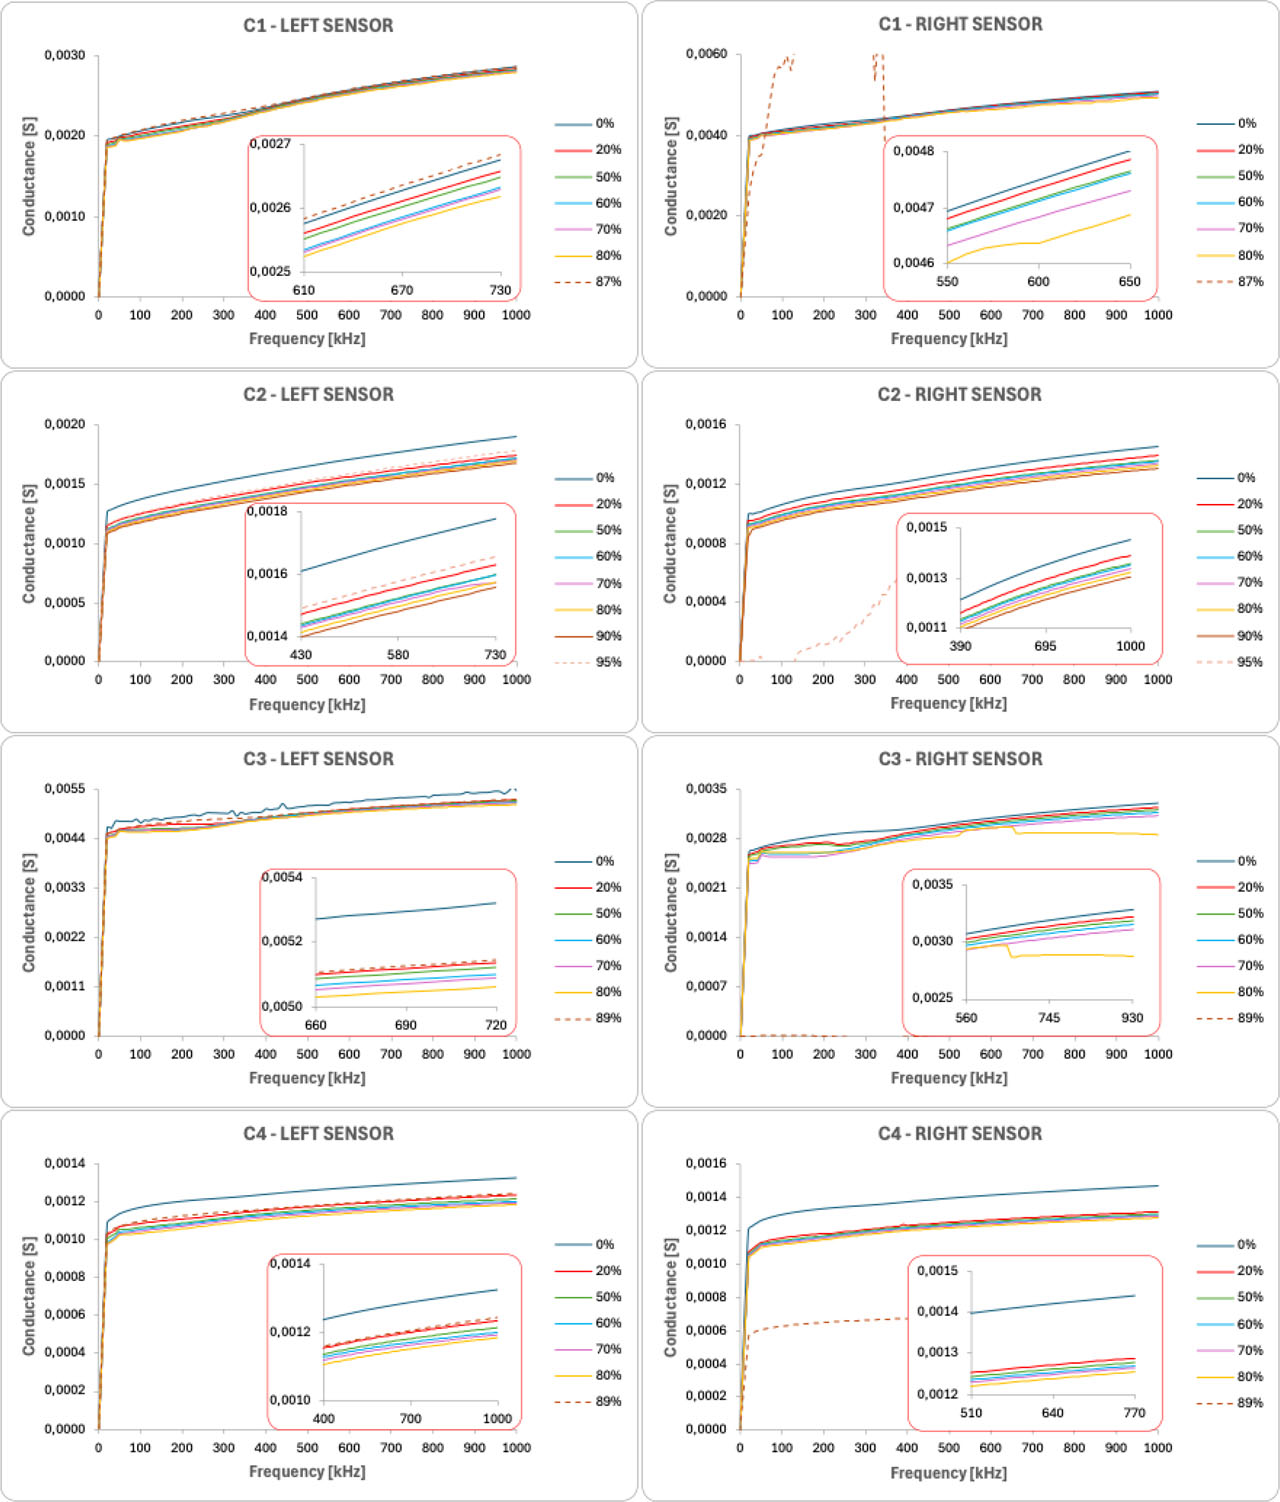
Figure 5:
Comparison of conductance response recorded from all tested beams
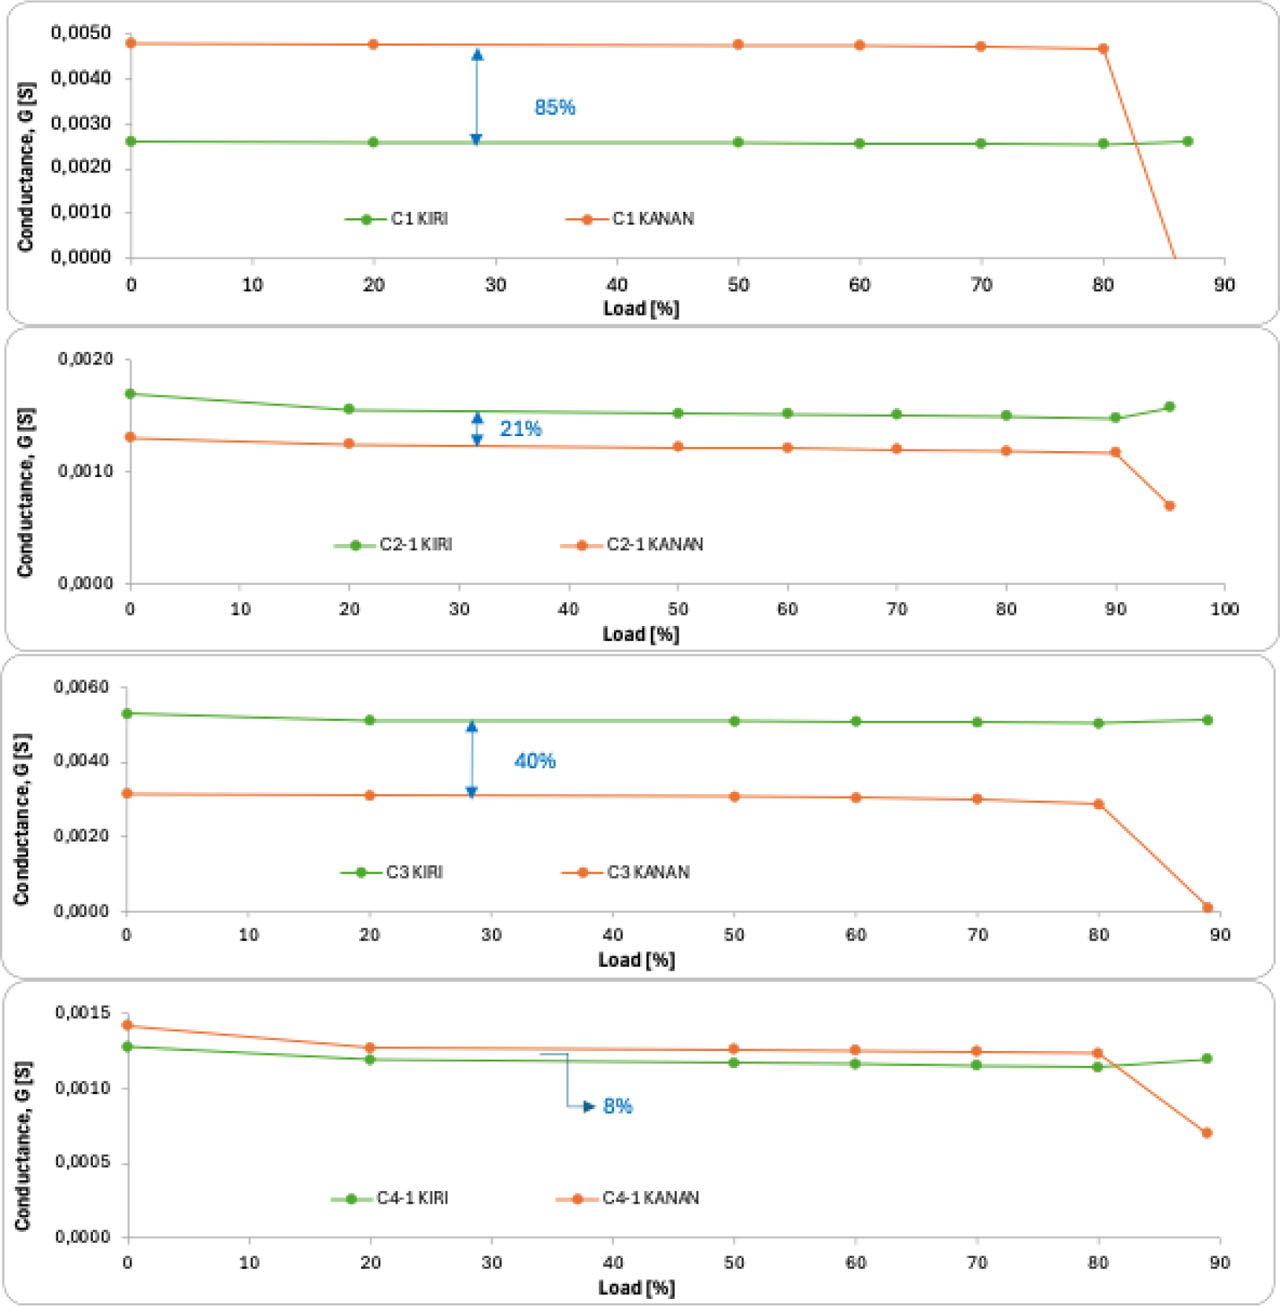
Figure 6:
Percentage difference in conductance between left and right sensors within the effective frequency range
Table 4:
The standard deviation of conductance
| Variation | Load Stages [%] | Standard Deviation (S) | |
|---|---|---|---|
| Left Sensor | Right Sensor | ||
| C1 (610–650 kHz) | 0 | 3.407 ×10⁻⁷ | 3.975 ×10⁻⁷ |
| 20 | 5.973 ×10⁻⁷ | 1.988 ×10⁻⁷ | |
| 50 | 7.721 ×10⁻⁷ | 3.715 ×10⁻⁷ | |
| 60 | 6.341 ×10⁻⁷ | 4.184 ×10⁻⁷ | |
| 70 | 6.596 ×10⁻⁷ | 3.385 ×10⁻⁷ | |
| 80 | 6.434 ×10⁻⁷ | 6.133 ×10⁻¹⁹ | |
| C2 (430–730 kHz) | 0 | 4.419 ×10⁻⁶ | 4.338 ×10⁻⁶ |
| 20 | 2.469 ×10⁻⁶ | 2.876 ×10⁻⁶ | |
| 50 | 2.758 ×10⁻⁶ | 2.247 ×10⁻⁶ | |
| 60 | 3.900 ×10⁻⁶ | 2.134 ×10⁻⁶ | |
| 70 | 3.916 ×10⁻⁶ | 1.951 ×10⁻⁶ | |
| 80 | 3.102 ×10⁻⁶ | 1.840 ×10⁻⁶ | |
| 90 | 2.638 ×10⁻⁶ | 1.819 ×10⁻⁶ | |
| C3 (660–720 kHz) | 0 | 1.069E-06 | 2.005 ×10⁻⁷ |
| 20 | 2.742 ×10⁻⁷ | 1.004 ×10⁻⁶ | |
| 50 | 4.681 ×10⁻⁷ | 1.074 ×10⁻⁶ | |
| 60 | 1.048 ×10⁻⁶ | 4.357 ×10⁻⁷ | |
| 70 | 2.374 ×10⁻⁷ | 2.736 ×10⁻⁷ | |
| 80 | 3.286 ×10⁻⁷ | 2.757 ×10⁻⁶ | |
| C4 (510–770 kHz) | 0 | 3.787 ×10⁻⁶ | 2.926 ×10⁻⁶ |
| 20 | 2.858 ×10⁻⁶ | 2.847 ×10⁻⁶ | |
| 50 | 2.569 ×10⁻⁶ | 2.630 ×10⁻⁶ | |
| 60 | 1.825 ×10⁻⁶ | 2.572 ×10⁻⁶ | |
| 70 | 2.040 ×10⁻⁶ | 2.839 ×10⁻⁶ | |
| 80 | 2.622 ×10⁻⁶ | 2.667 ×10⁻⁶ | |
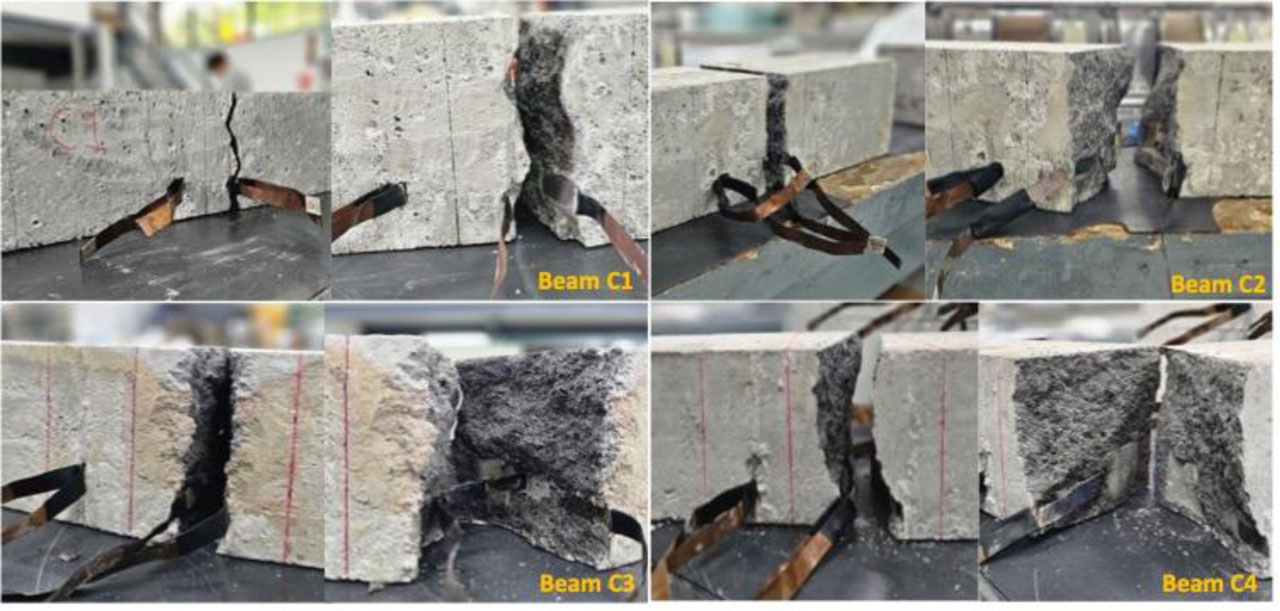
Figure 7:
Final damage condition of the tested beam after four-point bending failure