

Figure 1:

Figure 2:
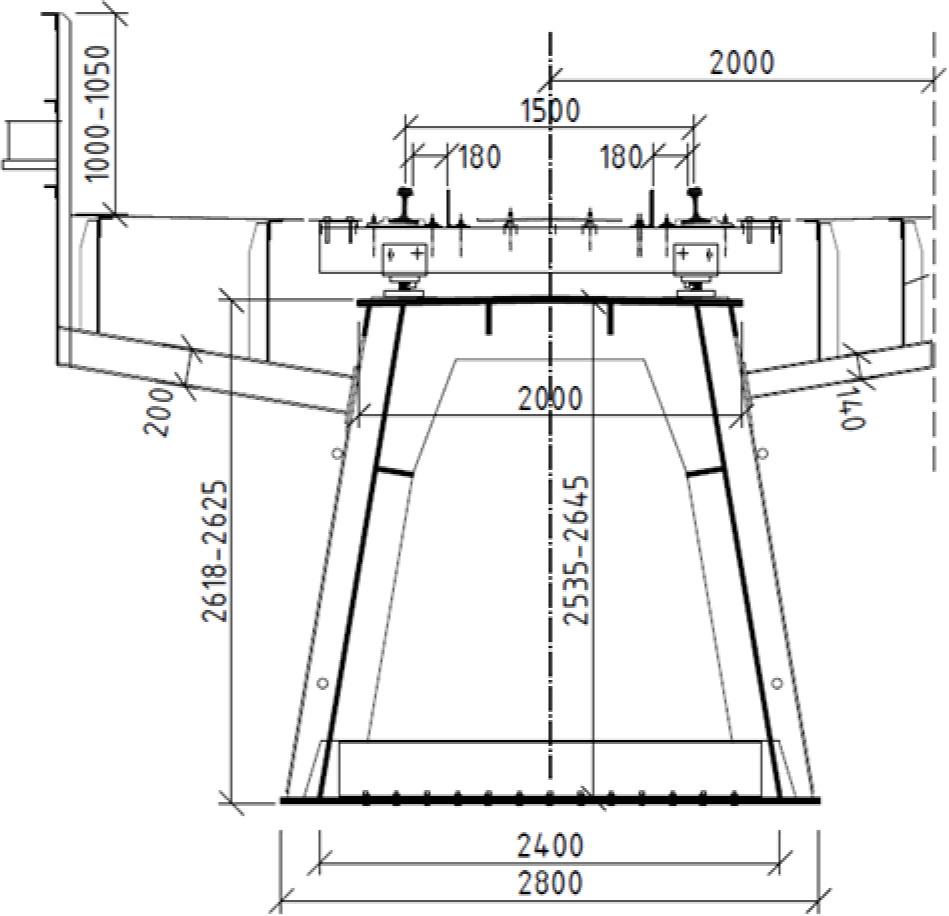
Figure 3:
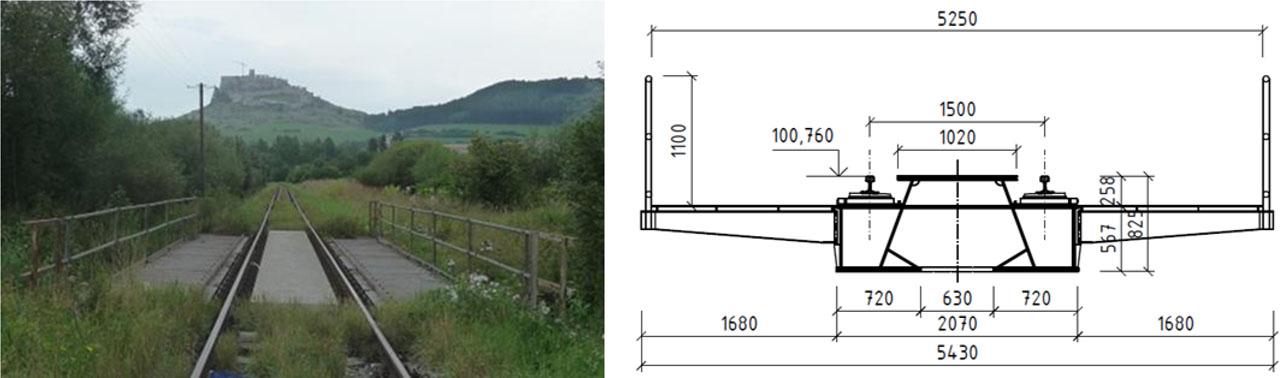
Figure 4:
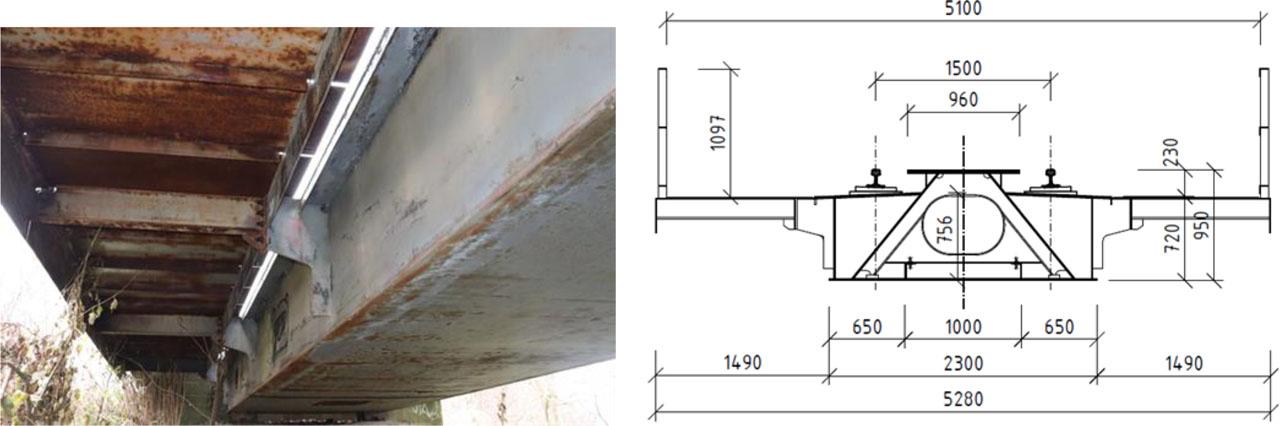
Figure 5:
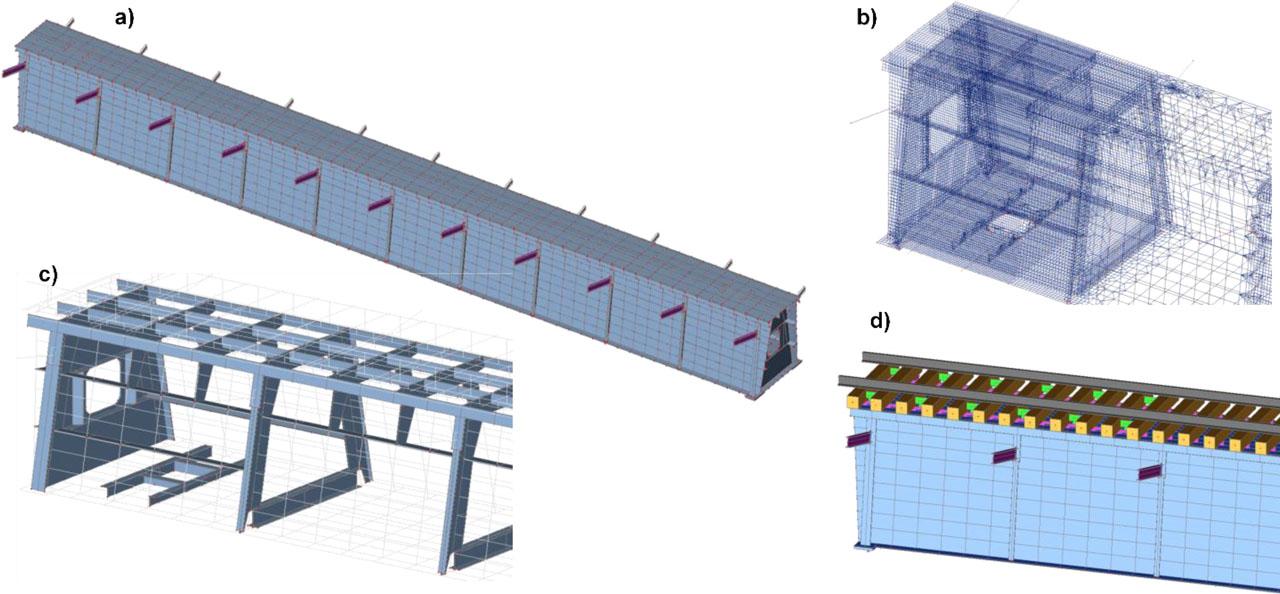
Figure 6:
Figure 7:
Figure 8:
Figure 9:
Figure 10:
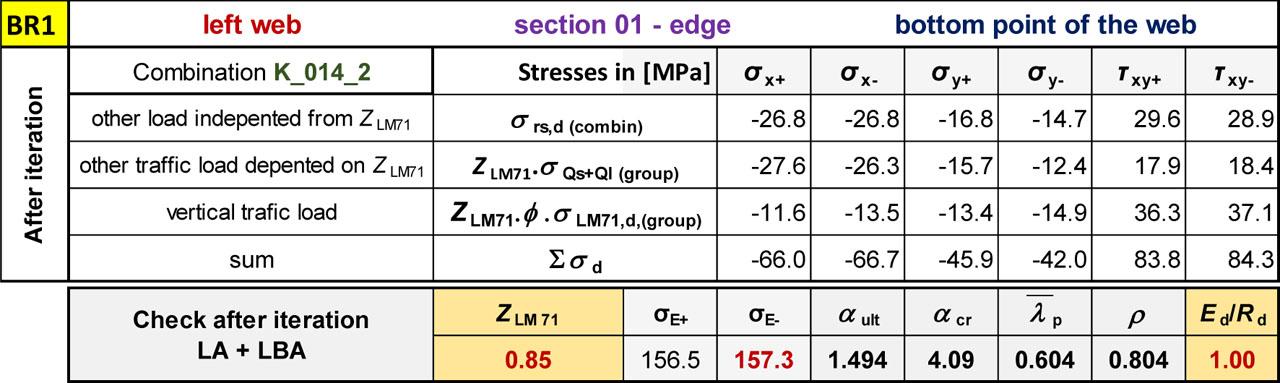
Overview of limiting load-carrying capacities for each analysed superstructure
| Bridge | Point / detail | Stress | ZLM71 | Note |
|---|---|---|---|---|
| BR1 | bottom point of the web | planar stress | 0.85 | resistance |
| weld of centric stirrup to top flange | normal stress range | 0.46 | fatigue | |
| BR2 | top flange near the web | planar stress | 1.02 | resistance |
| weld of diaphragm to main top flange | normal stress range | 0.69 | fatigue | |
| BR3 | bottom point of main web | planar stress | 1.02 | resistance |
| weld of diaphragm to main web | normal stress range | 1.25 | fatigue |