

The paper presents the seldom-utilized combination of Finite Element Analysis (FEA) using 2D elements for global analysis, a linear buckling analysis of such a model and verification of plate elements using the reduced stress method. The application of such a procedure seems complicated in practice, but it can lead to a more realistic description of behaviour of plate elements, as it considers the complex in-plane stress field. This combined procedure is advantageous to use in the re-calculations of existing bridges, when it is necessary to reach the limit of resistance and thereby determine the maximum actual load-carrying capacity, minimizing restrictions to traffic.
The reduced stress method (EN 1993-1-5, 2006) determines stress limits for stiffened and unstiffened plates under combined loading conditions. It offers an alternative to the traditional effective width method used for plated structural elements (Johansson, 2007; Samvin, 2016), however, in verifying the stress limitations no load shedding between plated elements of a cross section is accounted for. This phenomenon does not play a role when using plated elements in FEA model. A significant amount of research deals with application relationships useful for engineering practice, which allow verifying the resistance of elements composed predominantly of thin sheets by the reduced or direct stress method (Szabo, 2004; Schafer, 2008). The evaluated stresses thus depend mainly on the accuracy of the FEA model using 2D finite elements (setting, type of finite element, mesh, type of analysis, boundary conditions, modeling of stiffeners, connections, openings, etc.). Extensive research on how to use FEA using 2D elements (Sömjén, 2021) and verify the newly designed structure using the produced stresses were realized (Baguinho, 2022; Tawfeeq, 2021). The presented paper aims to point out a practical example of such a procedure when it is necessary to determine the load capacity and thus look for reserves in existing structural elements.
The paper discusses three railway bridges with superstructures formed by box girders, namely, a 14-span railway bridge on the main line (BR1), a bridge on a local line with temporary superstructure (BR2), and finally, a bridge with a box-girder superstructure on a siding line (BR3). The analyses presented below use knowledge from the modelling of plated finite element systems, including stability analyses. Afterwards, the load capacities were determined from the stress response using application of the practical code (EN 1993-1-5, 2006). The knowledge from many existing bridge analyses embodied in the directive (Slovak Railways, 2016) is also implemented into given results, while a differentiated level of reliability for the planned remaining lifetime was also applied (Koteš, 2012; Vičan, 2016).
The first analysed superstructure type is part of a railway bridge on one of the main double-track lines in Slovakia between stations Devínska Nová Ves – Štúrovo, Figure 1. This 14-span steel bridge spanning a local road, the Váh river with its floodplain, and a service road. The bridge consists of fourteen simple supported superstructures under each track. The subject of the evaluation was the superstructures under 2nd track, where an unconventional connection of ribbon track installed on sleepers was realised some decades before. For more details see the paper, where the effects of track-to-bridge interaction on this solution was a subject of experimental-numerical analysis (Odrobiňák, 2023).
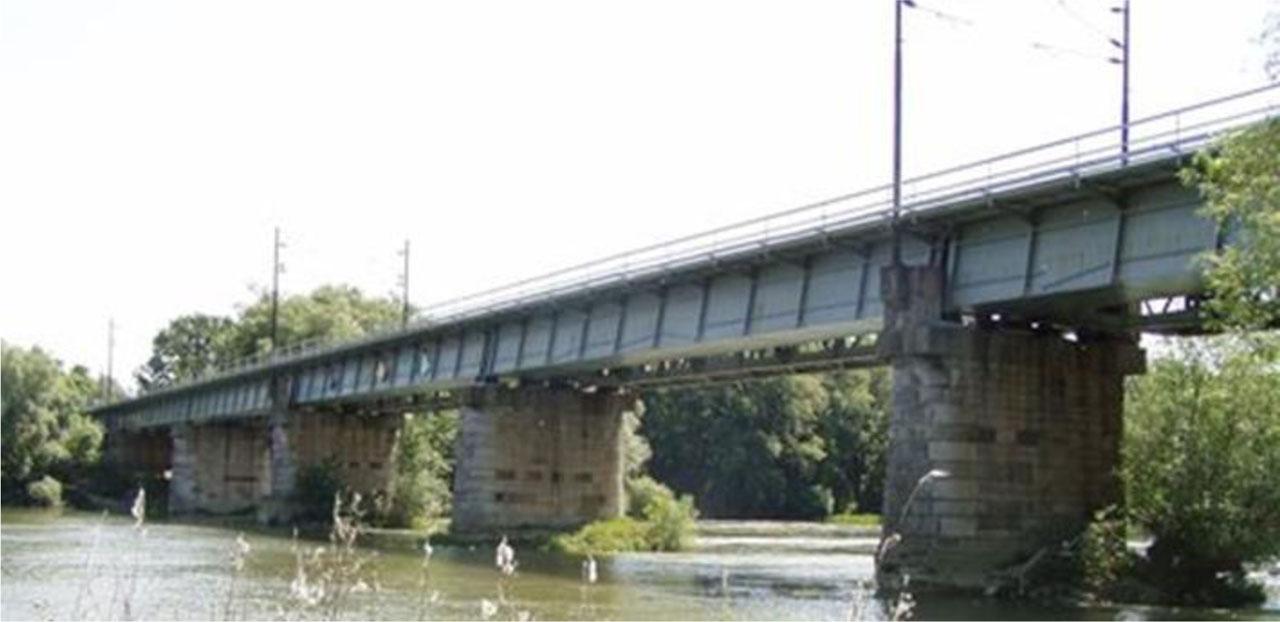
Bridge 1: a longitudinal view at the part of multi-span bridge
Specifically, the superstructures used in twelve spans (spans from no. 3 to no. 14) are made of steel welded box-girder. They were built in the early 1970s. The remaining two spans under track no. 2 (spans 1 and 2) consist of an older riveted truss girder bridge with an open member deck. The lengths of individual spans are 2 × 31.30 m + 6 × 31.20 m + 6 × 30.56 m. The total length of the bridge is 455.75 m. The geometric parameters of the box-girder used for all 12 relevant spans are shown in Figure 2. The superstructure with a span of 31.20 m (within the paper it will be designated as BR1) was subject of presented analysis.
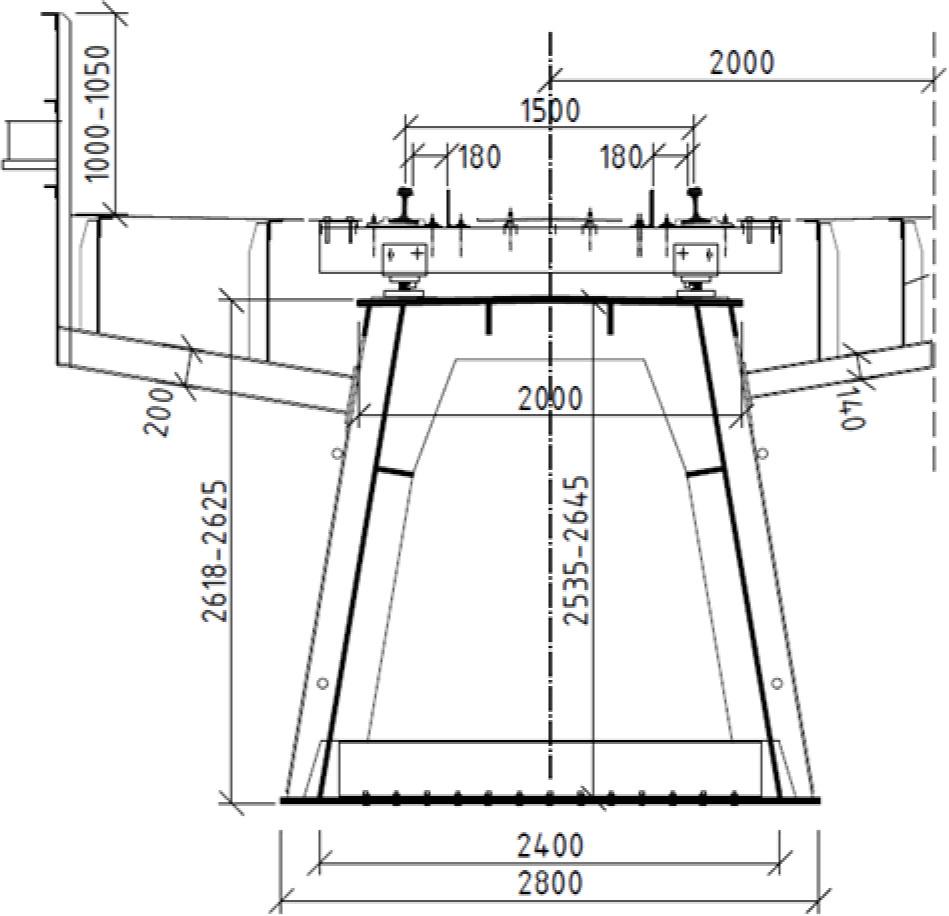
Bridge 1: cross section of the box-girder superstructure BR1
Top flange of the box-girder is made of plate 28×2000 mm in the midspan most stressed area, while near supports its thickness is reduced to 18 mm. Longitudinal stiffeners of the top flange are of section 14×160 mm. The bottom flange of the girder has dimensions 25×2800 mm, with the same reduction in thickness to 18 mm in ending parts. The inclined webs are of constant thickness 14 mm and are also stiffened by longitudinal stiffeners from 16×190 mm inside the box sections. In addition, the box cross-section is stiffened with transverse diaphragms at a distance of 3120 mm, so they divide the beam into ten fields. Moreover, half-diaphragms (‘trousers’) are used to stiffen the top flange and webs at distances 1040 mm. The average height of the girder is 2600 mm. The steel used for the superstructure was grade 11373, i.e. according to today’s design standards, the parameters close to steel grade S235 can be expected.
In 1985, the original bridge in poor condition on the local line between Spišské Vlachy and Spišské Podhradie was replaced by a temporary box girder bridge, which has remained there to this day, Figure 3 (left). It was necessary to verify whether it could continue serving as a permanent bridge, even after 40 years of exploitation.
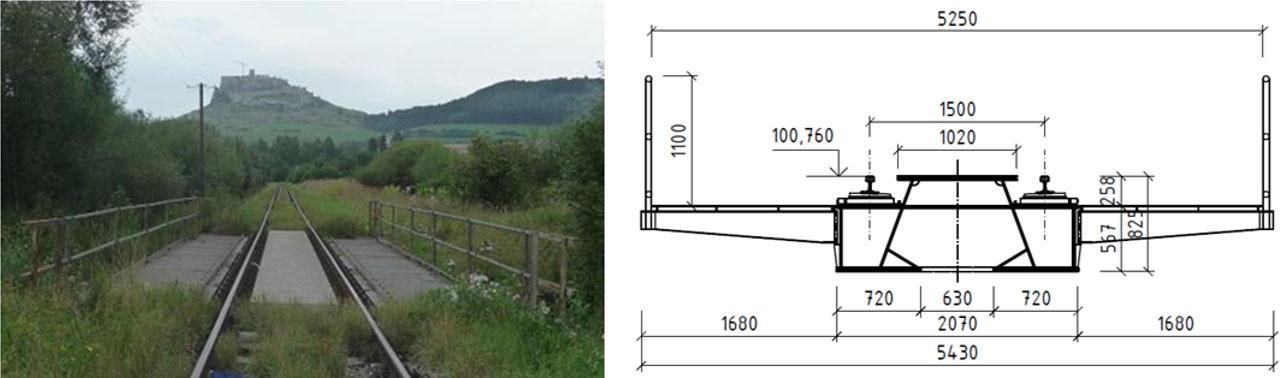
Bridge 2: a location on a local railway line (left); cross section of the box-girder superstructure BR2 (right)
The temporary bridge of type KNO 15, one of standardised Czechoslovak modular system production, has been installed (Hobst, 1999). The box-girder steel bridge with span 15.0 m consists of a main box girder with a direct support of the track on side boxes, Figure 3 (right). The trapezoidal-shaped main box has a structural height of 825 mm and consists of a top flange made of 30×1020 mm, a bottom flange made of 35×2070 mm and inclined webs 12 mm thick. To stiff the box-girder against distortion diaphragms of thickness 8 mm are welded in distances 3.0 m. The diaphragms are stiffened by horizontal stiffeners at the upper part and by bottom corner slanting stiffeners. The bottom flange has openings 630×2510 mm in each field between diaphragms. Side boxes are also equipped with diaphragms placed at every 600 mm, i.e. under each theoretical support for directly installed rail. The side box parts of bridge cross section serving for direct installation of the rails consist of top flanges created by 14×585 mm and vertical side webs of 12×543 mm, which are welded to the bottom flange of the main box. The bridge temporary bridge structure has folding sidewalk consoles attached using pin connections on the side boxes of main girder, which are rotated in the operating position and secured with cotter pins in a perpendicular position to the bridge axis at axial distances of 3.00 m. The temporary structure is made of S235 steel.
The bridge is located at railway siding adjacent to the railway line between Sereď and Križovany nad Dudváhom. It bridges by the span 15.60 m a small artificial watercourse. It is in service since 1991, when it replaced the very old original bridge structure during reconstruction work. The current superstructure is a built-up box-girder bridge. Considering the dimensions and sections of the plates used, the structure is very similar to the temporary bridge structure of type KN18 from Czechoslovak production (Hobst, 1999), although the span and the spacing of the diaphragms have been changed. It is probably a manufactured structure inspired by the mentioned temporary bridge. Similarly to Bridge 2, the cross-section of Bridge 3 is also formed by a main box-girder with side boxes with direct track support.
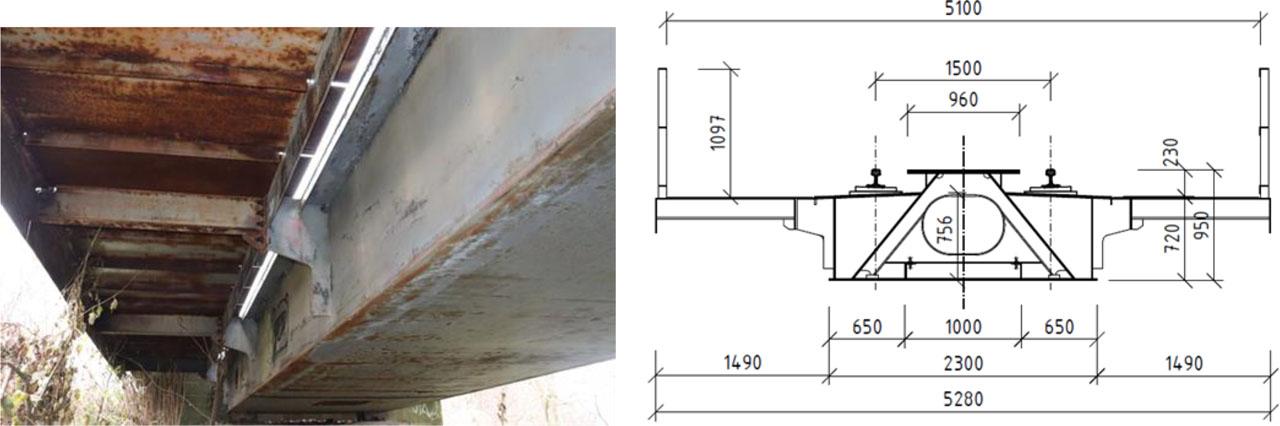
Bridge 3: a view of the bridge from below (left); cross section of the box-girder superstructure BR3 (right)
The main box has a trapezoidal shape with a constant height of 950 mm and consists of a top flange of 35×960 mm, a bottom flange of 20×2300 mm and inclined webs of 14×1150 mm. The clear width inside the main box-girder ranges from 1880 mm at the bottom to 420 mm at the top. The overhanging end of the top flanges is supported by short vertical stiffener. The bottom flange is stiffened with a pair of longitudinal stiffeners of L 90×130×9 mm at mutual distance of 1.00 m. The diaphragms of the main beam are at distances of 2.60 m. The intermediate diaphragms are made of plate 10 mm with a 500×700 mm oval openings. The main box-girder is accessible through the holes at end support diaphragms as well as through holes in the bottom flange near both supports.
The side boxes are on both sides of the main box as part of the main structural system and at the same time they carry rails directly installed on the upper flanges. The side box is formed from the bottom by the lower flange of the main chamber. The top slightly inclined flange of the side chamber is made of P20×900 mm, while the side webs from plate 10×685 mm close the box from the outside. Superstructure has sidewalk consoles mounted with bolted connections on the end plates of the vertical side stiffeners for connecting the consoles located at distances of 2.60 m.
For the global analysis, the computational models of all the above-mentioned bridge structures were created using 2D plate and wall or shell finite elements. All relevant parts, including outside and inside stiffeners, diaphragms and their stiffeners, opening endings, etc., were also approximated by 2D elements. The geometric shape, positions, thicknesses and material properties and other characteristics correspond to the production documentation, as well as their physical verification in-situ using diagnostics tools. Only consoles for service gangway were modelled by 1D element.
The models of the three analysed superstructures for FEA are illustrated in Figures 5 and 6. As already indicated, models using 2D elements were chosen intentionally. The first reason was to correctly capture the static behaviour of the box-girder structure. In particular, to obtain the actual response of the box-section structure to torsion, and to capture the real behaviour of the structure under non-uniform temperature through the cross-section depth and width, and for better redistribution of loads, especially due to wind action. The second reason for using 2D finite elements was the chosen procedure of the assessment and load-carrying capacity determination on the principles given in the design code, while all relevant assessments of the main load-carrying system were based directly on the stresses produced by this computational model. Thus, the mesh of finite elements was also subjected to evaluation, especially its setting and refinement in places critical for stress evaluation. The third reason was to point out the possible use of such a model in practical engineering tasks, such as determining the load-carrying capacity of bridges in operation, in this case railway bridges.
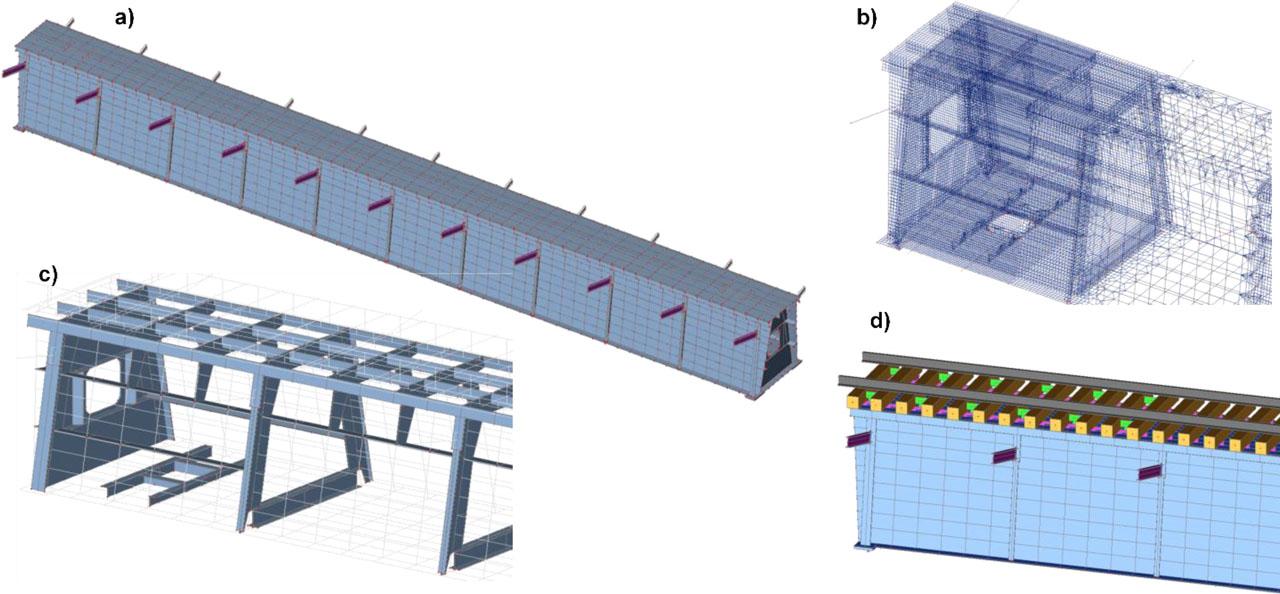
FEA model of BR1: a) superstructure model; b) detail of mesh in support area; c) separated modelled stiffeners and diaphragms; d) model of track together with model of superstructure
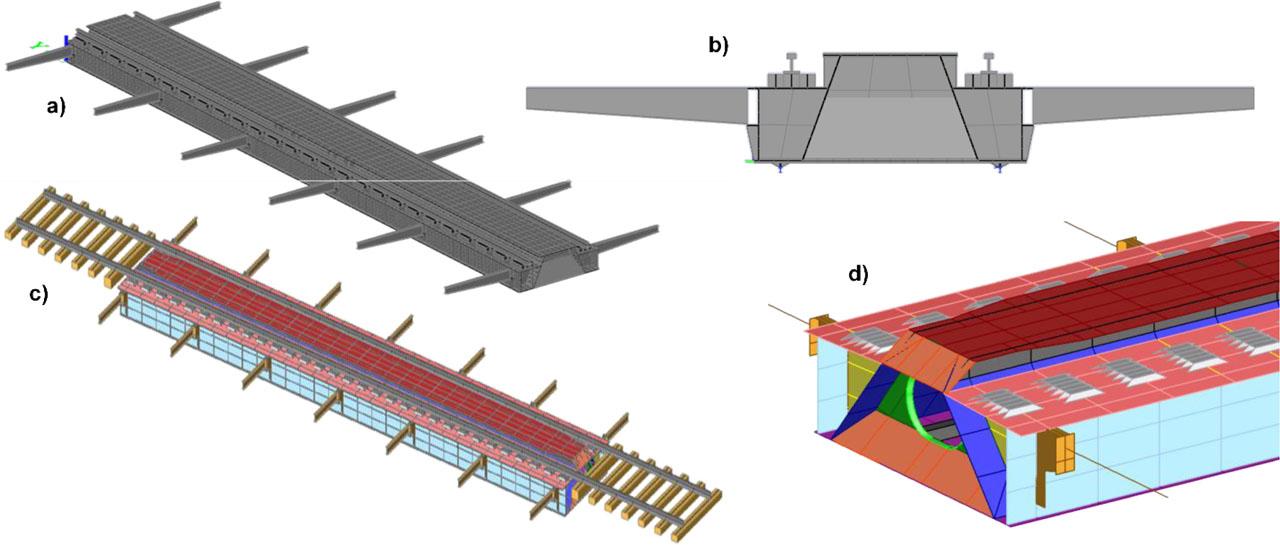
FEA model of BR2 (top) and BR3 (bottom): a) model of superstructure BR2; b) cross-section of FEA model BR2; c) model of superstructure BR3 together with model of track; d) detailed view on the model of superstructure BR3
Since the completely plated model were created, the supports could be modelled in their actual locations. Under the bottom flanges, at the bearing locations, two triangular, intersecting load-distributing plates were applied, with their apex located at the theoretical rotation point of the bearings. The upper bases of these triangular stiffeners, with thicknesses of 30–50 mm, corresponded to the dimensions of bearings of the bridge structure under consideration. The bearings themselves were then modelled only as nodal supports at this apex point, either fixed or movable, depending on the actual type of bearing used. In the horizontal directions, spring constants were assigned to the supports based on experience from dozens of real bridge behaviour measurements. For example, in the case of superstructure BR1, a stiffness of 200 MN/m was considered in the transverse direction of the bridge for both roller and fixed bearings, and a stiffness of 700 MN/m in the longitudinal direction for the fixed bearing. In the vertical direction, the bearings were considered perfectly rigid, which is a common assumption in static analysis. In dynamic analysis, it would also be appropriate to calibrate these stiffness values.
Finally, it should be added that all FEM models also included models of the track including sleepers, rails and mutual interconnection, and flexible connection of the track to the bridge superstructures and adjacent track sections as well.
The ribbon track is utilised only in the case of the bridge structure BR1. A detailed experimental-numerical analysis of its connection and the mutual track-bridge interaction was the subject of a published paper (Odrobiňák, 2023), where many details can be found. In the case of BR2 and BR3, the track and sleepers were modelled in front of and behind the bridge only up to the rail expansion joints, which were always located within 2 meters from the expansion joints of a bridge. The interconnections between the rail and the bridge were modelled again through auxiliary distribution plated elements that approximate the “direct” connection of the tract to the bridge, including its support and gauge plates.
The interconnection between the elements approximating each considered track system and the track with the supporting structure was modelled using substitute beam/link elements, the stiffness of which was derived from the stiffness of the connected part (for example: rail to rail supporting elements, rail to bridge sleepers, bridge sleepers to the superstructure, sleeper to ballast bed, etc.). At the ends/beginnings of these substitute beams, semi-rigid hinges were modelled with values of rotational and translational stiffness determined based on long-term experience of the authors (for example, for longitudinal displacement/sliding of the rail, the connection taking into account elastic clips and given spacing of rail supports was considered with stiffness Kx = 5 MN/m, etc.) and from the measurements of real behaviour of the track bad (Ižvolt, 2023).
Within the framework of the linear global analysis (LA), all relevant loads acting on the superstructures of bridges were taken into account from the point of view of determining their load-carrying capacities, i.e. permanent loads and variable loads, specifically vertical traffic action due to Load Model 71, nosing forces, acceleration and braking, side service gangways, wind loads, as well as uniform and in both directions non-uniform temperature load components. The values of loads respect design codes but with recommendations of the bridge administrator (Slovak Railways, 2016). For each load, the stress response of the superstructures was evaluated.
The design load actions were determined for a planned remaining lifetime of 50 years for all three bridges. The reliability index was set to β = 3.465 (Koteš, 2012), which was reflected in the values of the following partial load factors (Vičan, 2016):
- ○
γG = 1.20 for elements with verified geometric parameters,
- ○
γG = 1.30 for elements with unverified parameters,
- ○
γQ, traffic = 1.30 for variable traffic load,
- ○
γQ, climate = 1.40 for wind and temperature actions.
Partial resistance factors were also chosen according to guideline (Slovak Railways, 2016), based on both expected quality of steel in the year of bridge production and remaining lifetime. Combinations of load were led by formula 6.10 valid for Slovakia (EN 1990, 2002), while respecting load groups (EN 1991-2, 2003).
Each superstructure model was subsequently divided into assessed “parts”, which were understood as plates in the further process. An example is given in Figure 7, where this division is presented in the case of BR3. For the assessment and consequent load-carrying capacity determination discussed below, it was necessary to select the stress state in carefully chosen sections of plates or local fields. Some examples are in the Figure 8.
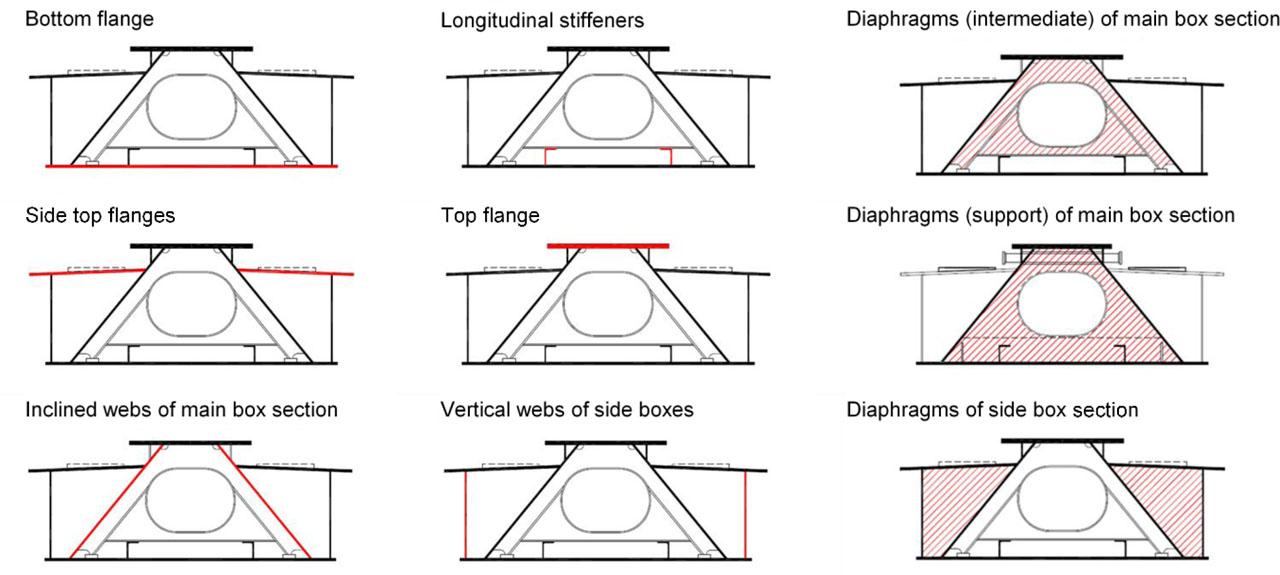
Example of dividing the cross-section of superstructure BR3 into relevant parts valid for the assessment
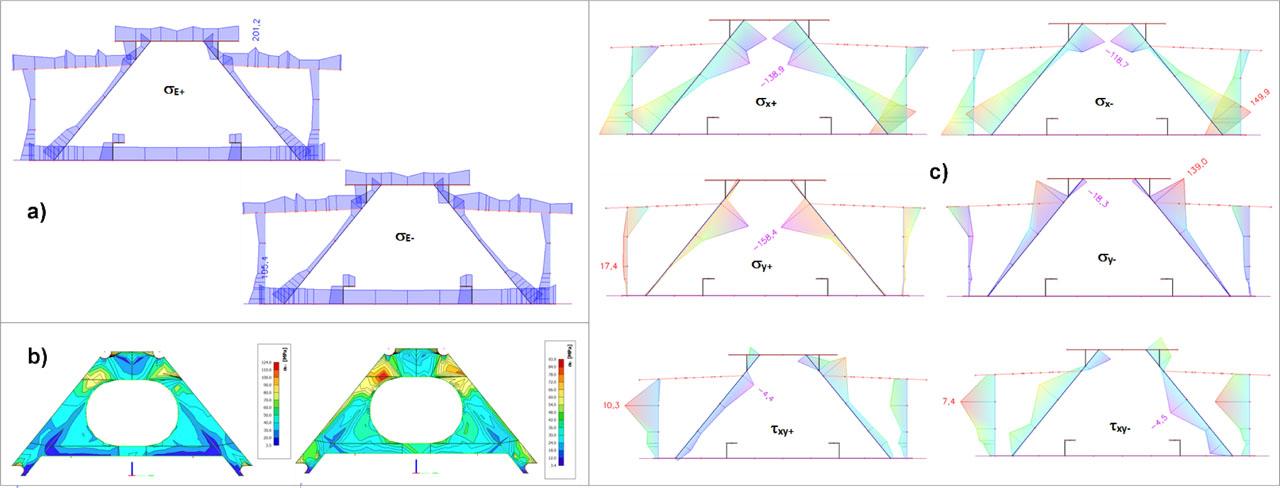
Example of extracting stresses in any section or in any plate (results in the case of superstructure BR3): a) equivalent main stresses in section; b) isopalette of equivalent stresses; c) section results in the form of stress components
For the sake of completeness, it should be noted that the stresses from LA do not represent sought quantity, since their comparison with the limit value (the yield strength) is not sufficient in this case. Actually, the main goal of evaluating an existing bridge is to determine load-carrying capacity. In the case of railway bridges, it is given as a dimensionless multiplier ZLM71 of actions produced by Load Model 71, after multiplication by which the limit state is reached at any point of the subjected structural element, part or detail (Slovak Railways, 2016). Therefore, the task of finding the actual load-carrying capacity in the form of ZLM71 under complicated state of stress often leads to an iterative procedure.
The effects of buckling of individual plate parts of box-girder superstructures were considered by linear buckling analysis (LBA) of the same models utilised 2D finite elements. Firstly, for individual modes of stability losses (elastic critical buckling shapes) of each plate under stresses produced by decisive combinations, a critical multipliers αcr were determined, while with load capacity ZLM71 = 1.0 was adopted. An example of some critical buckling modes of analysed cross-section parts is given in Figure 9.
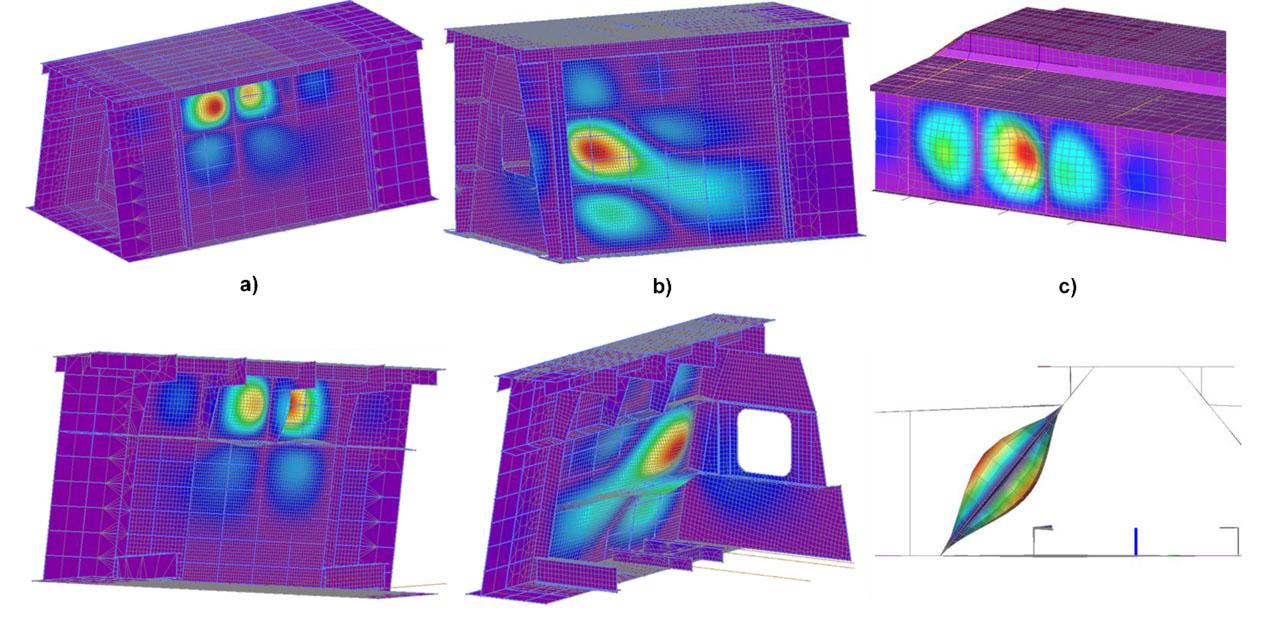
Example of calculated buckling shapes for the webs under relevant load combinations: a) BR1, web at midspan area, αcr = 4.12; b) BR1, web at the area near support, αcr = 4.62; c) BR3, vertical web of side box at the area near support, αcr = 5.86; (at the top: views from outside the structure; at the bottom: views from inside the cross-section)
Later, within the process of finding the resulting load-carrying, the αcr had to be iteratively modified for the changing value of ZLM71.
The “critical multiplier” αcr is a load factor that quantifies the load at which a structure or its parts will become unstable and buckle. It is determined by solving an eigenvalue problem based on the structural properties and boundary conditions, which yields the critical load. Especially, in the case of a model using 2D elements for plates, the results of linear buckling analysis are correctly affected by the actual stiffness of stiffeners and details and the stiffness distribution around the plate, which tends to buckle.
The load-carrying values for the ULS (except for fatigue) were determined by an iterative procedure.
Within the procedure for determining the load-carrying capacity, the reduced stress method was applied (EN 1993-1-5, 2006). The method is based on the Huber - von Mises - Hencky criterion which represents a critical value of the distortional energy stored in the isotropic material. The plasticity condition for planar elements stressed by a combination of stresses in the form of (
1), or where global buckling mode are utilised, equation (2) can be adopted. Once the equivalent stress σE,Ed is introduced, then equation (2) can be changed to the simplified form (3).
σx,Ed, σy,Ed - normal stress in X or Y direction, respectively, at a point of plate element,
τEd - shear stress at a point of plate element,
σE,Ed - equivalent stress at a point of plate element,
ρx, ρy - reduction factor to take account buckling due to stresses in X direction or Y direction, respectively,
χw - reduction factor to take account buckling due to shear stresses,
ρ - reduction factor to take account buckling of plate element due to planar field of stress, depending on the plate slenderness
\overline \lambda _p fy - value of yield strength,
γM1 - partial safety factor for buckling resistance.
For determination of load-carrying capacity the modified relation (4) can be utilized, while
Where αult,k represents minimum load amplifier for the design loads to reach the characteristic value of resistance of the most critical point of the plate. Based on above-mentioned equivalent stress obtained by linear analysis, an equation (5) was applied.
Reduction factor ρ to take account buckling of plate element due to planar field of stress depend on slenderness, which should be taken from an equation (6).
In (6) αcr designates already discussed minimum load amplifier for the design loads to reach the elastic critical resistance of the plate under the complete stress field (see chapter 3.2.1).
However, relation between reduction factor ρ and plate slenderness
αp = 0.34,
\overline {\rm{\lambda }} _{{\rm{p0}}} = 0.80 αp = 0.34,
\overline {\rm{\lambda }} _{{\rm{p0}}} = 0.70
As already mentioned before, determination of the load-carrying capacity in the form of ZLM71 had to be performed iteratively, with the initial value entering the iteration of ZLM71 = 1.0. Within the iterative procedure, a new stress field is obtained at each step, for which it is necessary to perform the buckling analysis and to determine the corresponding values of the critical multiplier αcr, consequently αult,k, as well.
Nevertheless, once results from linear global analysis and linear buckling analysis are stored in the form of stresses produced by load cases or combinations, the common spreadsheet software or custom utility programs can be helpful, as the principles of superposition and multiplicity can be handled. This makes the task quite practical. However, it is necessary to check at each step, whether the same point of assessment is still decisive for the changed value of ZLM71, and whether the original critical buckling shape is still determinative.
An example of the assessment in the case of box-girder superstructure BR1 is given in Figure 10. Presented results belong to the web of main box-girder in the section located approximately at distance 0.50 m from the support. Stresses are checked at the decisive point (bottom point of the web adjacent to bottom flange).
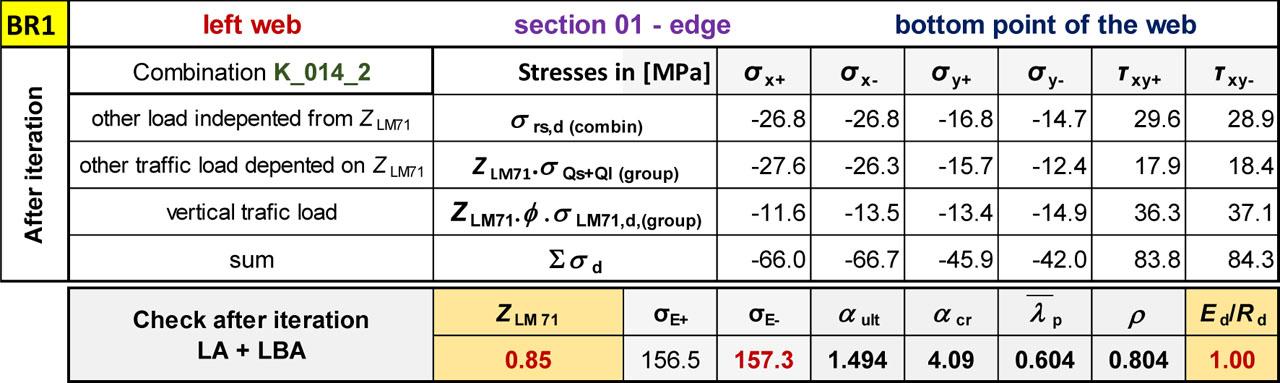
Example of iterative assessment in a predefined point of the assessed panel (BR1)
Since, it is not practical to demonstrate dozens or hundreds of calculated load-carrying capacities, the Table 1 below provides a simplified output for the purposes of this paper. The decisive (minimal) load-carrying capacities together with the description of limiting points/details are given. Table 1 also shows the load-carrying capacities obtained from the fatigue assessment. Due to limited space, a detailed discussion of fatigue is beyond the scope of this paper.
Overview of limiting load-carrying capacities for each analysed superstructure
| Bridge | Point / detail | Stress | ZLM71 | Note |
|---|---|---|---|---|
| BR1 | bottom point of the web | planar stress | 0.85 | resistance |
| weld of centric stirrup to top flange | normal stress range | 0.46 | fatigue | |
| BR2 | top flange near the web | planar stress | 1.02 | resistance |
| weld of diaphragm to main top flange | normal stress range | 0.69 | fatigue | |
| BR3 | bottom point of main web | planar stress | 1.02 | resistance |
| weld of diaphragm to main web | normal stress range | 1.25 | fatigue |
The examples given in the paper show the potential of combining FEA models utilising 2D finite elements for global analysis, linear buckling analysis of plated structures and verification of plated elements using the reduced stress method. The application of such a procedure can lead to more realistic values of the load capacity of plate elements, since it accounts for the complex in-plane stress field. When searching for reserves of aging infrastructure, including bridges, any refinement of the results is desirable as it impacts the correct determination of load-carrying capacity or service life, and thus on limited financial resources for repairs and reconstructions.
This combined procedure has proven to be suitable for re-calculations of existing box-girder bridges. The approach appears to be practical because, if the results from the linear global analysis and the linear buckling analysis are stored, the principles of superposition and multiplicity can be advantageously utilised. However, it is necessary to do some checks whether the same evaluation point is still decisive and whether the original critical shape of the strut is still valid. It should also be added that the above procedure does not use plastic deformation, so it remains conservative.
Based on the determined load-carrying capacities of the superstructures, the transitivity of real traffic through the bridges was determined as well. All analysed superstructures complied with the required track load category in accordance with the classification of lines. For example, in the case of Bridge 1 (BR1), which is located in main line, the required category was D4 for the speed up to 120 km/h.
Since the transitivity is not determined for fatigue, the remaining lifetime of the critical details was estimated using the Palmgren-Miner hypothesis of fatigue damage accumulation. The calculation demonstrated the corresponding value of the required 50 years remaining service life of the relevant details of all analysed structures. However, due to the limited space in this paper, a detailed discussion of this topic lies beyond the scope of this paper.