
Table 1.
Common bean genotypes used in this study
Tabelle 1. In dieser Studie verwendete Genotypen der Gartenbohne
| Common Bean | Location | Region | Coordinates |
|---|---|---|---|
| G1 | Likovc | Skenderaj | 42.6639°N 20.7535°E |
| G2 | Arllat | Drenas | 42.5475°N 20.7980°E |
| G3 | Dobroshec | Drenas | 42.5463°N 20.7882°E |
| G4 | Tupec | Prizren | 42.2031°N 20.6850°E |
| G5 | Landovica | Prizren | 42.2593°N 20.6811°E |
Table 2.
Description of the measured morphological parameters
Tabelle 2. Beschreibung der gemessenen morphologischen Parameter
| Traits | Description/Method |
|---|---|
| ShL | Maximum fresh shoot length (cm), measured from the base of the stem to the top of the plant |
| ShFW | Shoot fresh weight (g) |
| ShDW | Shoot dry weight (g) aher drying for 48 h at 70 ± 5 °C |
| RL | Maximum fresh root length (cm), measured from the node where it divides from the stem to the top of the main root |
| RFW | Root fresh weight (g) |
| RDW | Root dry weight (g) aher drying for 48 h at 70 ± 5 °C |
| PC | Protein concentration in %, determined by the Kjeldahl method (digestion of organic matter with sulfuric acid in the presence of a catalyst, rendering the reaction product alkaline, then distillation and titration of the liberated ammonia, calculation of the nitrogen content, and multiplication of the result by the conventional factor 6.25 to obtain the crude PC) |
Table 3.
Overall means for morpho-physiologic traits of common bean affected by PEG treatments
Tabelle 3. Gesamtmittelwerte für morphophysiologische Merkmale der Gartenbohne, beeinflusst durch PEG-Behandlungen
| Traits | Abbreviation | Unit | Control | 10% PEG | 15% PEG |
|---|---|---|---|---|---|
| Root length | RL | cm | 9.36b | 10.46a | 7.20c |
| Shoot length | ShL | cm | 54.87b | 57.6a | 44.87c |
| Root fresh weight | RFW | g | 0.61a | 0.58b | 0.38c |
| Shoot fresh weight | ShFW | g | 3.69b | 4.24a | 3.26c |
| Root dry weight | RDW | g | 0.11b | 0.14a | 0.07c |
| Shoot dry weight | ShDW | g | 0.53b | 0.58a | 0.37c |
| Intercellular CO2 concentration | Ci | μmol mol−1 H2O | 282.50a | 262.26b | 256.90c |
| Stomatal conductance | gs | mol m−2 s−1 | 122.70a | 49.79c | 54.40b |
| Vapor pressure deficit | VPD | kPa | 0.96c | 0.95b | 0.98a |
| Photosynthetic CO2 assimilation | A | μmol m−2 s−1 | 5.02a | 3.57b | 2.79c |
| Transpiration rate | E | mmol H2O m−2 s−1 | 1.18a | 0.48c | 0.54b |
| Water use efficiency | WUE | μmol CO2/mmol H2O | 6.11c | 7.76a | 7.71b |
| Chlorophyll a | Chl a | mg g−1 FW | 1.42a | 1.30b | 0.90c |
| Chlorophyll b | Chl b | mg g−1 FW | 0.66a | 0.57b | 0.41c |
| Carotenoids | Carot | mg g−1 FW | 1.46a | 1.35b | 0.94c |
| Protein concentration | PC | % | 4.44a | 4.24b | 3.52c |
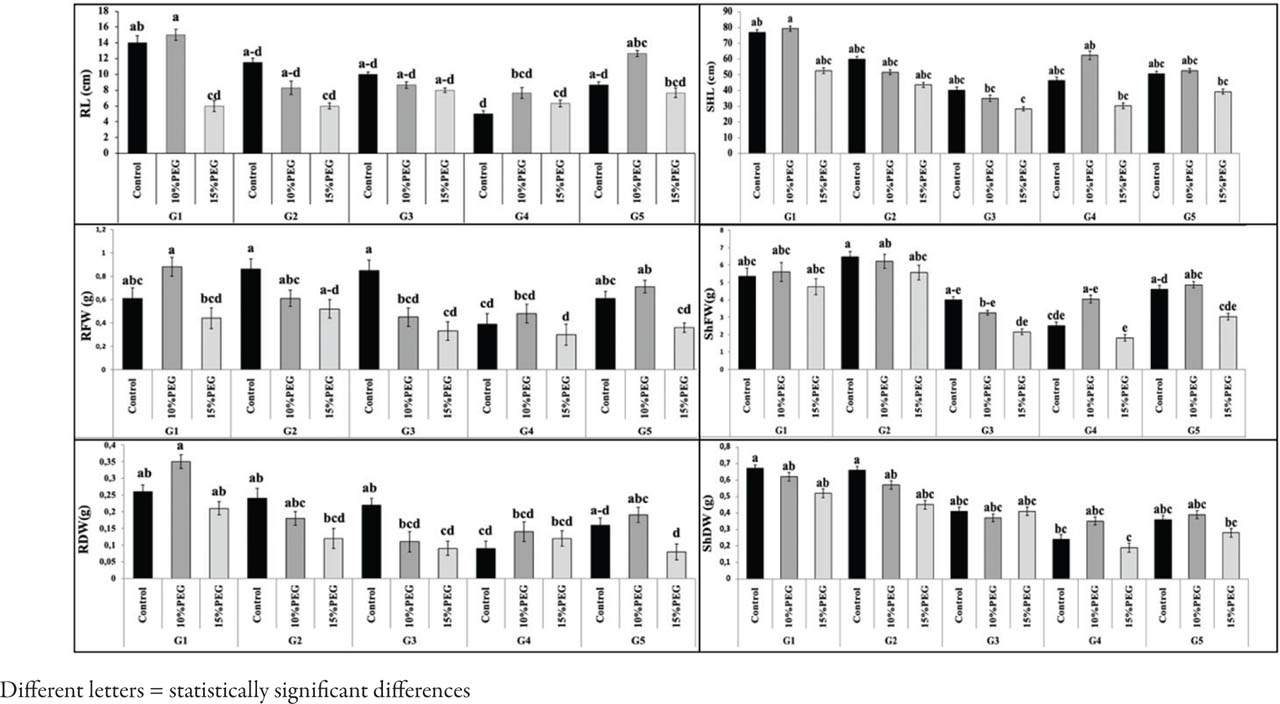
Figure 1.
Plant growth traits (RL, RFW, RDW, ShL, ShFW, ShDW) of common bean affected by PEG treatment and genotype
Abbildung 1. Pflanzenwachstumsmerkmale (RL, RFW, RDW, ShL, ShFW, ShDW) der Gartenbohne in Abhängigkeit der PEG-Behandlung und des Genotyps
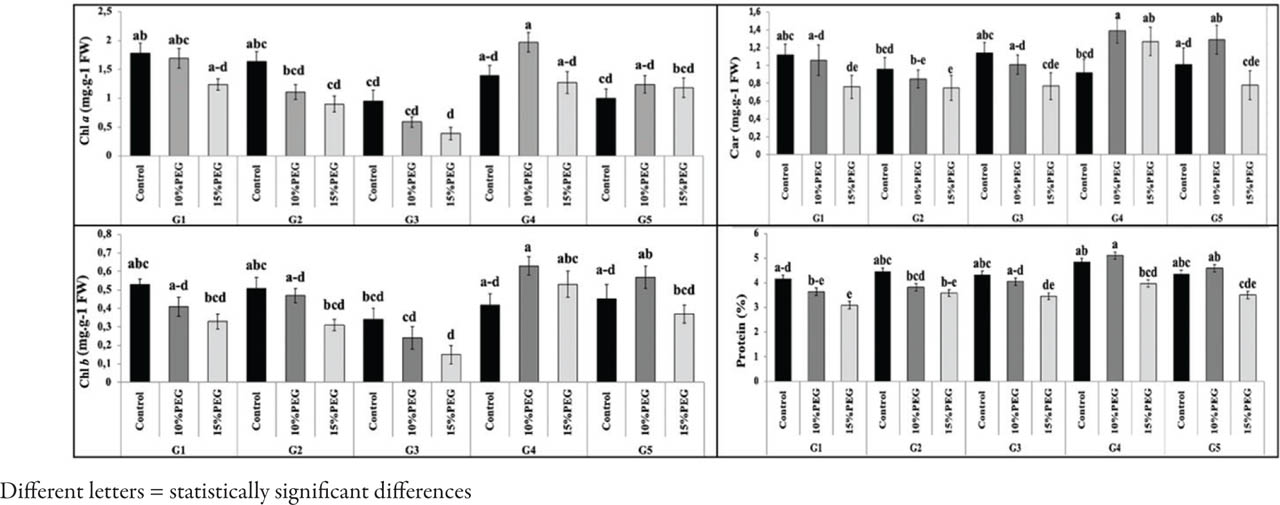
Figure 2.
Photosynthetic pigments and protein concentration of common beans affected by PEG treatment
Abbildung 2. Beeinflussung der photosynthetischen Pigmente und der Proteinkonzentration von Gartenbohnen durch PEG-Behandlung
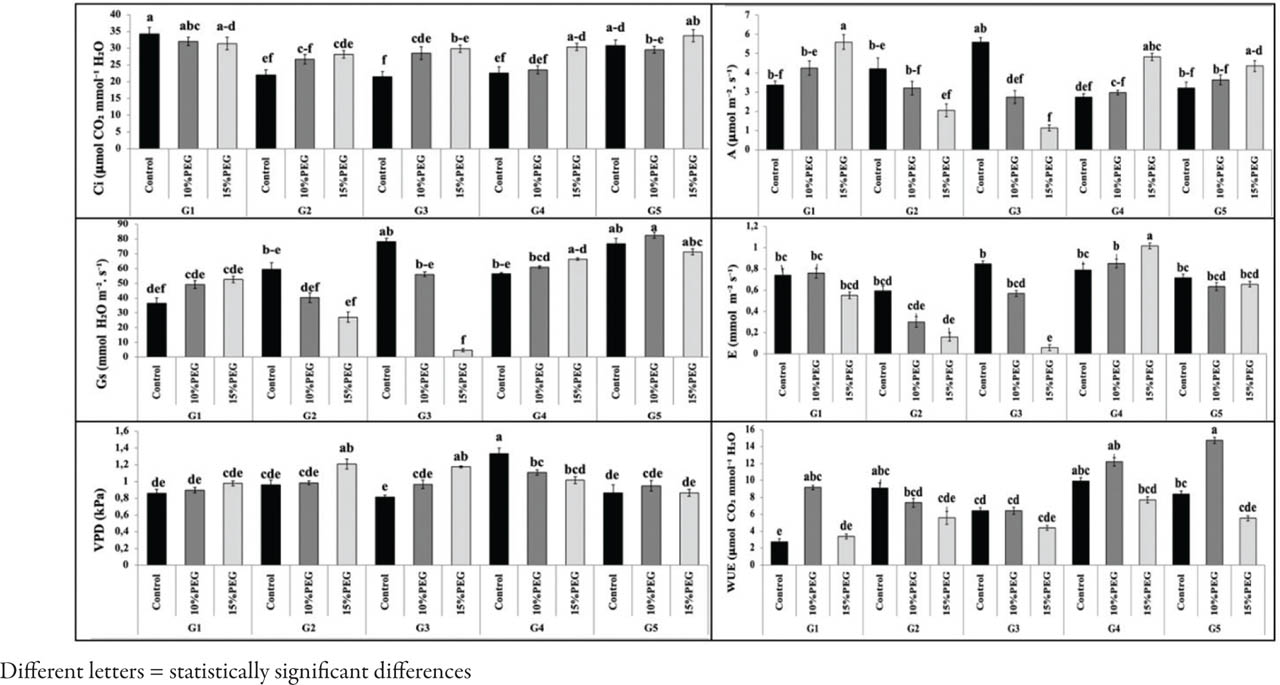
Figure 3.
Photosynthetic parameters of common beans affected by PEG treatment and genotype
Abbildung 3. Photosyntheseparameter von Gartenbohnen in Abhängigkeit der PEG-Behandlung und des Genotyps
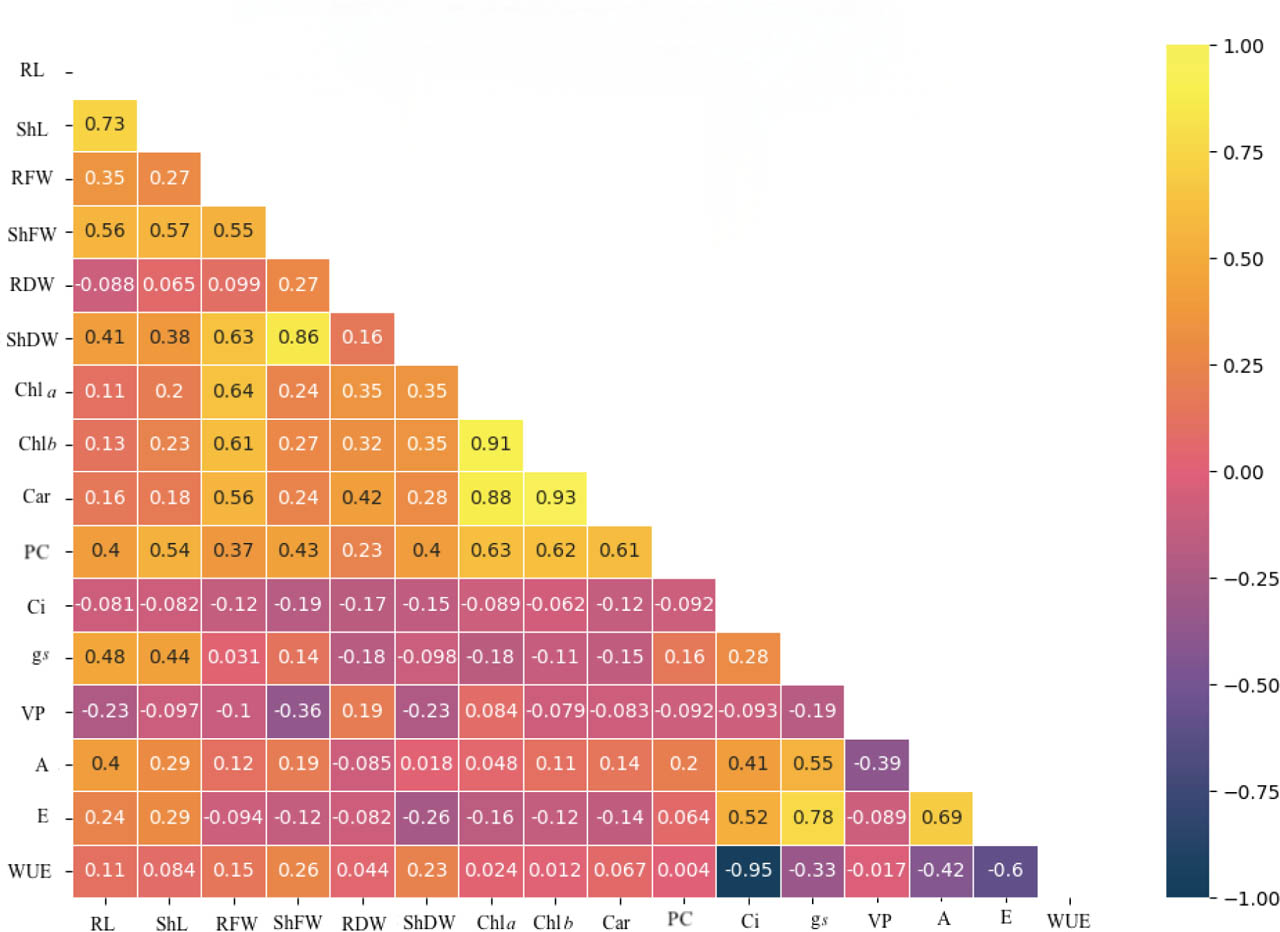
Figure 4.
Correlation coefficients of morpho-physiologic traits of common bean across drought stress conditions (trait abbreviations are defined in Table 2)
Abbildung 4. Korrelationskoeffizienten morphophysiologischer Merkmale der Gartenbohne unter verschiedenen Dürrestressbedingungen (Merkmalsabkürzungen sind in Tabelle 2 definiert)
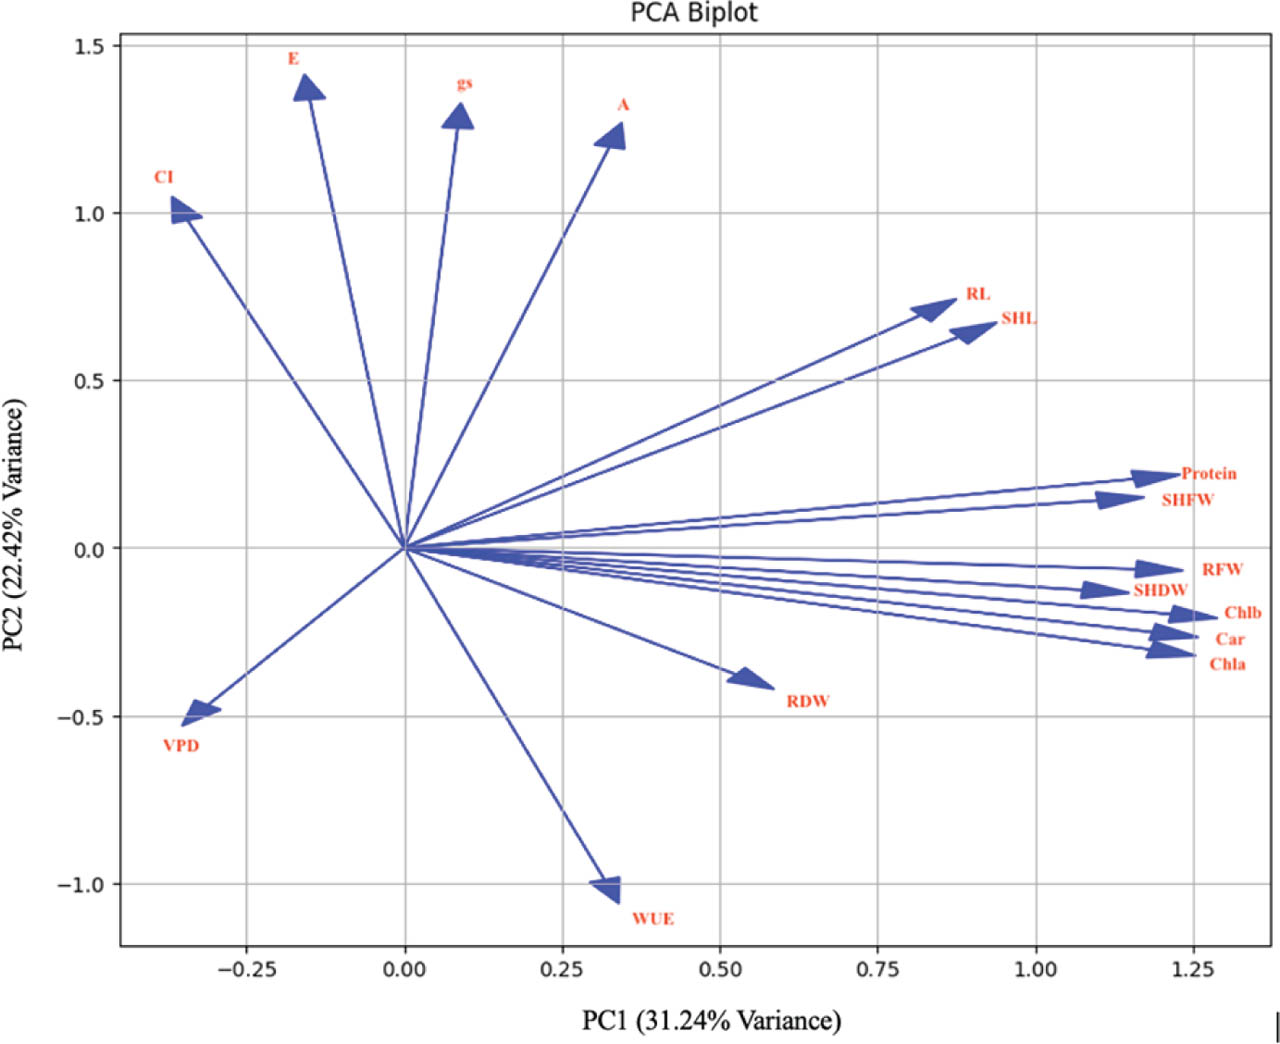
Figure 5.
PCA for morpho-physiologic parameters of common bean across drought stress conditions (trait abbreviations are defined in Table 2)
Abbildung 5. PCA für morphophysiologische Parameter der Gartenbohne unter Trockenstressbedingungen (Merkmalsabkürzungen sind in Tabelle 2 definiert)