
In the field of satellite navigation, systems can be broadly categorized into three types: (i) global navigation systems (GNSS); (ii) satellite-based augmentation systems, which are designed to enhance the accuracy of GNSS such as Japan’s Quasi-Zenith Satellite System (QZSS) and the European Geostationary Navigation Overlay Service (EGNOS); and (iii) stand-alone regional navigation satellite systems, including the earlier generation of the Beidou system and the current Indian Regional Navigation Satellite System (IRNSS). The IRNSS, also known as NavIC (Navigation with Indian Constellation), provides two levels of service: the standard positioning service (SPS) for civilian users and restricted service (RS) for military and authorized users (Organization, Aug. 2017-a).
The NavIC signal is broadcasted at a frequency of L5 band (1176.45MHz) and S-band for civilian and military users, respectively. The signal covers India and a region extends about 1500 km around India. Beside the SPS, IRNSS satellites also provide information related to ocean and advisory information including Potential Fishing Zones (PFZ)/TUNA-PFZ, Ocean State Forecast (OSF), High Wave Alerts (HWA), and Tsunami early warnings to Indian users (Organization, Aug. 2017-b).
For the SPS, IRNSS provides a good position accuracy better than 20 meters within its primary service-covered area (Organization, Aug. 2017-a). Vietnam is located relatively close to India, making the IRNSS signals visible and readily available to Vietnamese users. Figure 1 shows the coverage area of the IRNSS signal in which Vietnam is located not in the main coverage area but in the the secondary coverage zone (Organization, Aug. 2017-a). Our target in this work is to investigate the NavIC SPS in Vietnam. One approach is to use commercial hardware receivers, but this requires changing the hardware that supports NavIC/IRNSS. Currently, software receivers offer several advantages compared to the traditional hardware ones, such as portability, flexibility, configurability, cost-effectiveness, and many other aspects. There are some software receiver products available in the market now, such as IFEN SX3 (IFEN, 2024), Spirent SDR (Spirent, 2024), etc., the prices for these software receivers are not cheap though. By developing our own software receiver, we can extract several outputs from every step of the receiver. These outputs might be useful for further research into the NavIC signal.

IRNSS coverage area
GNSS (Global Navigation Satellite System) Software-Defined Radio (SDR) has evolved from early implementations on specialized hardware to real-time processing on general-purpose computers (Pany et al., 2024). Many GNSS software receivers have been developed for modernized signals of GPS, GLONAS, Galileo, and Beidou Systems (Kumar et al., 2024; P. Angeletti & Tognolatti, 2014). One of the most well-known SDRs is the Matlab-based GPS SDR, which is provided as a companion to the book with title: A Software-Defined GPS and Galileo Receiver. This Matlab code is capable of processing GPS L1 C/A in a post processing mode. There is another well-known one, which is open source written in C/C++ published on github (https://github.com/gnss-sdr/gnss-sdr), GNSS-SDR, capable of processing in real time for several GNSS signals including L1, L2, L5, E6 band. However, these two well-known SDRs do not support IRNSS/NavIC signal. Srinu et al. proposed a time synchronous framework based on post-processing for a MATLAB-based NavIC Software Receiver, named NavICSR which can process the signals stored in a file for the SPS L5 and S bands (Srinu C., 2020). The same author also proposed to modify some modules in the GNSS-SDR to make them suitable for L5 SPS signals. The modified SDR can process IRNSS/NavIC SPS signals in post-processing and even in real time for users’ PVT computation. Beside SPS decoding, many other researchers developed SDR for decoding other types of messages of NavIC. Reddy D et al. modified GNSS-SDR to test the 1A message at the Training unit for Navigational Electronics, Osmania University (Ravindar Reddy D. & P., 2021). However, these traditional SDRs mainly rely on correlation-based acquisition methods, which are known to degrade significantly under low SNR conditions. Motivated by recent advances in deep learning for GNSS acquisition (Borhani-Darian et al., 2023; Li et al., 2022; Mohanty & Gao, 2024; Moradi et al., 2023), we integrate a neural network-based detection module in our acquisition pipeline to improve detection robustness.
Other works focused on IRNSS/NavIC performance observation. The work in Desai and Shah, 2021 observes the ionospheric delay and positioning accuracy of IRNSS/NavIC L5 band under the influence of the intense geomagnetic storm and the under the impact of seasonal variation. D. Jagiwala et al showed a case study of IRNSS/NavIC performance observation on a low latitude region (D. D. Jagiwala & Desai, 2021). They evaluated many aspects of the signal including C/N0, elevation angles, pseudo-ranges, ionospheric delay, and tropospheric delay.
Based on the analysis above, this work proposes two contributions: first, we develop a software receiver for IRNSS/NavIC SPS signal decoding since there is no public one in the market dedicated to IRNSS/NavIC signal before; second, we redesign the acquisition module using a lightweight convolutional neural-network (CNN) that classifies delay–Doppler patches of the cross-ambiguity function, thereby increasing detection sensitivity by approximately 4dB compared to the classical FFT-based search (Borhani-Darian et al., 2023). Finally, we evaluate the performance of the signal in Vietnam, a low latitude region, located in the coverage area but not the main one of the IRNSS constellation. To the best of our knowledge, there is no similar research in the region.
Since the IRNSS/NavIC SPS signal characteristics are like those of GPS L1 C/A, we can, therefore, reuse the acquisition and tracking blocks of the Matlab GPS SDR with some minor modifications for the IRNSS/NavIC signal. After the tracking phase, we need to decode the navigation message. The navigation data encoding of IRNSS/NavIC SPS signal, however, is totally different from the GPS one. Therefore, it is necessary to rewrite the decoding module. This navigation decoding module is rewritten according to the IRNSS/NavIC interface control document (ICD). To evaluate the performance of IRNSS/NavIC signal, several measurements are taken into account, including satellites availability, signal quality - CN0, position accuracy, elevation angles.
The rest of this paper is constructed as follows: Section 2 gives a brief introduction of the IRNSS/NavIC SPS signal model as well as the navigation data structure. Section 3 explains the implementation of our software receiver for NavIC SPS signal. Section 4 presents experimental setup and results.
Basic services provided by IRNSS include Standard Position Service (SPS), an open service without any encryption; and Restricted service (RS), an authorized one with encryption for subscribed users. The IRNSS SPS service is transmitted on L5 (1164.45–1188.45 MHz) and S (2483.5–2500 MHz) bands. The carrier frequency and the bandwidth of L5 are 1176.45 MHz and 24 MHz, respectively. The SPS signal is composed of the following three components:
Carrier: the carrier wave with frequency fL5
Navigation data: this contains information regarding satellite, clock, and other information needed to compute satellites’ position. The SPS navigation data have a symbol rate of 50 sps (or 25 bps due to 1/2 rate FEC encoded).
Spreading sequence (or PRN code): each NavIC satellite has a unique pseudo-random number spreading code (PRN), which is generated using gold codes. The code is a sequence of 1023 chips and is repeated every millisecond giving the chipping rate of 1.023 MHz.
Due to the considerable similarities in signal characteristics, individuals with experience in GPS signal processing can readily adapt to working with the IRNSS SPS signal. Table 1 shows the common parameters of both systems: There are few differences between the two systems (GPS L1 C/A and IRNSS L5 SPS), they are listed in Table 2.
Common parameters between GPS and IRNSS.
| System parameters | |
|---|---|
| Multiplexing | CDMA |
| Modulation | BPSK |
| Spreading code | Gold-cod 10 bits |
| Chip rate | 1.023 MHz |
| Code length | 1023 chips |
| Code period | 1 millisecond |
Difference between GPS vs IRNSS
| System parameter | IRNSS | GPS |
|---|---|---|
| Carrier center frequency | 1176.45 MHz | 1575.42 MHz |
| Coding scheme | Convolution + Interleaving | Parity check |
| Navigation data rate | 50 sps (50 sps equivalent to 25 bps) | 50 bps |
| System time | IRNSS system time | GPS time |
Figure 2 shows the navigation message structure of IRNSS/NavIC. The master frame is of 2400 symbols long (48 seconds) made of four subframes as shown in Figure 2. Each subframe is 600 symbols long and is transmitted sequentially in 12-second duration. Each subframe starts with the 16-bit number sync word (0xEB90), followed by 584 bits for symbol code corresponding to 292 data bits, and ends with 6-zero tail bits. The data bits in every subframe transmit TLM, TOWC, Alert, Autonav, Subframe ID, spare bit, navigation data, CRC, and tail bits.

IRNSS message frame’s structure
The navigation data (Nav data) in subframe 1 and 2 consist of primary navigation parameters, which are as follows:
Satellite ephemeris
Satellite clock correction parameters
Satellite and signal health status
User range accuracy
Total group delay
The Nav data in subframe 3 and 4 give following parameters as part of the secondary navigation parameters:
Satellite almanac
Ionospheric grid delays and confidence
IRNSS Time Offsets with respect to UTC and GNSS
Ionospheric delay correction coefficients
Text messages
Differential corrections
Earth orientation parameters
We are developing the IRNSS software receiver based on an existing open-source GNSS-SDR written in Matlab. Figure 3 shows the block diagram of signal flow graph for the IRNSS/NavIC signals and it is identical with block diagram of SDR for GPS signal. The process consists of four main blocks: acquisition, tracking, navigation decoding, and PVT computation. In this work, the acquisition block is redesigned using a convolutional neural network (CNN)-based classifier to detect satellite presence in correlation maps more robustly under noise (Figure 4). For the implementation of acquisition and tracking block, we have to modify some minor parts of the GNSS-SDR due to the similarity in characteristics of IRNSS/NavIC SPS and GPS L1 C/A (including multiplexing, modulation, coordinate system, and the PRN code characteristics). In particular, the IRNSS/NavIC PRN number is defined from 1 to 14. The PRN codes for SPS are generated according to the ICD document.
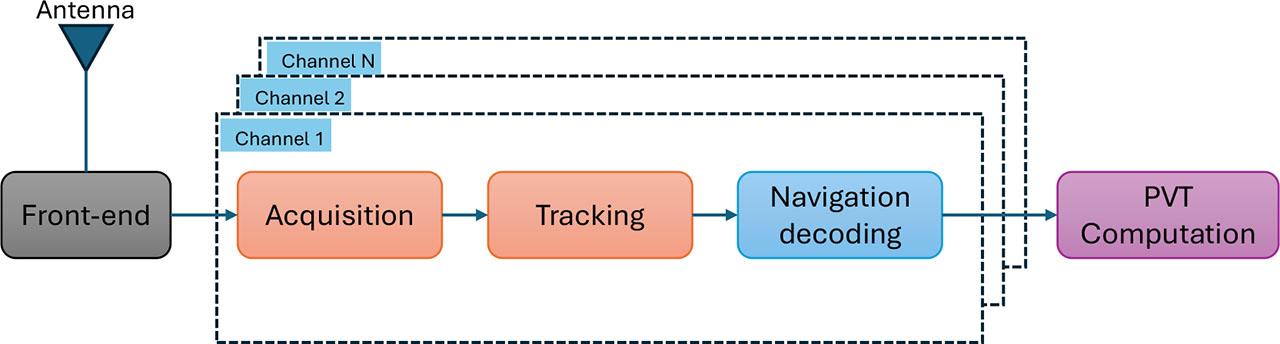
Block diagram of developed SDR for IRNSS/NavIC signal

Deep learning-based acquisition architecture for IRNSS/NavIC signal
Since the IRNSS/NavIC data frame structure and encoding of navigation data differ from GPS L1 C/A signals, the block navigation decoding is the main one that needs to be modified. The process chain is shown in Figure 5. After tracking phase, we have data bits series (samples), a group of 12000 samples belonging to one subframe is accumulated and converted into 600 data bits of 1’s and 0’s by averaging each sequential 20 samples and compared with threshold. We scan 600 data bits to find the IRNSS subframe’s preamble, 0xEB90. After the preamble was found, 2400 data bits of master frame (which includes 4 subframes) is read from the preamble position. The next two steps are to perform de-interleaving and convolutional decoding on the 584 bits of each subframe, yielding 292 data bits per subframe. Final step, the data are decoded according to the IRNSS/NavIC ICD.

Process chain for message decoding.
The final block, PVT computation, computes the navigation solution for the receiver.
We used a desktop computer connecting with a USRP to receive IRNSS/NavIC signal under open sky conditions with antenna installed on roof top of the B1 Building (one of the buildings of Hanoi University of Science and Technology). The configuration setup of the USRP is as follows: 2MHz ADC sampling frequency, IF centered at 0 Hz, and “uint16” datatype. The antenna position is at latitude 21° 0′ 16.35585″, and longitude 105° 50′ 46.95312″. Figure 6 shows the setup of the receiver. The configuration setup of the URSP is shown in Table 3.

Experimental setup
USRP configuration.
| Parameters | Value |
|---|---|
| Output type | Complex int16 |
| Wire Format | Automatic |
| Sync | PC |
| Clock rate | 200 Mhz |
| Input type | short |
| Vector length | 2 |
| Append file | Overwrite |
| Value | 2000000 |
| Gain value | 80 |
| Antenna | TX/RX |
| Center Freq (Hz) | 1176450000 |
| Gain Type | Absolute (dB) |
| Bandwidth (Hz) | 0 |
To thoroughly observe the quality of NavIC signal as well as the performance of our software receiver, we tried to collect the digitized data for several whole days. Due to the limitation of computer storage, the digitized data were collected in a 90-second duration for every hour of the day. The data was collected on May 23rd, May 27th, June 1st, and June 2nd, 2024.
At the receiver, the power of the IRNSS signals is largely overwhelmed by ambient noise. Consequently, the spectrum and histogram depicted in Figure 7 primarily represent this noise. As illustrated in Figure 7a, the bandwidth of the received signal matches the configured bandwidth of the front-end USRP, as detailed in Table 3, while the histogram’s width is influenced by the signal gain.

Check the input signal quality
During the acquisition stage, the uncertainty regarding the availability of specific satellites and the extent of Doppler shift and code delay require a comprehensive search across all possible values of code and Doppler frequency. This is achieved by generating a local code and carrier signal and then performing a correlation with the received signal. If a satellite is present, a prominent peak will emerge above the ambient noise, as illustrated in PRNs 1, 2, 3, 5, 7, 9, and 10 (Figure 8). In contrast, if no satellite is available, the correlation result will only show ambient noise, as depicted with PRNs 4, 6, 8, 11, 12, 13, and 14.
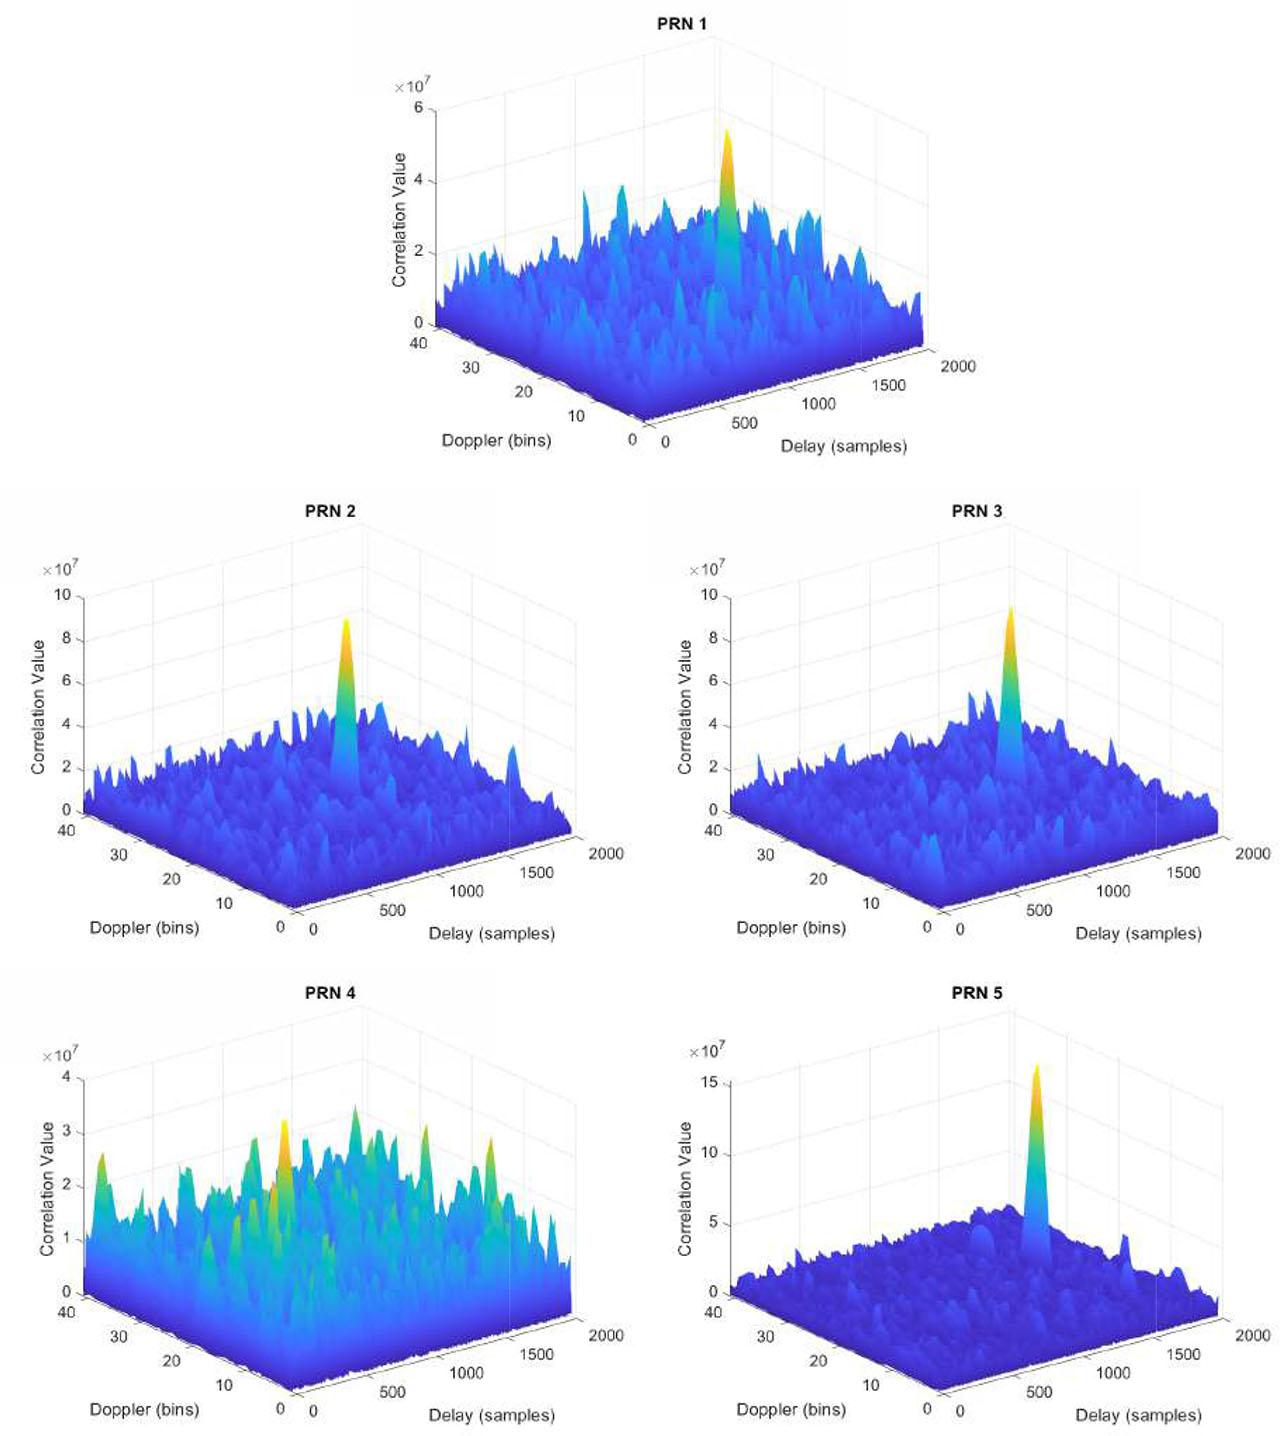
Acquisition CAF plots for all IRNSS PRNs at 12:31:37 May 23rd 2024
Various criteria exist to determine whether a satellite has been acquired; for this analysis, instead of relying solely on traditional correlation-based detection, we applied a CNN-based classifier to identify acquisition peaks from correlation maps. This deep learning model was trained offline on synthetic CAF data to handle different noise and Doppler conditions, significantly reducing false positives in noisy channels.
Since the tracking results of the acquired satellites show similar behavior, PRN 10 is selected for visualization. The tracking result of PRN 10 in Figure 9 indicates that the receiver is operating in a low signal-to-noise ratio (SNR) environment, which is reflected in the noisy outputs of both the PLL and DLL discriminators. Low SNR can cause increased fluctuations in the phase and code tracking loops, leading to potential cycle slips in the PLL and a degraded ability to maintain precise code alignment in the DLL. This issue is especially apparent in the raw discriminator outputs, where the higher amplitude noise affects the tracking accuracy.

Tracking plot for PRN 10 from 12:31:37 to 12:32:27 (50 seconds) on May 23rd 2024
Despite the challenges posed by the low SNR environment, the tracking results demonstrate successful acquisition and tracking of the IRNSS signal. The stable patterns in both the PLL and DLL discriminator outputs, particularly after filtering, indicate that the receiver maintains a reliable lock on the carrier phase and code phase. Although noise is present, extending the tracking loop bandwidth and lengthening the integration time have helped to mitigate its impact, allowing the receiver to maintain consistent tracking.
As shown in Figure 10, the figure illustrates the Carrier-to-Noise Density Ratio (C/N0) for the NavIC L5 band satellites, capturing signal strength variations under low-elevation and low-SNR conditions as observed in Vietnam. The results show that while some satellites maintain relatively high C/N0 values, others display significantly lower levels, leading to varying tracking performance across satellites.

C/N0 values of all PRNs from 12:31:37 to 12:32:27 (50 seconds) on May 23rd 2024
For satellites with higher C/N0 values, the tracking loops are likely locked, indicating successful acquisition and stable tracking. These satellites, positioned at slightly higher elevations or with less obstruction, provide a sufficiently strong signal for the receiver to maintain a consistent lock.
However, satellites with low C/N0 values, often due to lower elevation angles and increased atmospheric attenuation, exhibit weaker signal strengths. These satellites face frequent unlocks and unstable tracking, as the signal fades below the receiver’s detection threshold.
In this environment, only a subset of satellites is consistently visible and tracked successfully. The remainder, hindered by poor signal quality, cannot maintain the lock reliably, leading to intermittent tracking or complete loss of lock. This variation emphasizes the impact of low elevation and low SNR on satellite visibility and tracking stability, highlighting challenges in using NavIC signals for navigation in fringe coverage areas like Vietnam.
In Figure 11, the sky plot demonstrates that most visible IRNSS satellites are at low elevation angles, typical for Vietnam, which lies at the edge of the IRNSS coverage area. Despite this low elevation, the Position Dilution of Precision (PDOP) remains at a reasonable average of 2.4475, indicating sufficient satellite geometry for feasible positioning. This low elevation distribution challenges the receiver’s ability to maintain lock, yet the stable PDOP and tracking results confirm that the system can still provide useful positioning data.
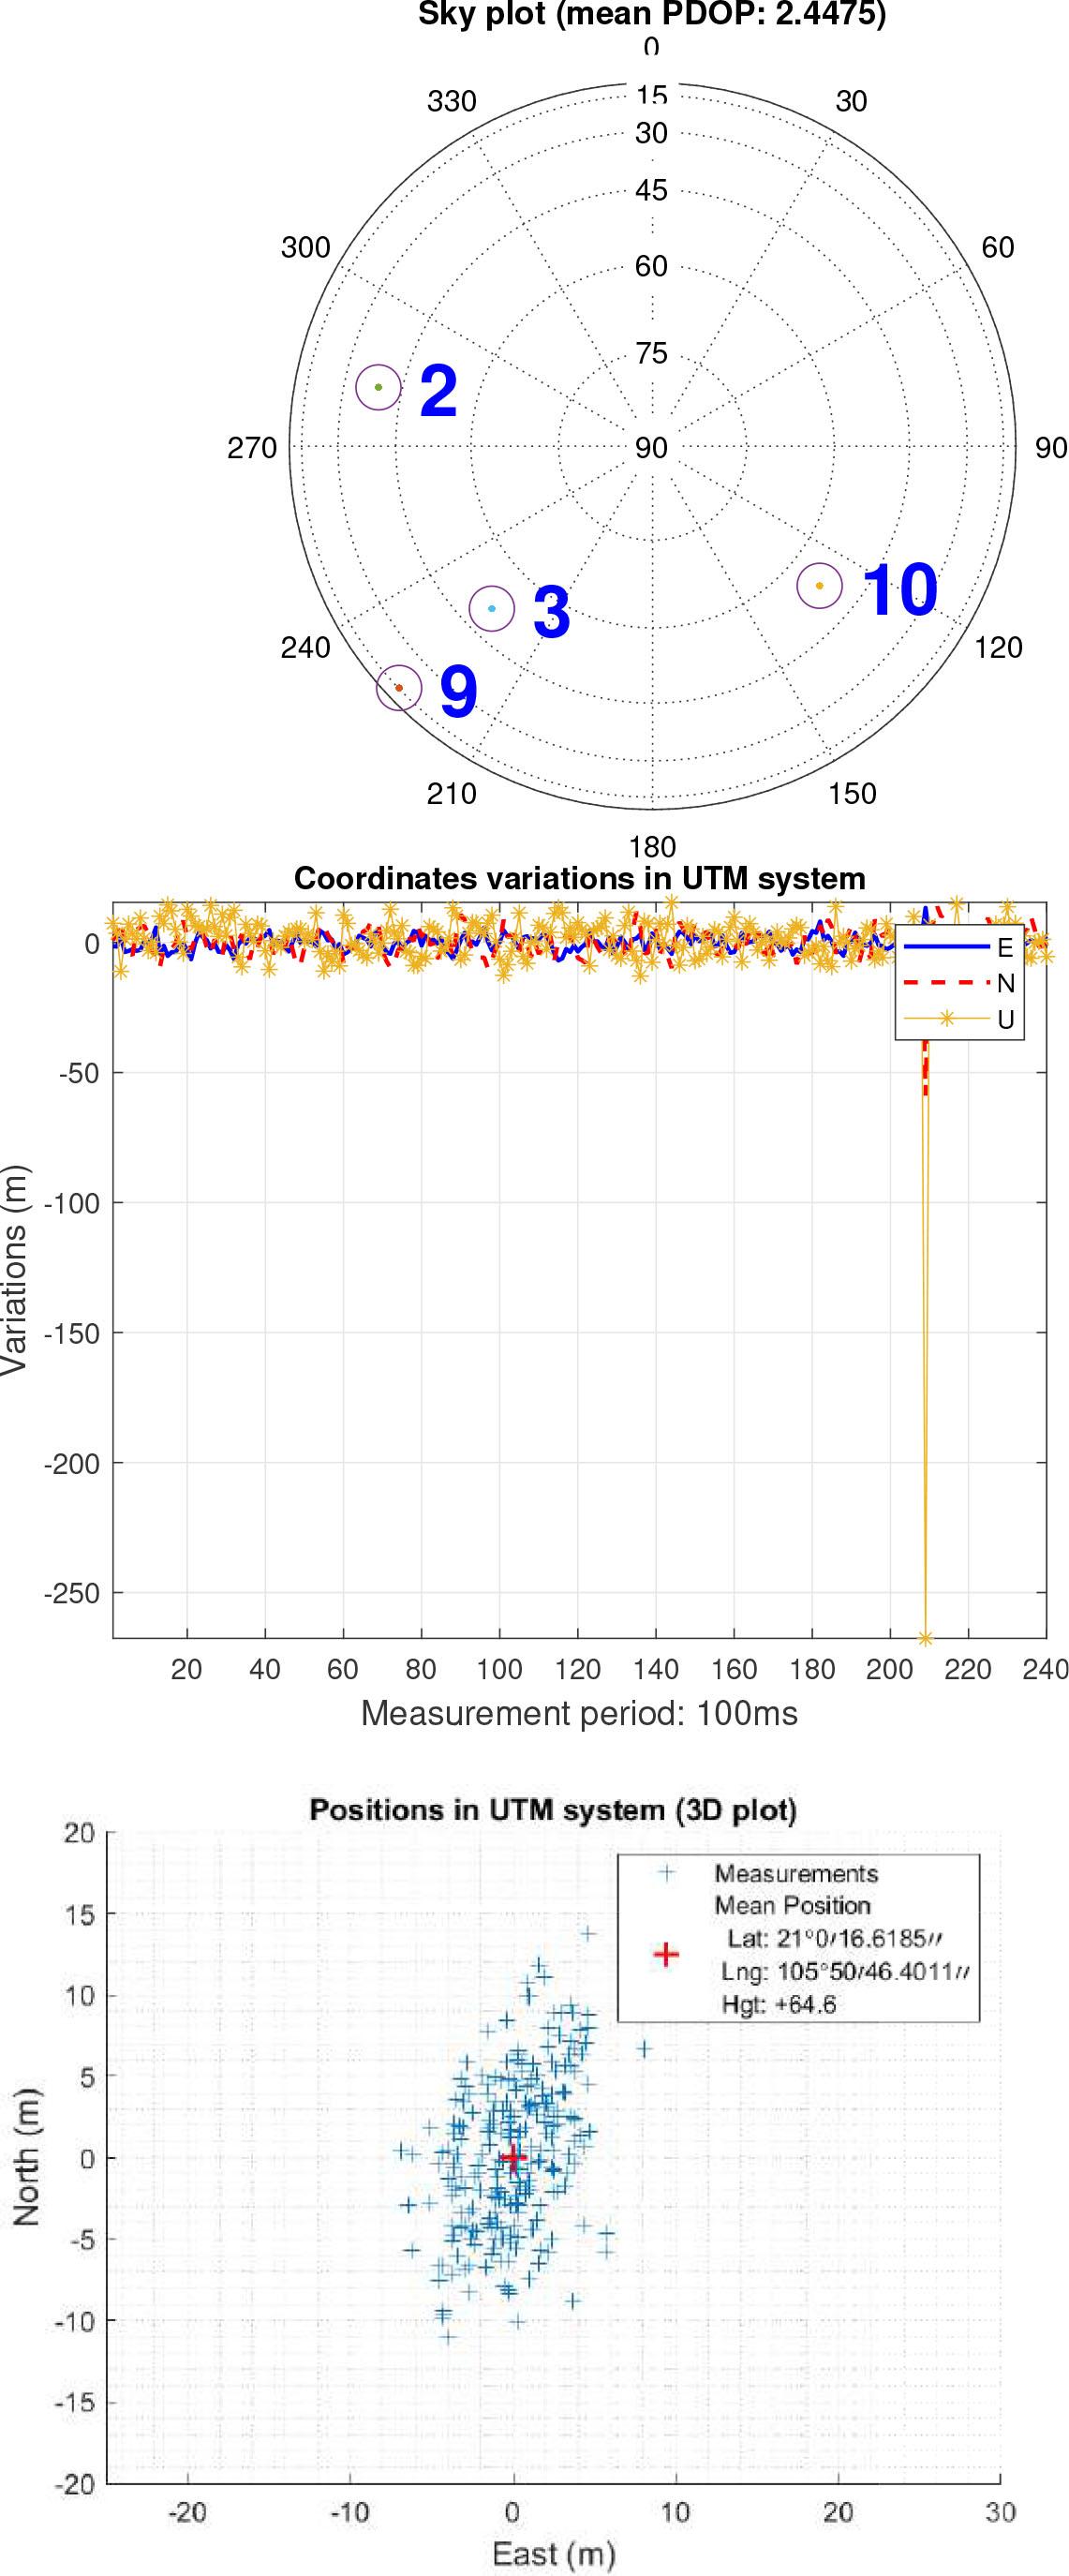
Navigation solution at 12:31:37
The top plot shows stable variations in the East (E), North (N), and Up (U) coordinates over time. Despite the low SNR, the SDR receiver demonstrates consistent horizontal (E and N) positioning, with only minor fluctuations in the vertical (U) component. This stability suggests that the receiver successfully tracks IRNSS signals, achieving reliable positioning accuracy. The variations remain within acceptable limits, proving that even with weaker signals due to low elevation, the receiver can maintain accurate positional data.
The scatter plot shows a dense clustering of positional measurements around the mean position, with a horizontal spread of approximately ±10 meters. This tight clustering is indicative of reliable horizontal positioning accuracy, affirming that the SDR receiver can sustain accurate positioning using IRNSS signals, even in a low-elevation, low-SNR environment. This result proves the system’s capability to deliver consistent navigation performance suitable for general applications in Vietnam.
We found very interesting information about satellites PRN 5 and PRN 7 of the NavIC signal. Even though these satellites could be acquired perfectly as shown in Figure 8, there are no navigation messages in the navigation bit after the tracking phase. Figure 12 shows the tracking results of PRN 5 and PRN 7 and we can see a strange pattern of navigation message bits.

Tracking plots for PRN 5 and PRN 7 on May 23rd 2024
Figure 13 illustrates the navigation bits after FEC decoding of four subframes (1168 bits in total, 292 bit for each subframe). The small red circles mark all the bit number 28th and 29th for every subframe-these two bits indicate the subframe id. It can be seen that PRNs 5 and 7 contain only subframe 4 and lacking all other subframes. This indicates that the operation of satellites 5 and 7 were not correct at the time of our experiment (they might be in the maintenance progress). Due to this reason, these two PRNs will be removed from the final PVT solution equations and thus reduce the accuracy of the final position solution.

Navigation bits after FEC decoding of PRN 5 and PRN 7
Figure 14 shows IRNSS satellite acquisition results across several days and different times, illustrating the consistency in visible satellite PRNs and variations in acquisition metrics over time.

Acquisition results for different days
Across all four subplots, the visible satellites (indicated by green and blue bars) remain consistent. This is evident as the same PRNs are observed in each acquisition attempt, confirming that the receiver detects a similar set of IRNSS satellites during each observation. This consistency suggests that the receiver is operating within a stable coverage area for IRNSS, with predictable satellite visibility patterns in this region.
The green bars indicate successfully acquired signals, whereas blue bars represent satellites that are visible but not acquired. While PRNs like 5, 7, and 10 are consistently acquired, others, such as PRN 2 and PRN 12, exhibit more instances where they are visible but not acquired, suggesting that these satellites may be at lower elevation angles or have weaker SNR, challenging acquisition stability.
Although the visible satellites remain the same, the acquisition metrics (height of the bars) fluctuate across different times and dates. For example, PRN 5 consistently shows high acquisition metrics in all instances, indicating a strong and reliable signal, while other satellites, such as PRN 1 and PRN 11, have lower acquisition metrics, reflecting weaker signals. This variation could be attributed to environmental factors, changes in atmospheric conditions, or fluctuations in signal strength due to satellite positioning.
The consistency in visible satellites combined with a stable acquisition of key satellites (e.g., PRNs 5, 7, and 10) demonstrates that IRNSS signals are feasible for use in Vietnam. Despite some fluctuations in acquisition metrics, the receiver can reliably acquire multiple satellites, providing a robust basis for positioning in this area.
The chart in Figure 15 displays the Carrier-to-Noise Density Ratio (C/N0) for 14 IRNSS satellites over a 24-hour period on June 1, 2024. The results highlight variations in signal strength across different satellites and time, reflecting the impact of satellite geometry and environmental factors on signal quality.
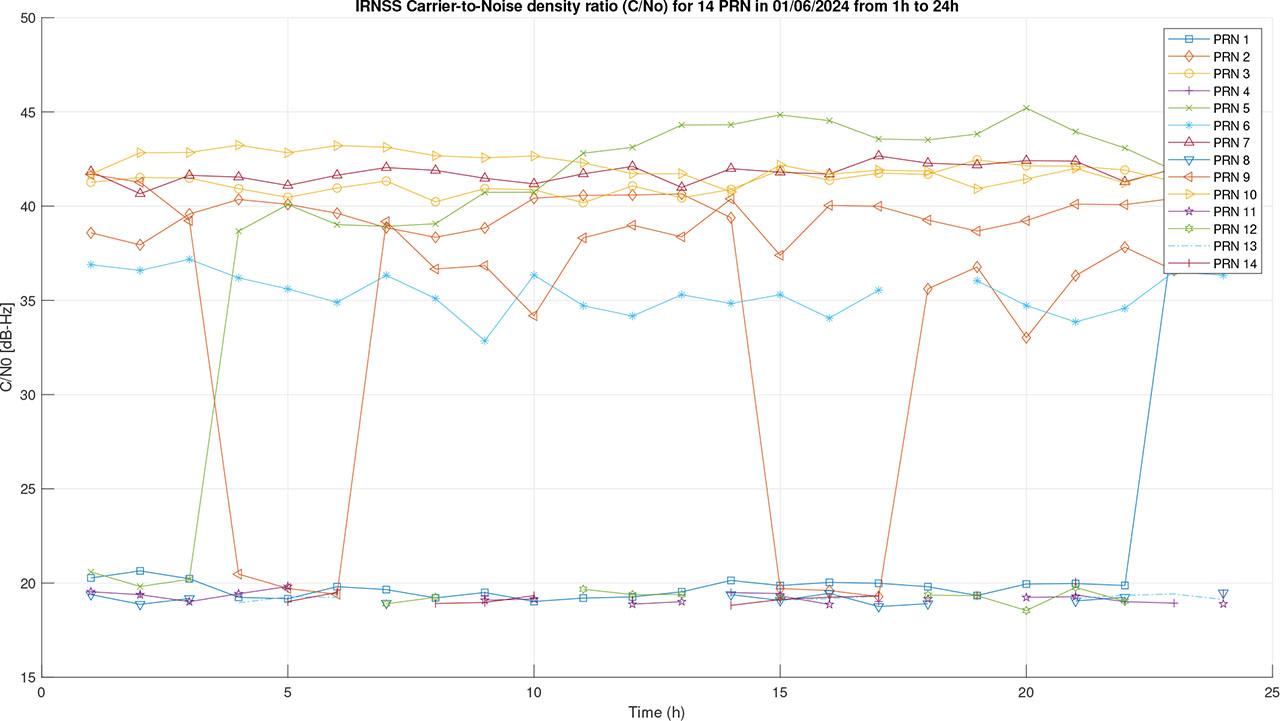
CN0 for 24 hours on Jun 01st
Some satellites, such as PRNs 1, 5, and 7, maintain relatively high C/N0 values around 45–50 dB-Hz throughout the entire day. This stability indicates strong, reliable signals that are likely from satellites at higher elevation angles with consistent visibility. These high C/N0 values suggest that these satellites provide robust tracking capabilities, even over extended periods.
PRNs 3, 6, 8, and 10 display moderate C/N0 values, ranging between 40 and 45 dB-Hz, with some fluctuations over the 24-hour period. These satellites remain visible and provide usable signals, although the moderate C/N0 values suggest that they may be positioned at lower elevations or experience occasional attenuation due to environmental factors.
Notably, some satellites, such as PRNs 6 and 9, show abrupt drops in C/N0 to very low levels (near 0 dB-Hz) at specific times (around 3–5 hours and 17–19 hours). These dropouts indicate temporary loss of signal, possibly due to satellites moving below the horizon or entering regions of poor geometry. Such dropouts affect tracking continuity and may require additional satellites for stable positioning.
The presence of multiple satellites with stable and high C/N0 values suggests that IRNSS can be feasibly used for navigation in Vietnam over a 24-hour period. Satellites with high or moderate C/N0 ensure reliable signal availability for most of the day, while the occasional dropouts from lower C/N0 satellites may have minimal impact on overall positioning performance.
The skyplot (Figure 16) provides a visual representation of the IRNSS satellites’ positions over a 24-hour period, supplementing the Carrier-to-Noise Density Ratio (C/N0) chart above. The skyplot shows the trajectories of various satellites in terms of azimuth and elevation, which directly impact signal strength and acquisition quality observed in the C/N0 chart.

Skyplot for 24 hours

Skyplot for 48 hours
The plot reveals that the majority of the satellites are positioned at low elevation angles, particularly along the southwestern and southern horizons. PRNs 2, 6, and 9 appear to have extended trajectories near the horizon (elevations below 30 degrees). Low elevation angles generally result in lower C/N0 values due to increased atmospheric attenuation and multipath interference, explaining the weaker signal strengths observed in the C/N0 chart for these satellites.
Satellites such as PRN 3 and PRN 10 have relatively short paths, confined to low elevations in the southeastern part of the sky. This limited movement suggests that they are likely geostationary or geosynchronous satellites, which stay in a fixed position relative to the observer. Their positioning also leads to low-to-moderate C/N0 values, as seen in the previous chart, further supporting the conclusion that IRNSS signals in Vietnam are mostly received at low elevations.
Despite the low elevations, the skyplot confirms that certain satellites remain visible throughout the day, supporting continuous positioning. Although low-elevation angles generally reduce signal quality, the presence of multiple satellites, even at low elevations, proves that IRNSS can still be feasibly used in Vietnam. However, low C/N0 values may necessitate receiver optimizations or hybrid GNSS solutions to improve reliability.
Table 4 presents position errors (in meters) measured over 24-hour periods on three consecutive days (May 31st to June 3rd). Each entry shows the position error at specific timestamps, allowing a comparison of error fluctuations over time and across different days.
Position errors on 24 hours of different days
| Position Error (m) | |||
|---|---|---|---|
| Timestamp | May 31st to Jun 01st | Jun 01st to Jun 02st | Jun 02nd to Jun 03rd |
| 08h08 | 33.799 | 26.603 | 24.391 |
| 09h08 | 33.799 | 24.701 | 29.853 |
| 10h08 | 25.282 | 29.419 | 27.301 |
| 11h08 | 24.077 | 30.654 | 26.301 |
| 12h08 | 19.548 | 29.672 | 22.105 |
| 13h08 | 23.021 | 26.279 | 25.620 |
| 14h08 | 26.312 | 28.145 | 29.931 |
| 15h08 | 81.092 | 30.279 | 116.789 |
| 16h08 | 18.969 | 37.771 | 287.028 |
| 17h08 | 16.200 | 26.711 | 34.795 |
| 18h08 | 29.095 | 25.321 | 44.743 |
| 19h08 | 26.686 | 19.269 | 27.064 |
| 20h08 | 27.063 | 16.008 | 21.467 |
| 21h08 | 24.116 | 19.926 | 20.831 |
| 22h08 | 18.608 | 23.237 | 21.786 |
| 23h08 | 19.233 | 19.428 | 13.061 |
| 00h08 | 21.068 | 30.044 | 16.809 |
| 01h08 | 28.057 | 17.627 | 28.040 |
| 02h08 | 22.837 | 28.461 | 29.899 |
| 03h08 | 28.939 | 30.769 | 33.448 |
| 04h08 | 27.689 | 60.949 | 42.273 |
| 05h08 | 23.232 | 30.203 | 26.902 |
| 06h08 | 29.191 | 26.937 | 20.437 |
| 07h08 | 21.802 | 26.068 | 23.469 |
The position errors generally fall within a range of approximately 16–30 meters on most timestamps across all days, indicating reasonably stable positioning performance. This consistency in error magnitude suggests that the receiver can achieve feasible accuracy in this environment.
On certain timestamps, notably on June 2nd to June 3rd, there are significant spikes in position errors (e.g., 116.7896 meters at 15h08, 287.0283 meters at 16h08). These high errors could be due to temporary loss of signal, poor satellite geometry, or environmental factors such as signal obstruction or multipath effects, which compromise positioning accuracy.
Despite occasional high error spikes, the majority of position errors remain under 30 meters, which supports the feasibility of using IRNSS for positioning in Vietnam. While the system provides reasonably accurate results for most of the day, temporary errors indicate that additional measures, such as integrating with other GNSS or applying correction techniques, may enhance reliability for precise applications.
This work presents the implementation of a software-defined receiver for IRNSS/NavIC standard position service L5 signal, with a deep learning-based acquisition module to enhance signal detection reliability under low SNR. The implementation relies on an open-source Matlab GPS SDR with the modification of the navigation message decoding module. After that, we tested the performance of the developed SDR in Vietnam, which is located not in the main coverage of the IRNSS constellation. The experimental results show the possibility of receiving and decoding IRNSS/NavIC signal in Vietnam. The quality of the received signal is good. There are totally 14 satellites of the system in the sky, only four satellites are usually available for PVT computation in Vietnam though. We found an interesting point that the navigation messages of PRN 5 and 7 are not available at the time of experiment conducting even though the signal is still available (the developed received can do the acquisition and tracking phases).
With the capable of exploiting IRNSS/NavIC signal in Vietnam, we can use these available satellites for developing multi-system navigation receivers. In the future, we plan to assess the performance of the developed IRNSS receiver in dynamic condition.
Future work will explore the real-time integration of deep learning modules and their optimization on embedded platforms for on-device inference.