
Figure 1.
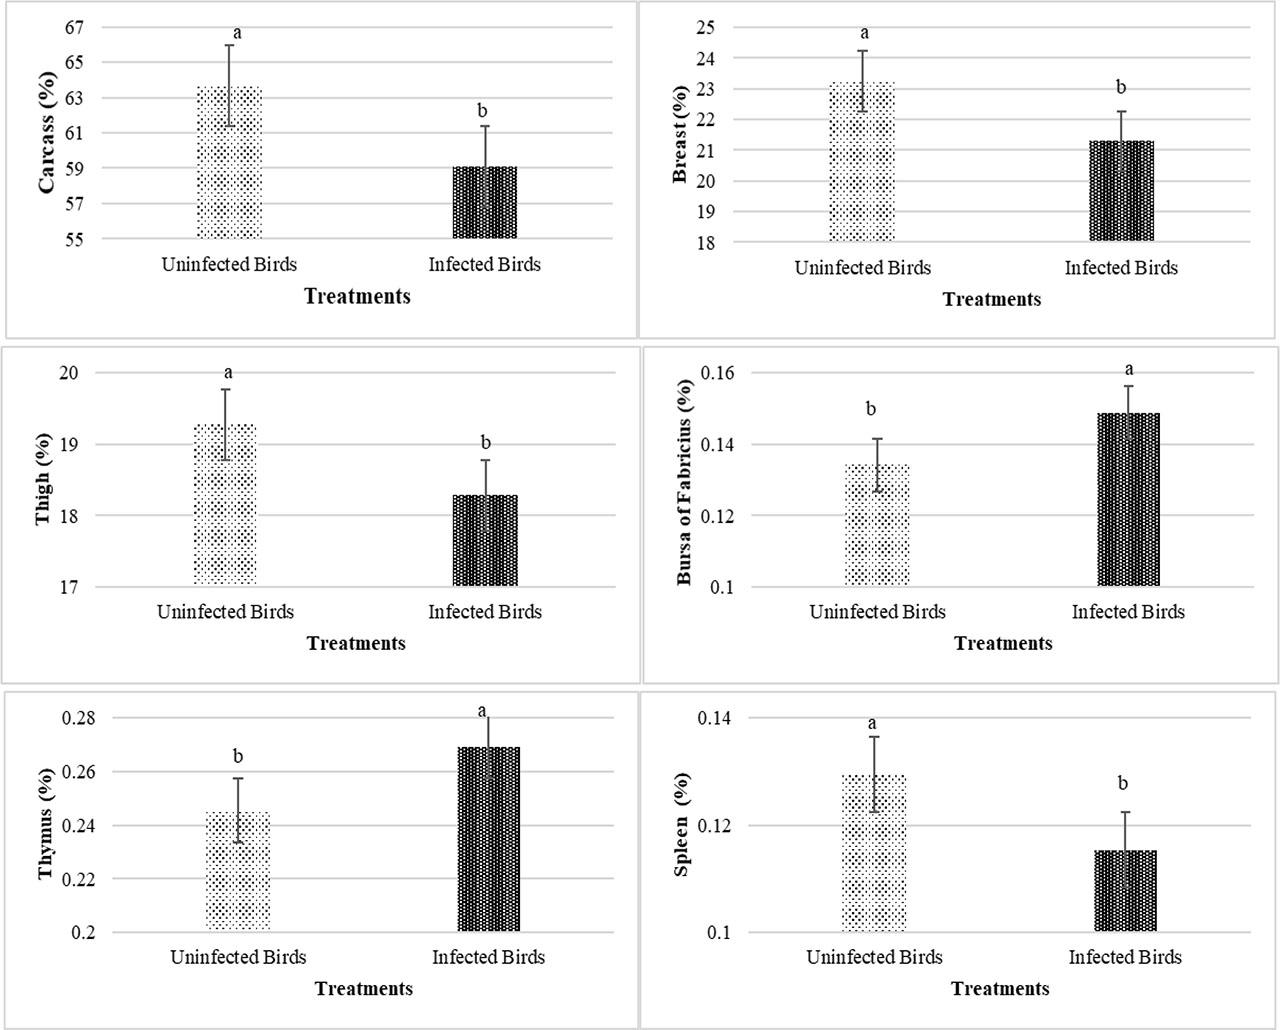
Figure 2.
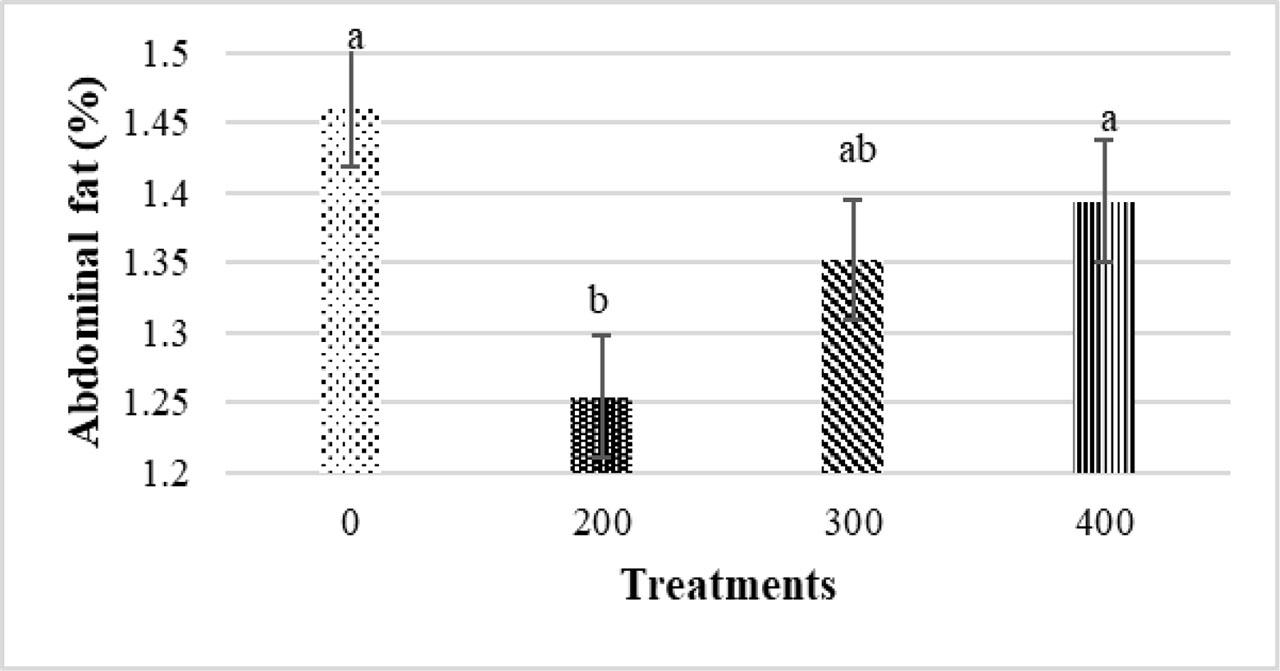
Figure 3.
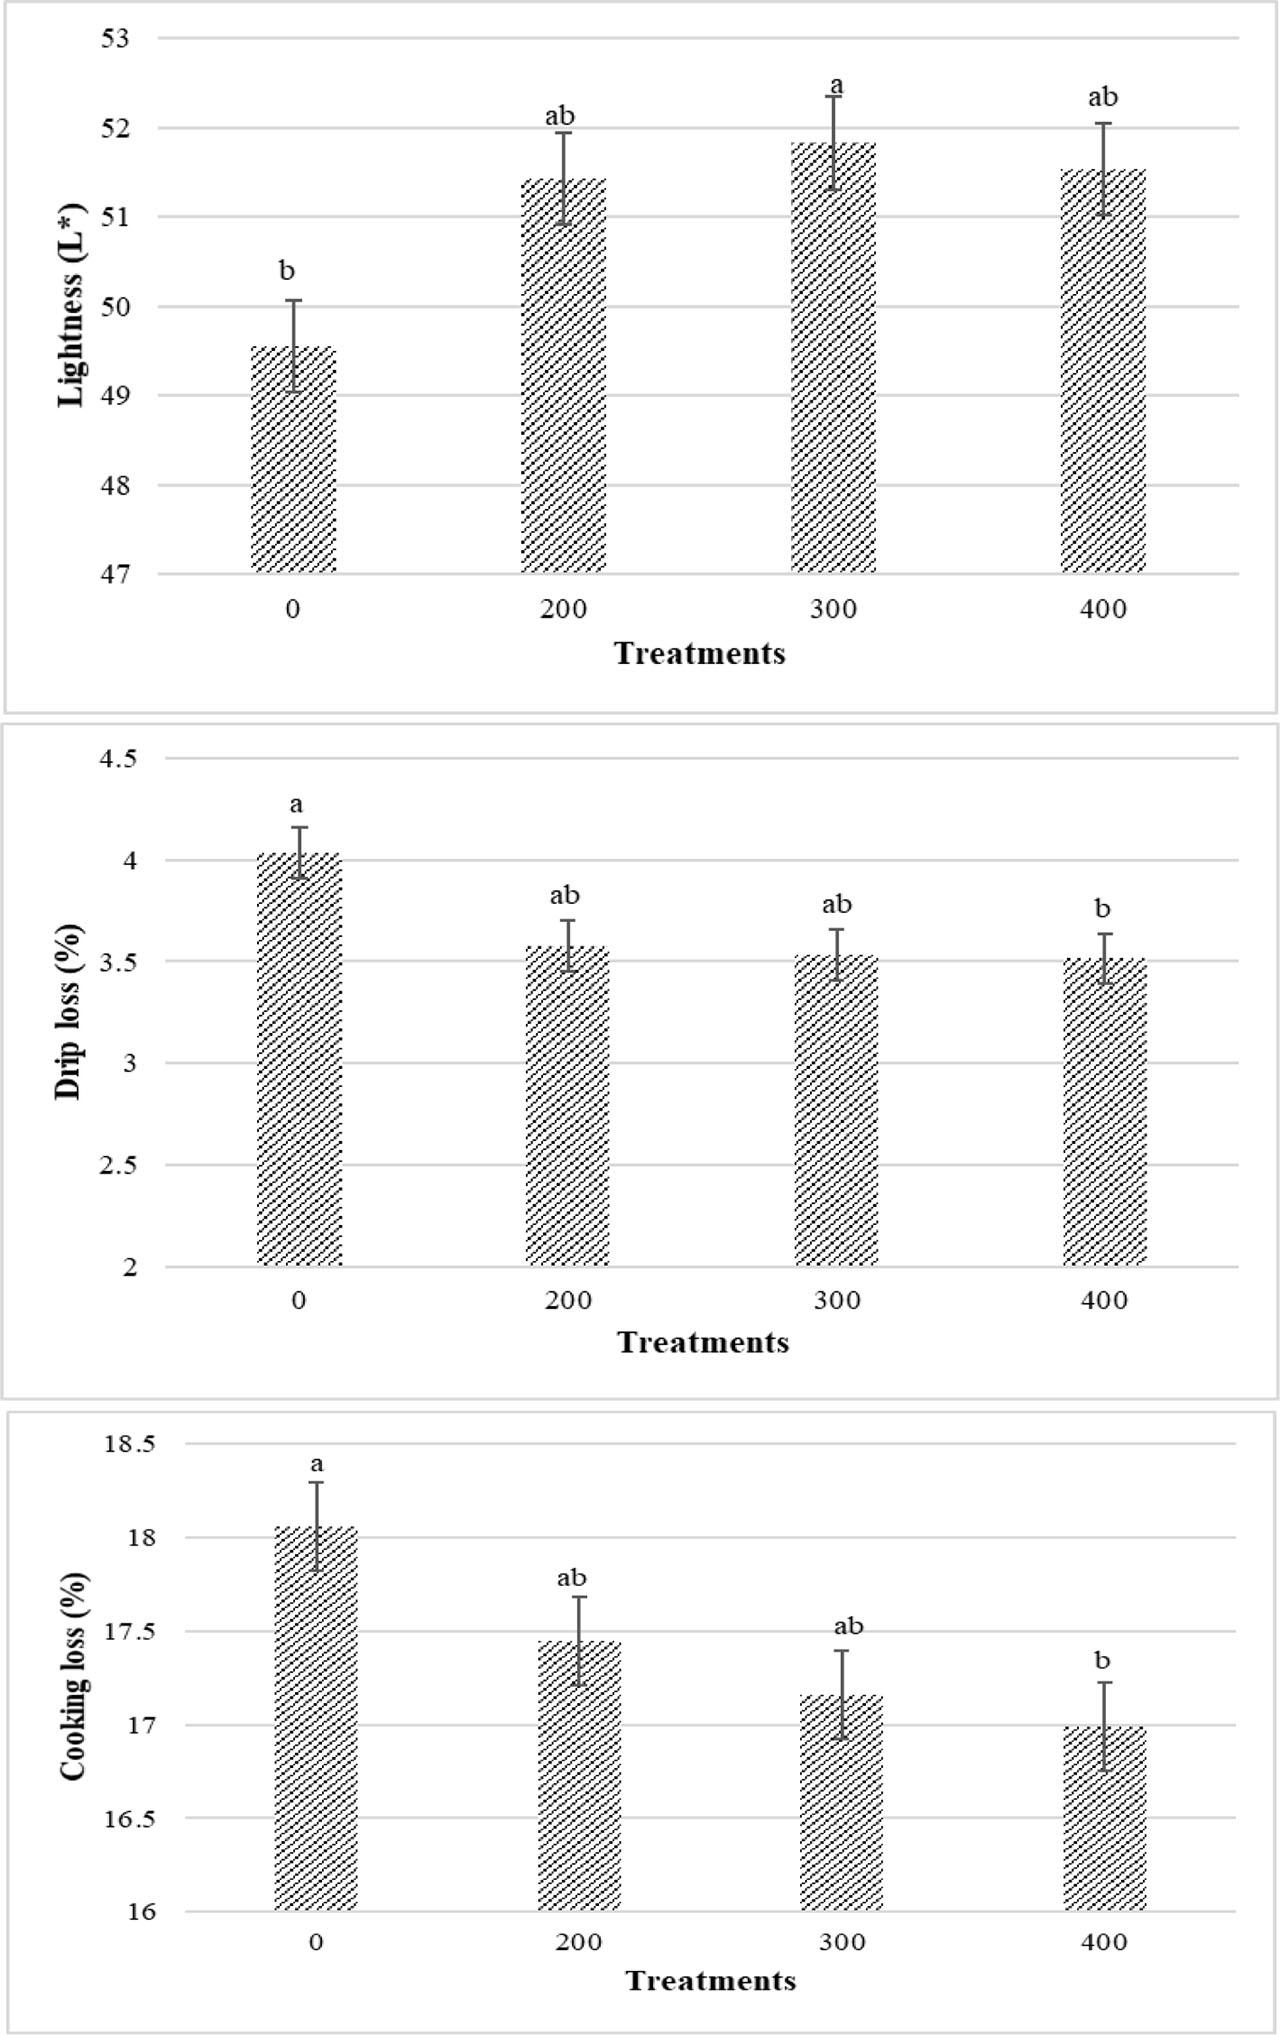
Figure 4.
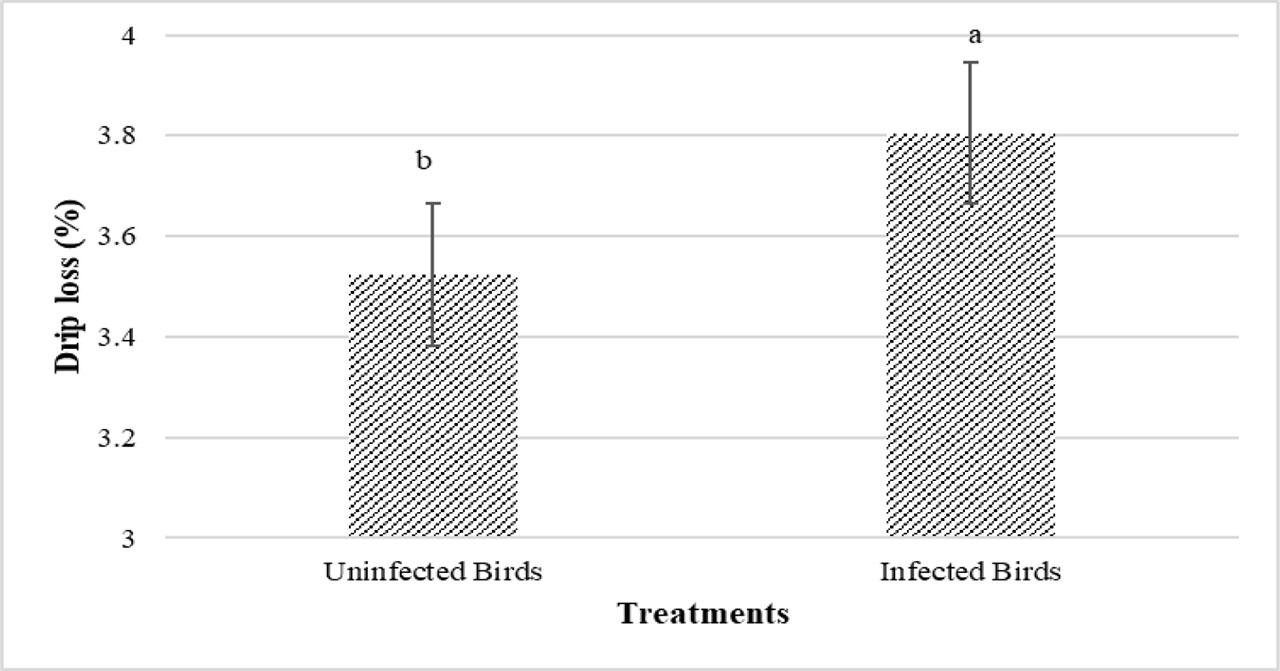
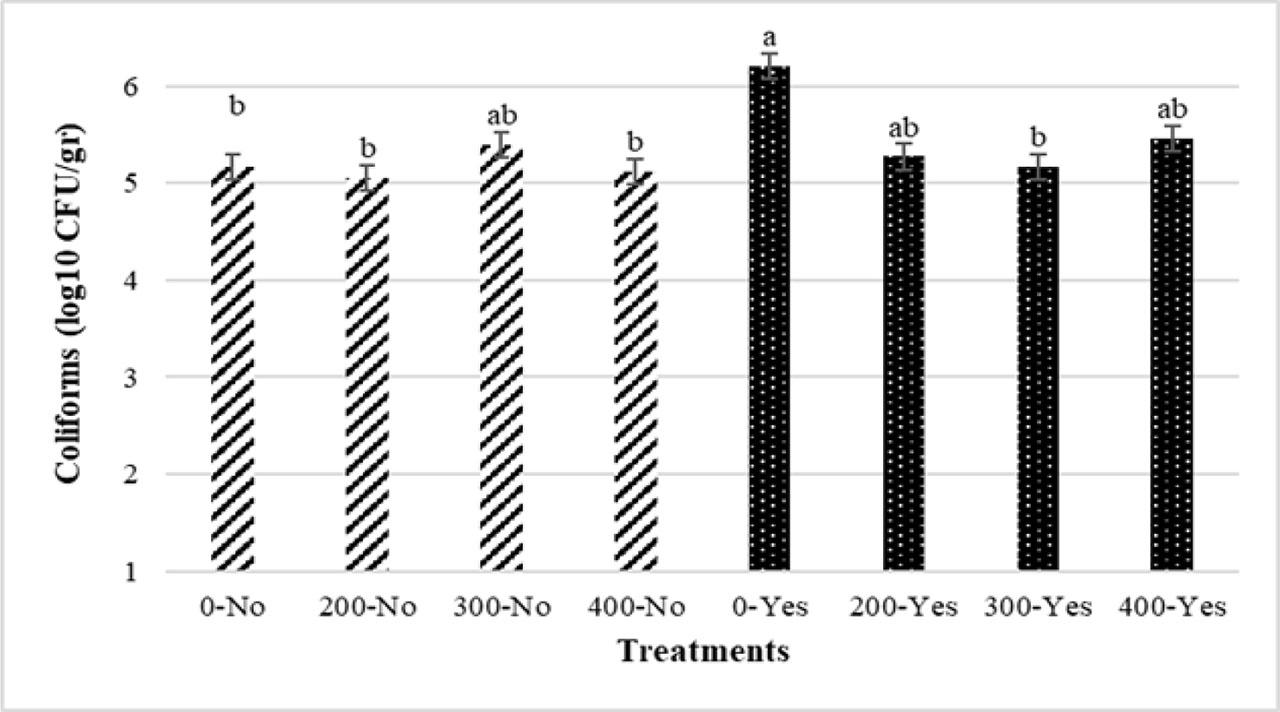
Figure 5.
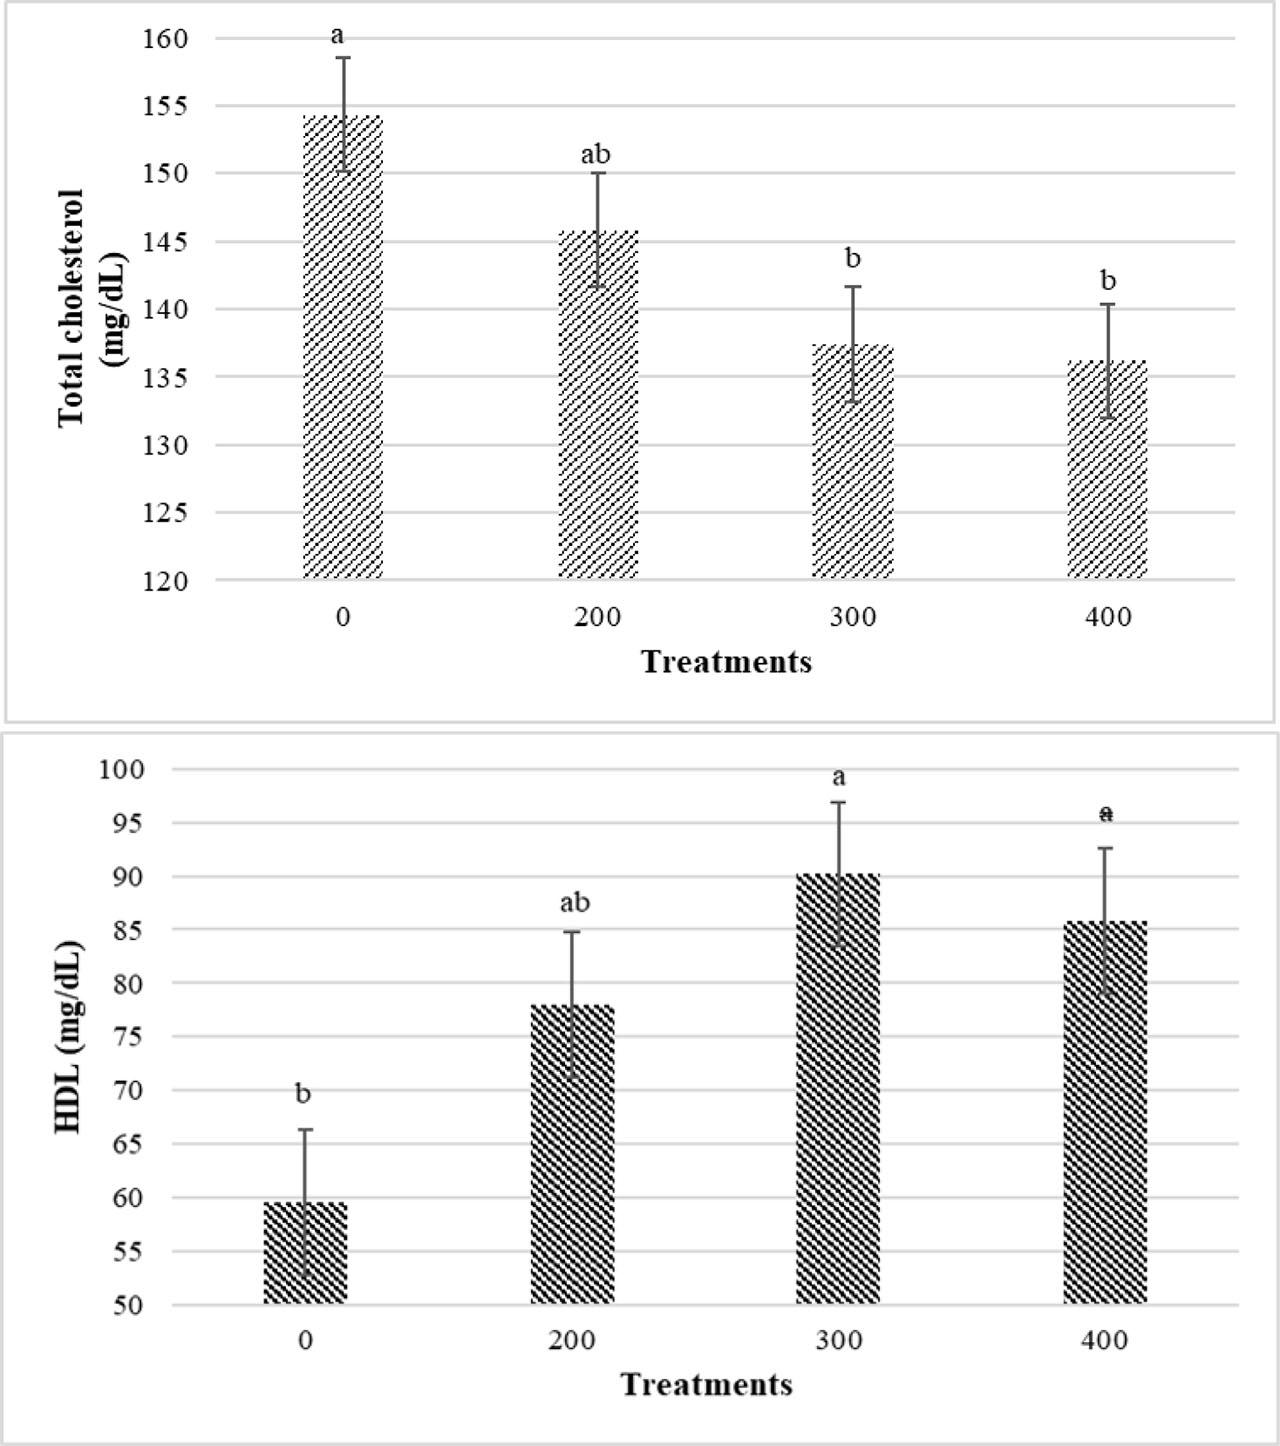
Figure 6.
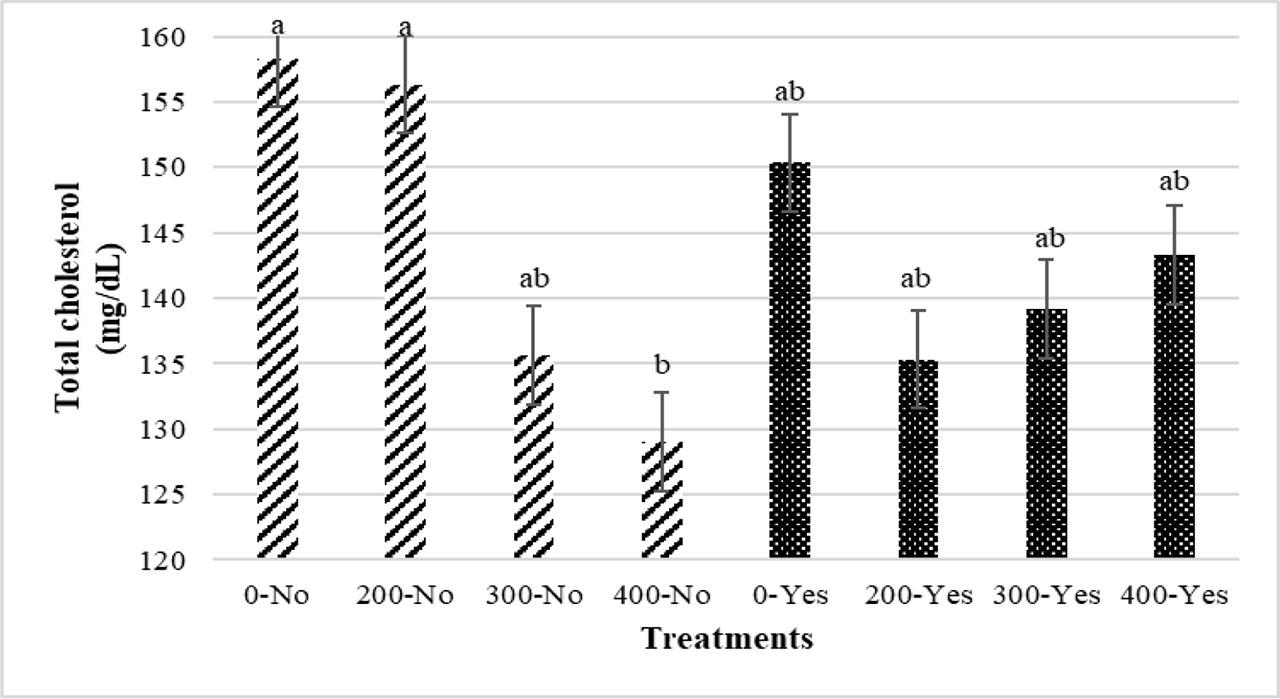
Figure 7.
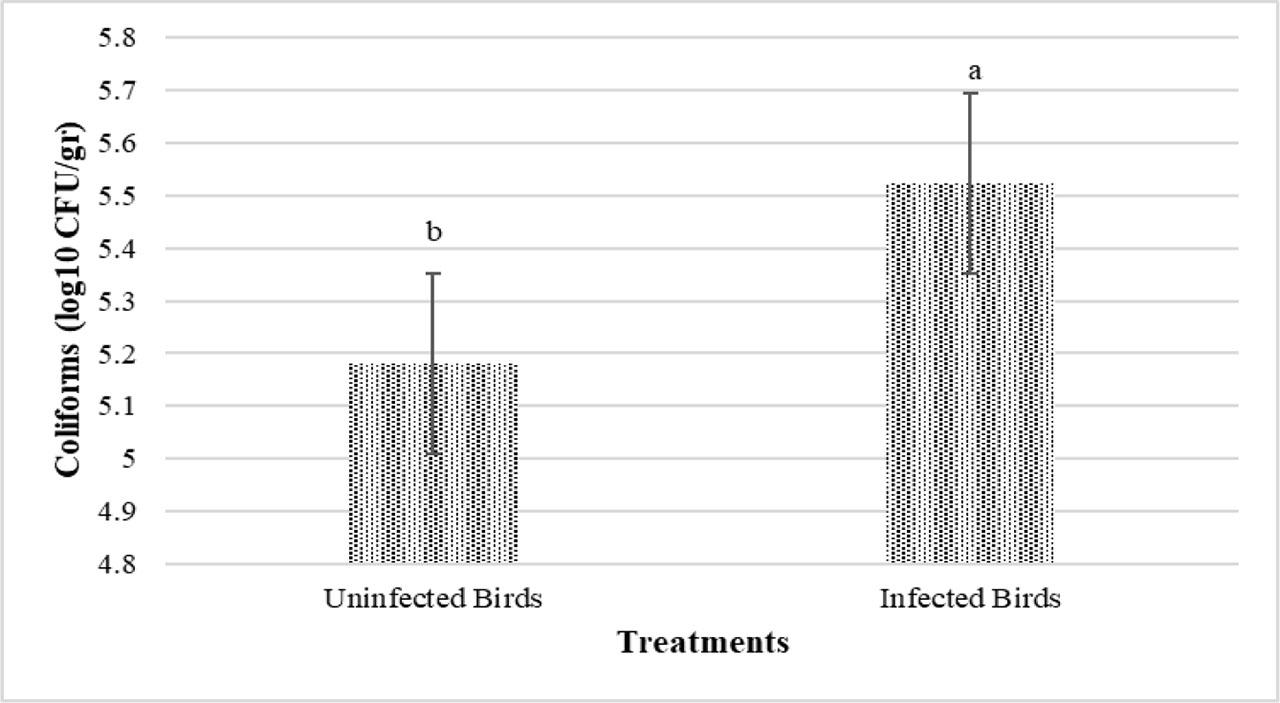
Figure 8.
Ingredients and nutrient composition of the experimental diets (as-fed basis)
| Ingredients (%) | Starter (1–10 d) | Grower (11–24 d) | Finisher (25–42 d) |
|---|---|---|---|
| Corn | 49.14 | 53.96 | 60.75 |
| Soybean meal (44%) | 42.23 | 38.08 | 32.12 |
| Soybean oil | 4.25 | 4.36 | 3.84 |
| Limestone | 0.97 | 0.72 | 0.67 |
| Dicalcium phosphate | 2.04 | 1.61 | 1.32 |
| Vitamin premix1 | 0.25 | 0.25 | 0.25 |
| Mineral premix2 | 0.25 | 0.25 | 0.25 |
| L-Lysine HCl | 0.07 | 0.02 | 0.07 |
| DL-Methionine | 0.29 | 0.24 | 0.23 |
| L-Threonine | 0.01 | - | - |
| Choline | 0.05 | 0.05 | 0.05 |
| Sodium Bicarbonate | 0.11 | 0.11 | 0.11 |
| Salt (NaCl) | 0.35 | 0.35 | 0.34 |
| Nutrient composition (%) | |||
| Metabolizable energy (kcal/kg) | 2975 | 3050 | 3100 |
| Crude protein | 23 | 21.50 | 19.50 |
| Lysine | 1.32 | 1.18 | 1.08 |
| Methionine + Cystine | 1.00 | 0.92 | 0.86 |
| Threonine | 0.88 | 0.80 | 0.72 |
| Calcium | 0.95 | 0.75 | 0.65 |
| Available Phosphorus | 0.50 | 0.42 | 0.36 |
| Sodium | 0.18 | 0.18 | 0.18 |
| Potassium | 0.99 | 0.92 | 0.82 |
| Chlorine | 0.26 | 0.25 | 0.26 |