
Table 1.
Composition and nutrient analysis of experimental diets (g/kg)
| Ingredient | Group I (control) | Group II | Group III |
|---|---|---|---|
| Wheat meal | 280 | 295 | 310 |
| Wheat bran | 100 | 100 | 100 |
| Corn meal | 150 | 150 | 150 |
| Sorghum meal | 100 | 100 | 100 |
| Dried greens | 50 | 50 | 50 |
| Soybean meal (extract) | 140 | 70 | 0 |
| Sunflower cake | 100 | 100 | 100 |
| Insect meal/larvae | 0 | 60 | 120 |
| Soy oil | 10 | 5 | 0 |
| Mineral-vitamin premix1 | 20 | 20 | 20 |
| Limestone | 50 | 50 | 50 |
| Nutrient composition | |||
| Crude protein | 175 | 176 | 178 |
| Crude fat | 15 | 12 | 10 |
| Crude fiber | 100 | 100 | 100 |
| Ash | 45 | 46 | 46 |
| Calcium | 35 | 35 | 35 |
| Total phosphorus | 5.5 | 5.4 | 5.3 |
| Chitin | 0 | 3.9 | 7.8 |
| Lysine | 3.88 | 3.75 | 3.63 |
| Methionine | 0.86 | 0.95 | 1.05 |
| Threonine | 2.40 | 2.52 | 2.64 |
| Tryptophan | 0.80 | 0.66 | 0.52 |
| Valine | 2.58 | 2.74 | 2.90 |
| Arginine | 4.68 | 3.95 | 3.23 |
| Metabolizable energy2 (MJ/kg) | 11.43 | 11.45 | 11.47 |
1 Each 1 kilogram of the vitamin–mineral premix contained the following: 10,000 IU of vitamin A (retinol), 2,500 IU of vitamin D, 20 mg of vitamin E (α-tocopherol), 0.5 mg of thiamine, 5.0 mg of riboflavin, 20.0 mg of niacinamide, 1.0 mg of pyridoxine, 0.02 mg of cobalamin, 0.5 mg of folic acid, 7.0 mg of pantothenic acid, 2.5 mg of menadione, 300 mg of choline chloride, 45 mg of iron (Fe), 60 mg of manganese (Mg), 50 mg of zinc (Zn), 0.25 mg of selenium (Se), and 1.3 mg of iodine (I). IM refers to insect meal.
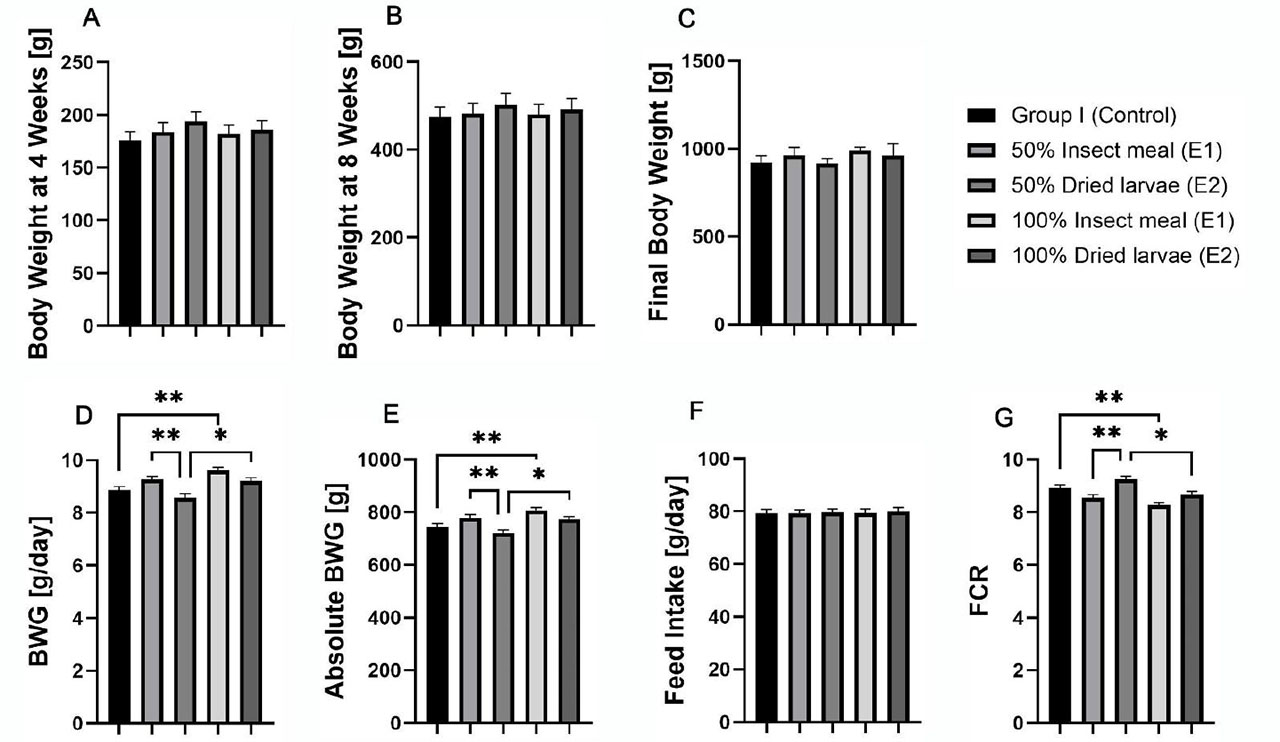
Figure 1.
Analysis of differences in production performance parameters of female common pheasant at 16 weeks of age between the control group (group I), group II (E1-50% insect meal, E1-100% dried larvae) and group III (E2-50% insect meal, E2-100% dried larvae): (A) body weight at 4 weeks age, (B) body weight at 8 weeks of age, (C) final body weight at 16 weeks of age, (D) daily body weight gain, (E) absolute body weight gain at 16 weeks of age, (F) daily feed intake, (G) feed conversion ratio. Asterisks (*) indicate significant differences between groups (*P<0.05, **P<0.01)
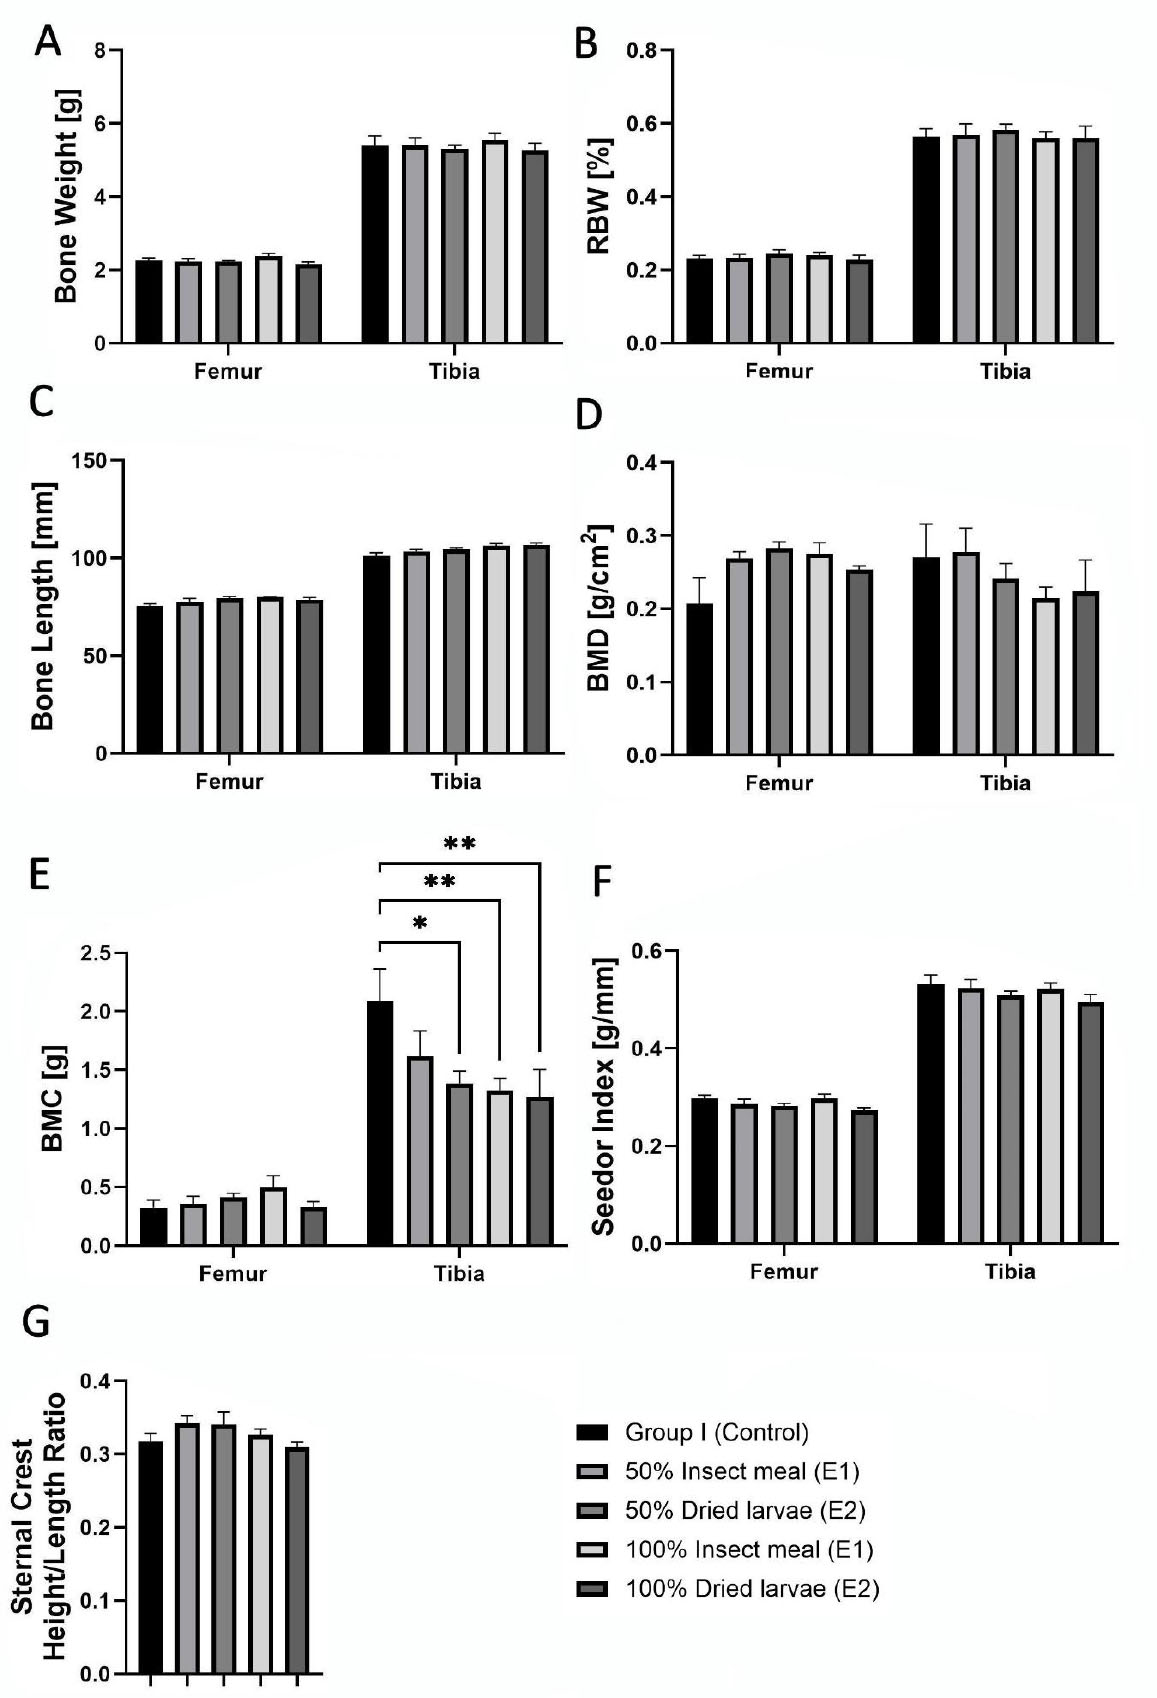
Figure 2.
Analysis of differences in femur and tibia bone properties of female common pheasant at 16 weeks of age between the control group (group I), group II (E1-50% insect meal, E1-100% dried larvae) and group III (E2-50% insect meal, E2-100% dried larvae):(A) bone weight, (B) relative bone weight, (C) bone length, (D) bone mineral density, (E) bone mineral content, (F) Seedor index, (G) sternal crest height to sternum length ratio. Asterisks (*) indicate significant differences between groups (*P<0.05, **P<0.01)
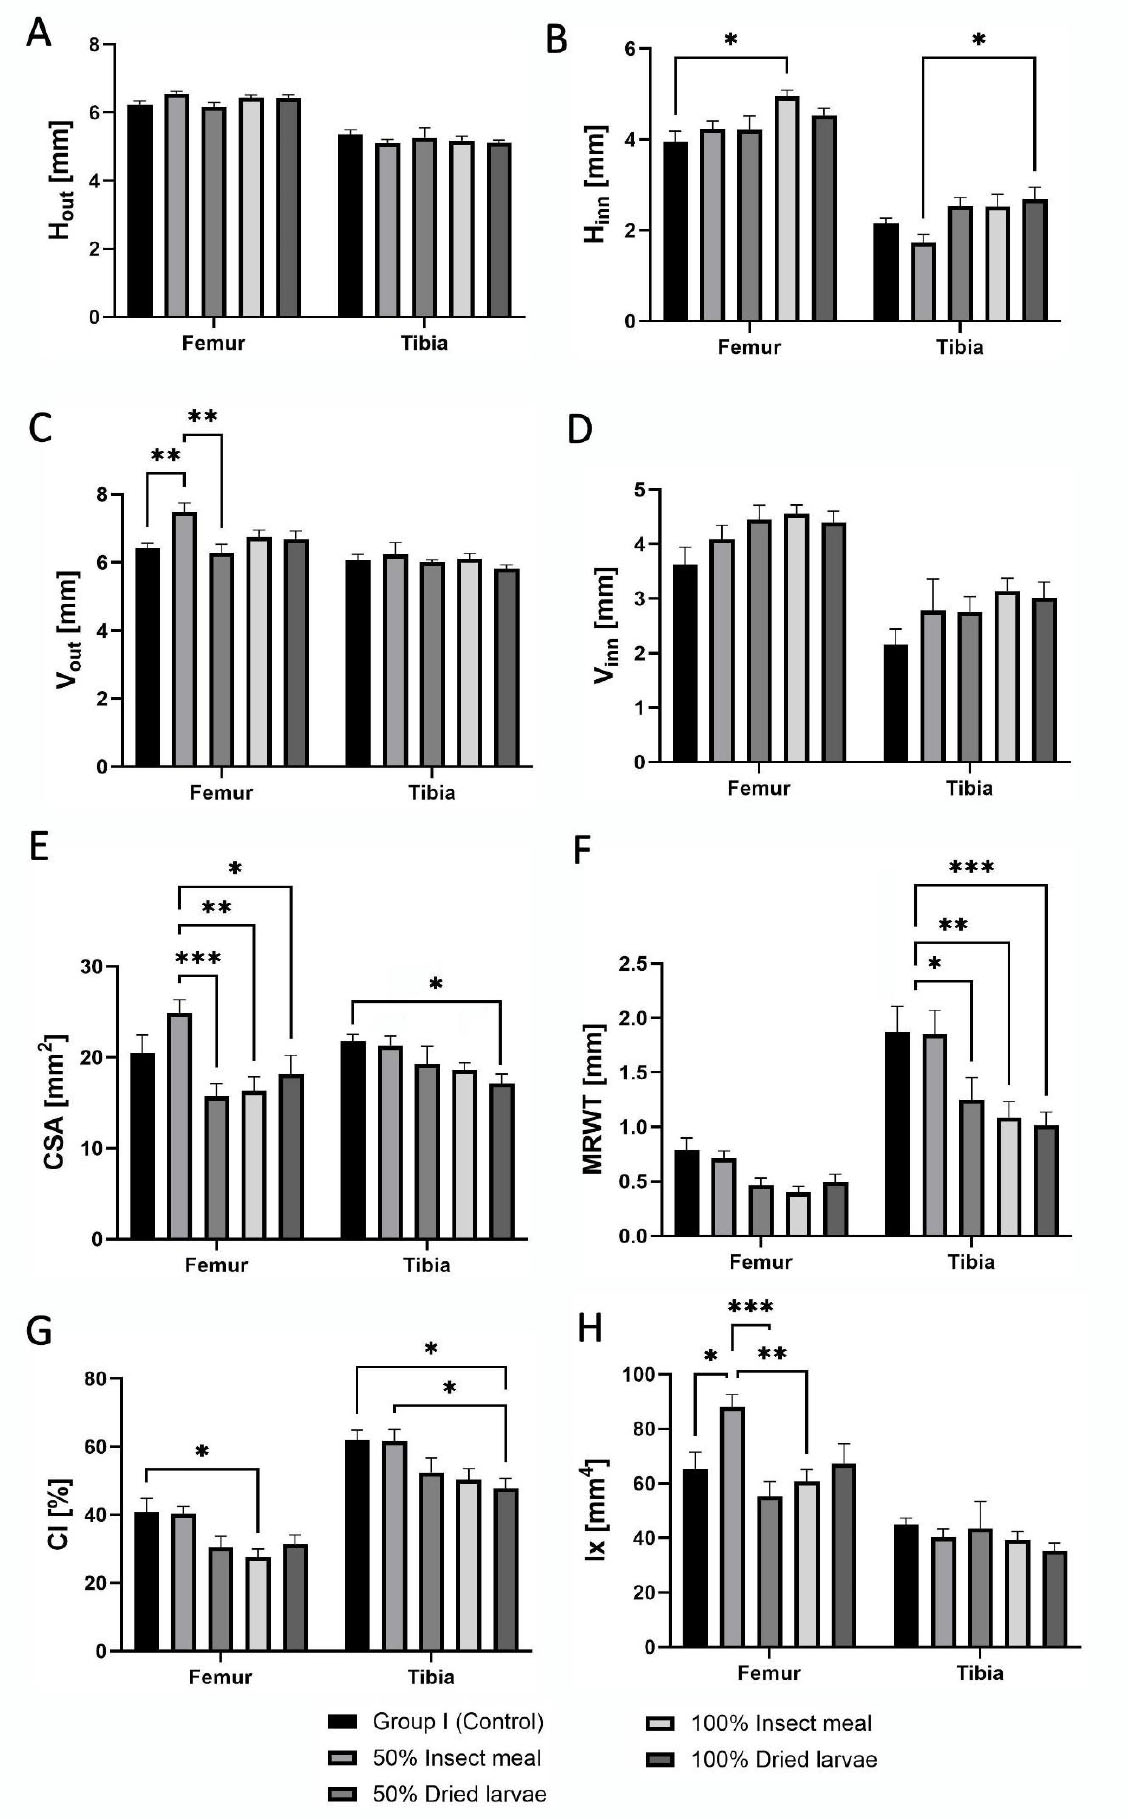
Figure 3.
Analysis of differences in femur and tibia geometrical properties of female common pheasant at 16 weeks of age between the control group (group I), group II (E1-50% insect meal, E1-100% dried larvae) and group III (E2-50% insect meal, E2-100% dried larvae): (A) transversal outer diameter, (B) transversal inner diameter, (C) anteroposterior outer diameter, (D) anteroposterior inner diameter, (E) mid-diaphysis cross-sectional area, (F) mean relative wall thickness, (G) cortical index, (H) cross-sectional moment of inertia. Asterisks (*) indicate significant differences between groups (*P<0.05, **P<0.01, ***P<0.001)
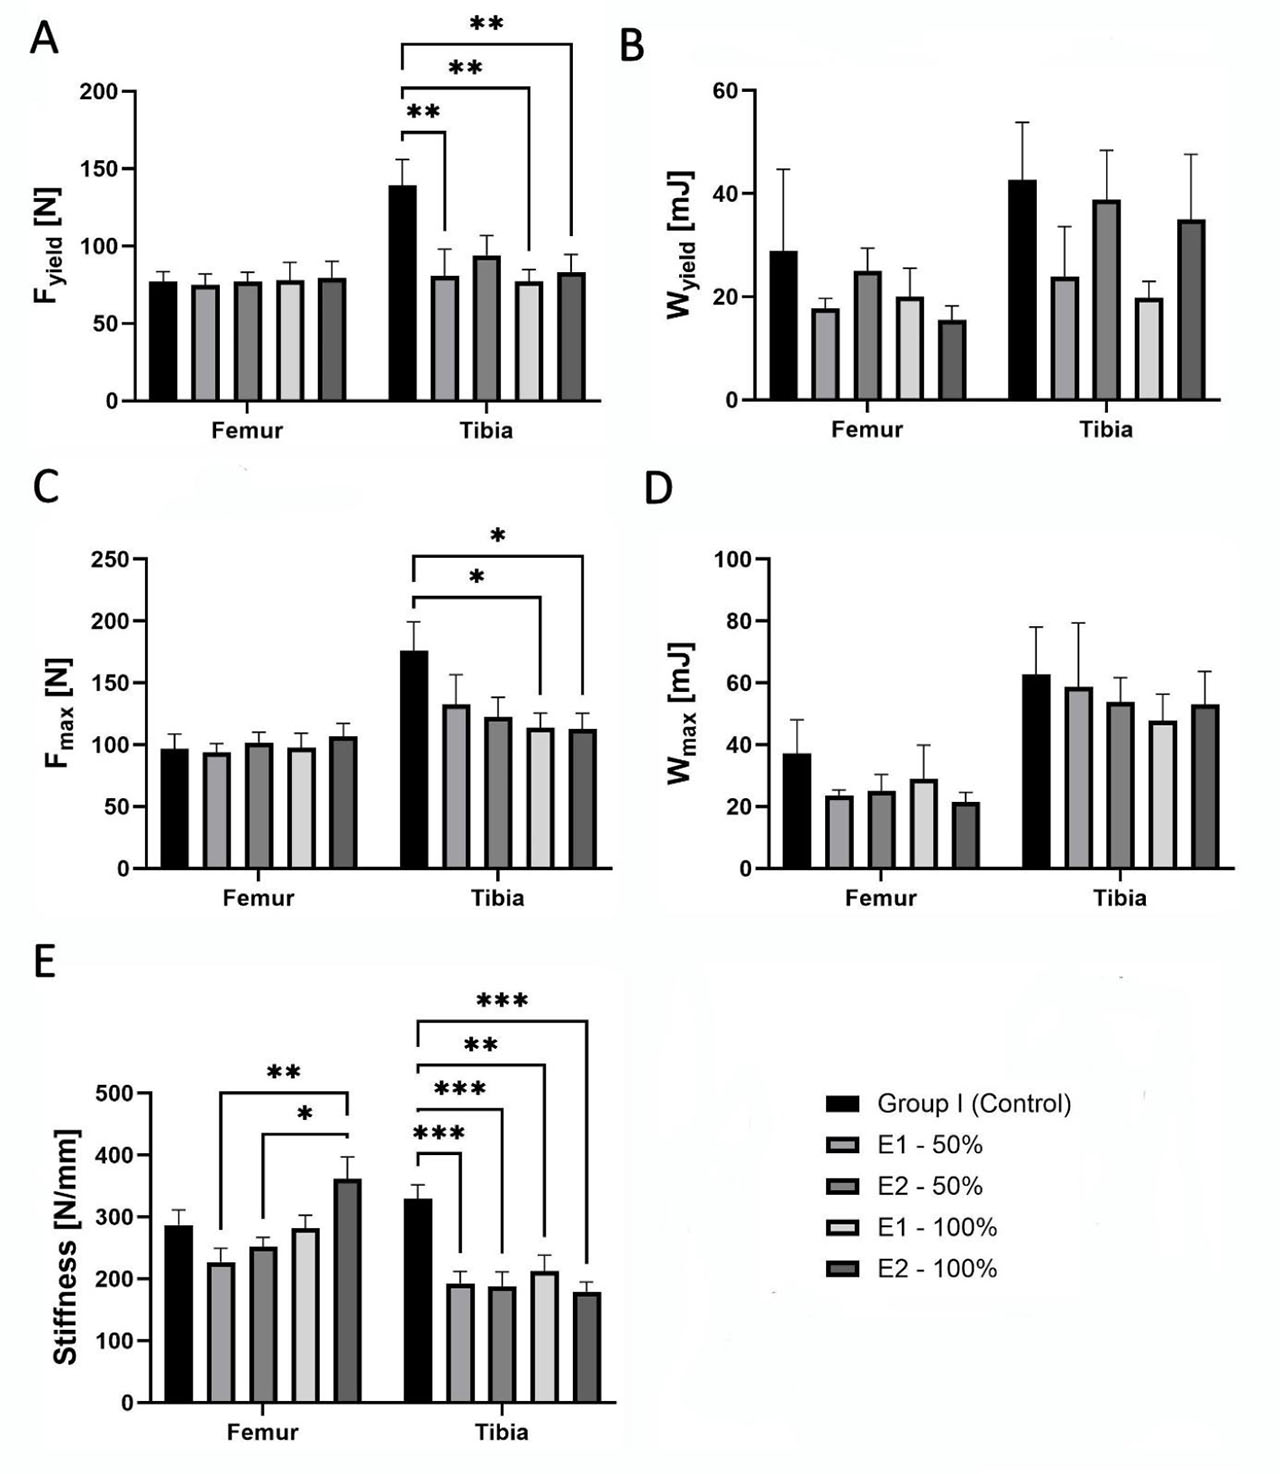
Figure 4.
Analysis of differences in femur and tibia mechanical properties of female common pheasant at 16 weeks of age between the control group (group I), group II (E1-50% insect meal, E1-100% dried larvae) and group III (E2-50% insect meal, E2-100% dried larvae): (A) yield force, (B) elastic work, (C) breaking force, (D) breaking work, (E) stiffness. Asterisks (*) indicate significant differences between groups (*P<0.05, **P<0.01, ***P<0.001)
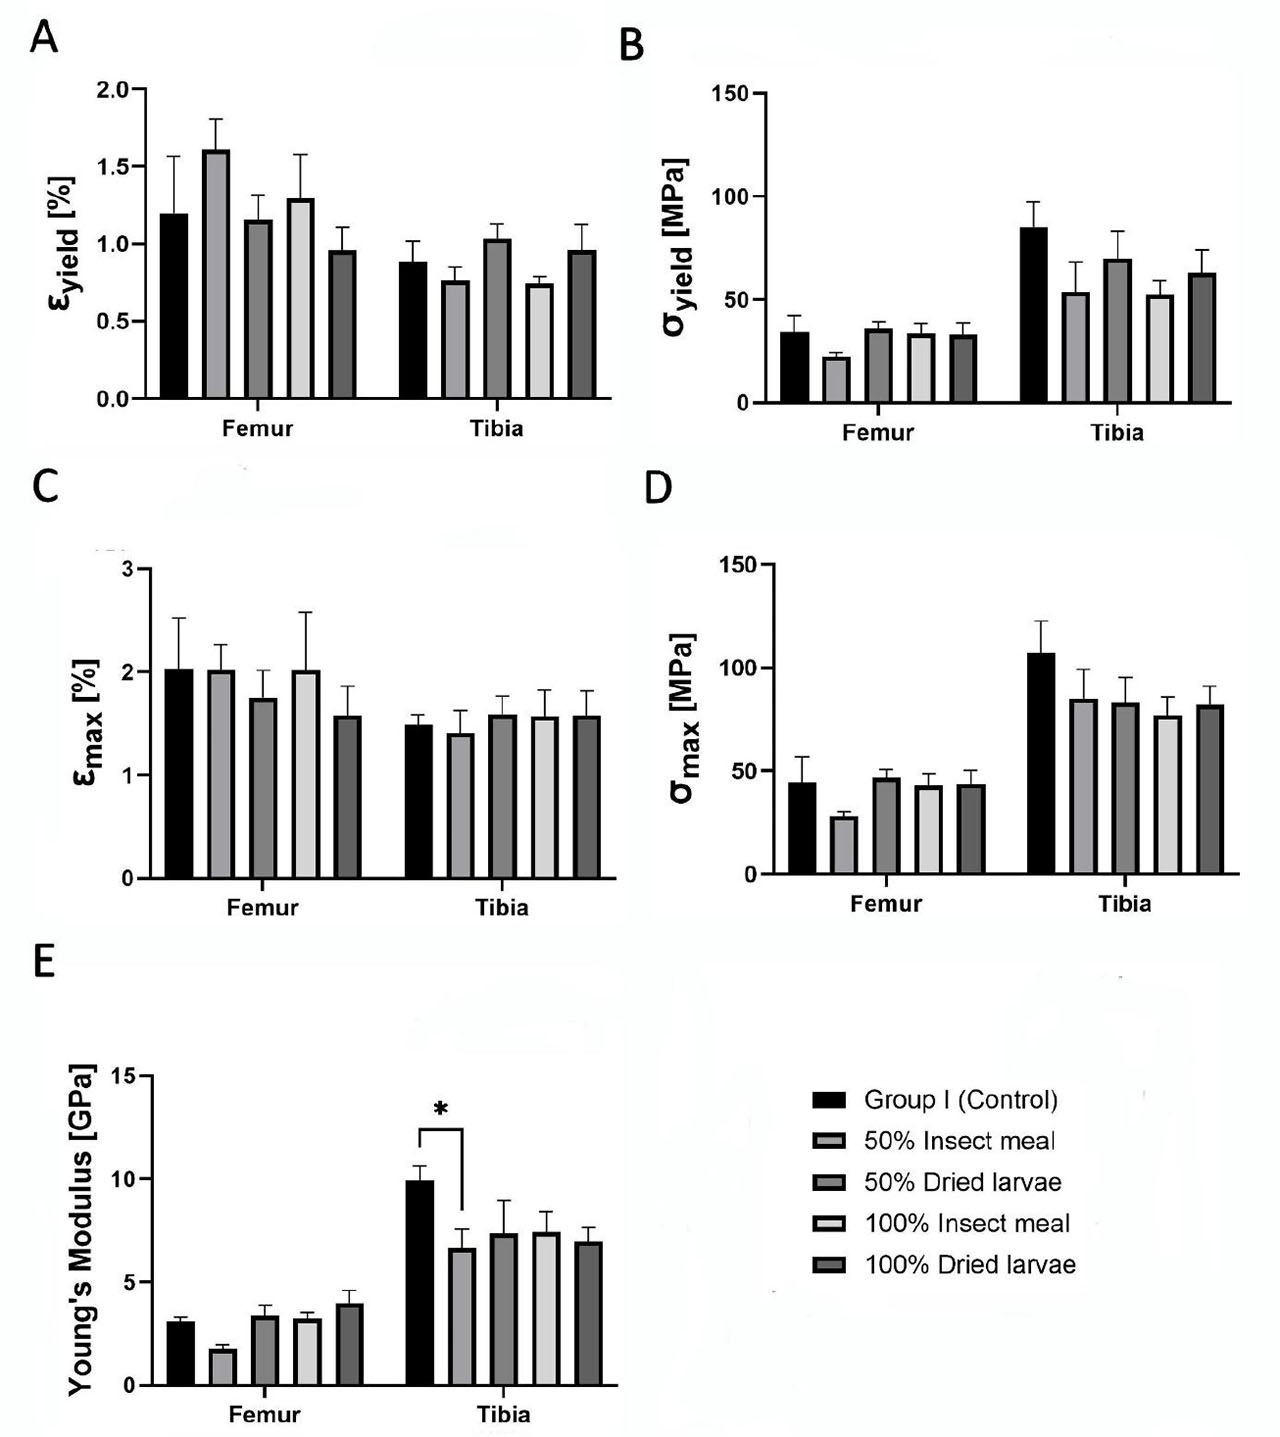
Figure 5.
Analysis of differences in femur and tibia bone material properties of female common pheasant at 16 weeks of age between the control group (group I), group II (E1-50% insect meal, E1-100% dried larvae) and group III (E2-50% insect meal, E2-100% dried larvae): (A) yield strain, (B) yield stress, (C) breaking strain, (D) breaking stress, (E) Young’s modulus. Asterisks (*) indicate significant differences between groups (*P<0.05)