
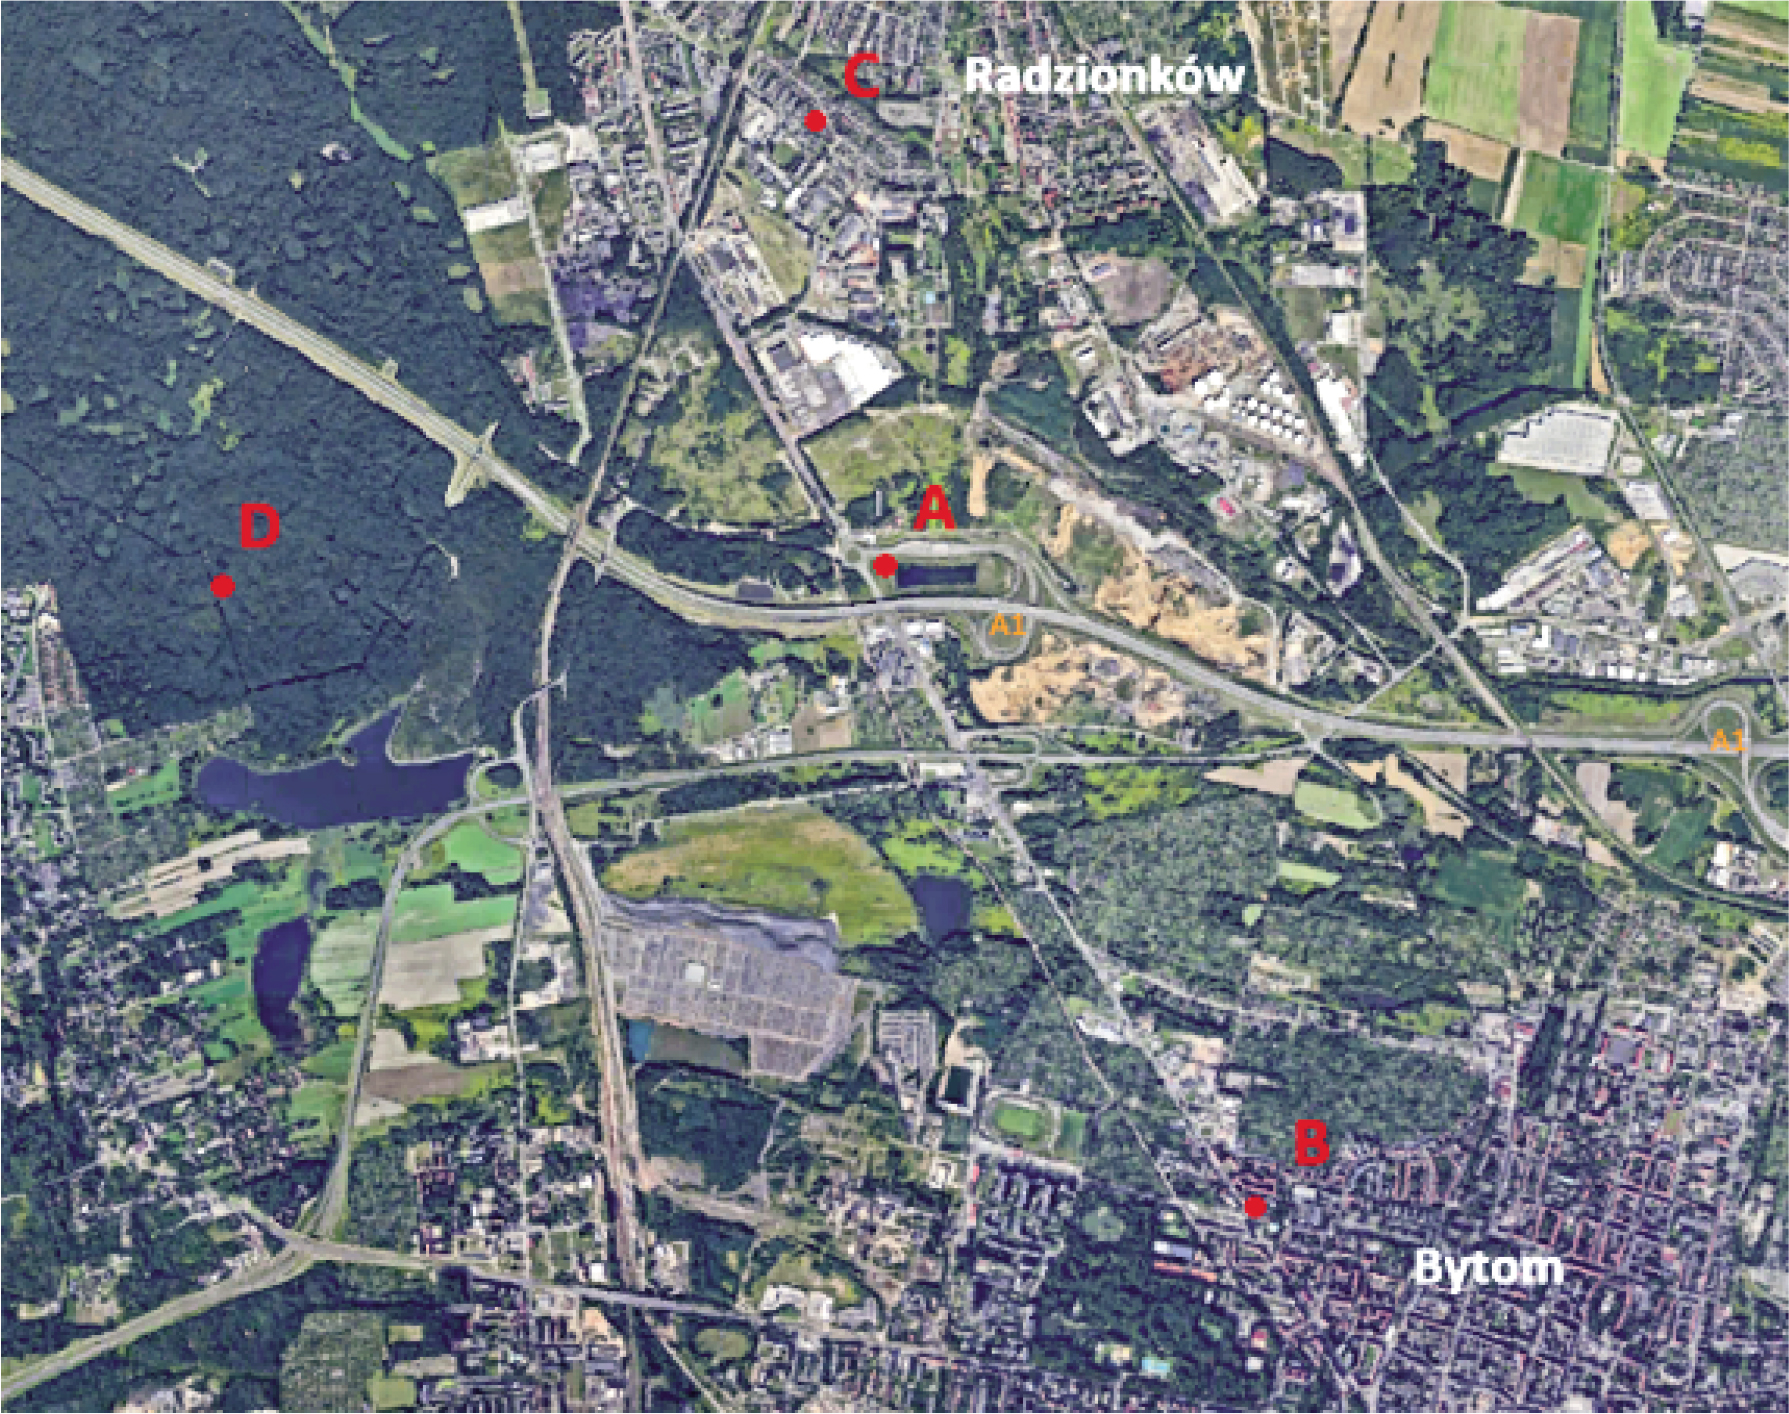
Figure 2.1.
Map of the area with marked dandelion sampling locations
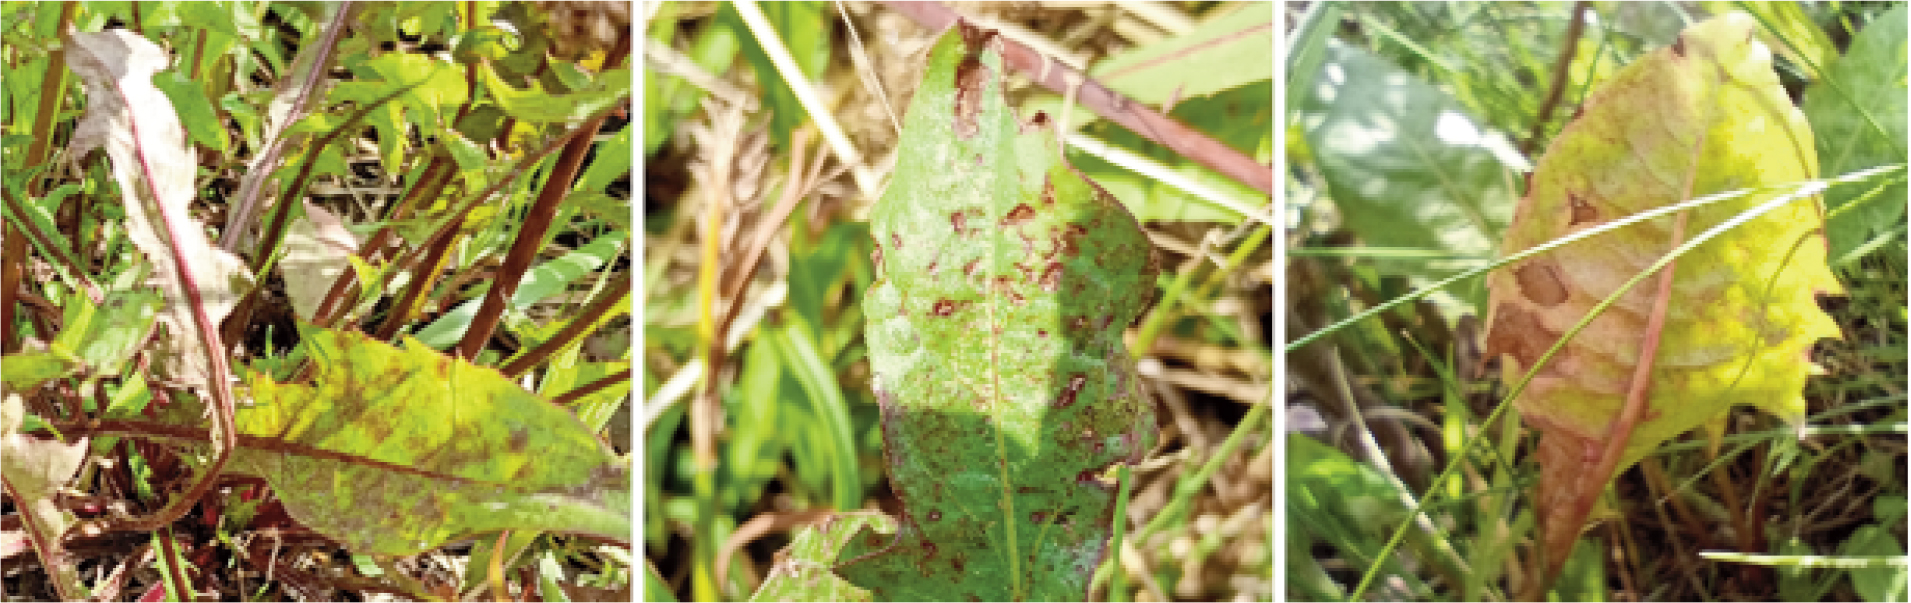
Figure 2.2.
Visible discolorations, deformations, and necrotic changes on the leaves of plants from the highway area
Table 2.1.
Average resoults of heavy metal contents analysis in dandelion biomass, with corresponding standard deviations
| Group | Element share, mg/kg | ||||||||
|---|---|---|---|---|---|---|---|---|---|
| Fe | Zn | Pb | Cd | Mn | Cu | Cr | Ni | Co | |
| A | 4105 ± 77 | 1352 ± 30 | 255 ± 11 | 12 ± 0,3 | 279 ± 11 | 41 ± 3 | 39 ± 3 | 28 ± 3 | 5 ± 0,5 |
| B | 2664 ± 46 | 877 ± 22 | 177 ± 7 | 8 ± 0,3 | 143 ± 6 | 38 ± 4 | 33 ± 4 | 26 ± 2 | 5 ± 0,5 |
| C | 1665 ± 42 | 418 ± 21 | 77 ± 5 | 3 ± 0,3 | 97 ± 6 | 35 ± 4 | 39 ± 2 | 28 ± 1 | 3 ± 0,5 |
| D | 917 ± 33 | 304 ± 17 | 34 ± 6 | < 0,1 ± 0 | 71 ± 5 | 38 ± 4 | 28 ± 4 | 21 ± 1 | 1 ± 0,5 |
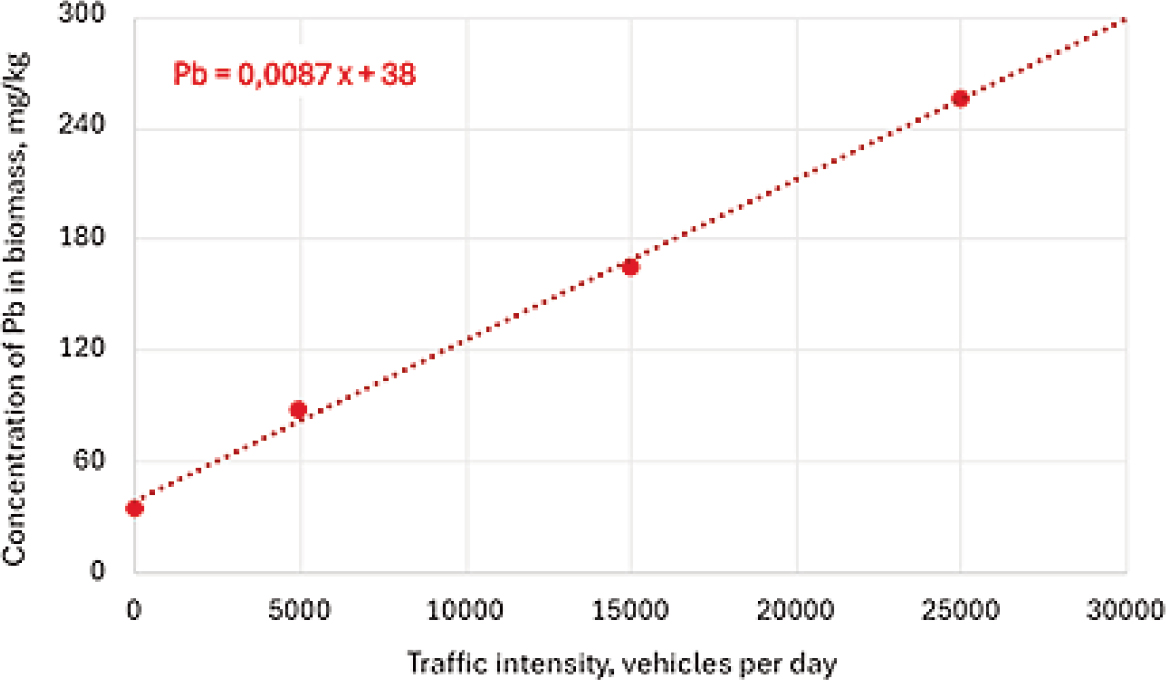
Figure 3.1
Dependence of lead (Pb) content in dandelion biomass on traffic intensity
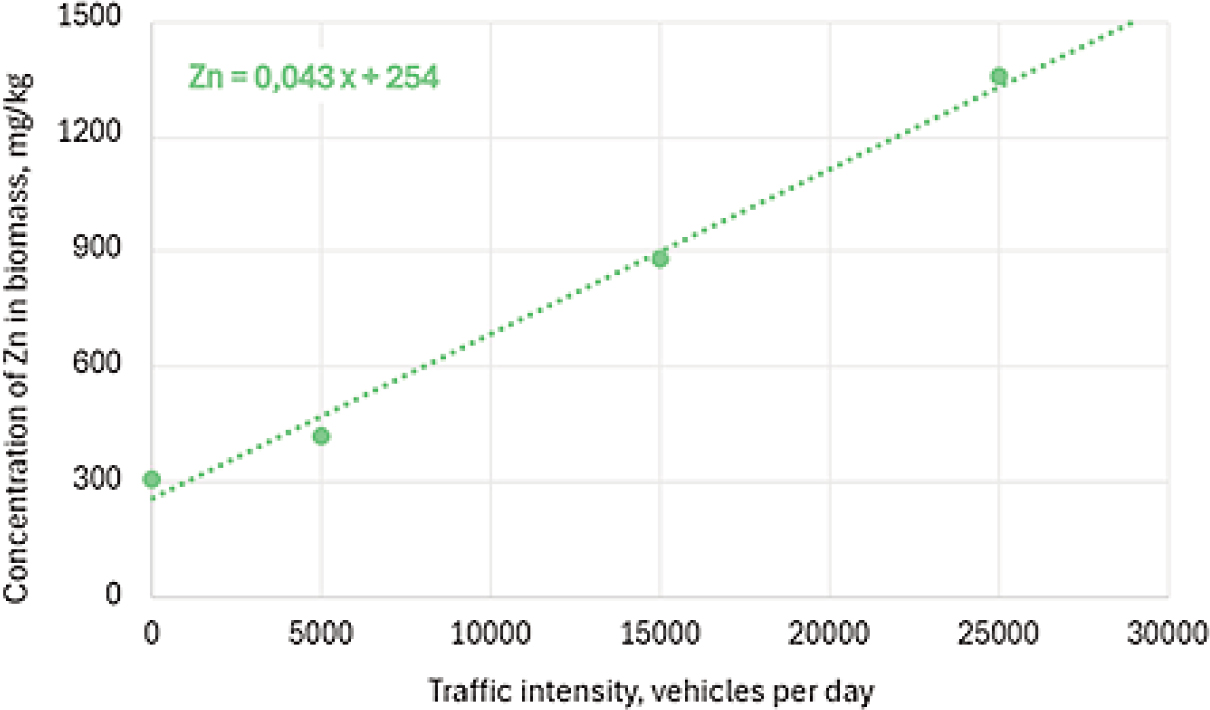
Figure 3.2
Dependence of zinc (Zn) content in dandelion biomass on traffic intensity
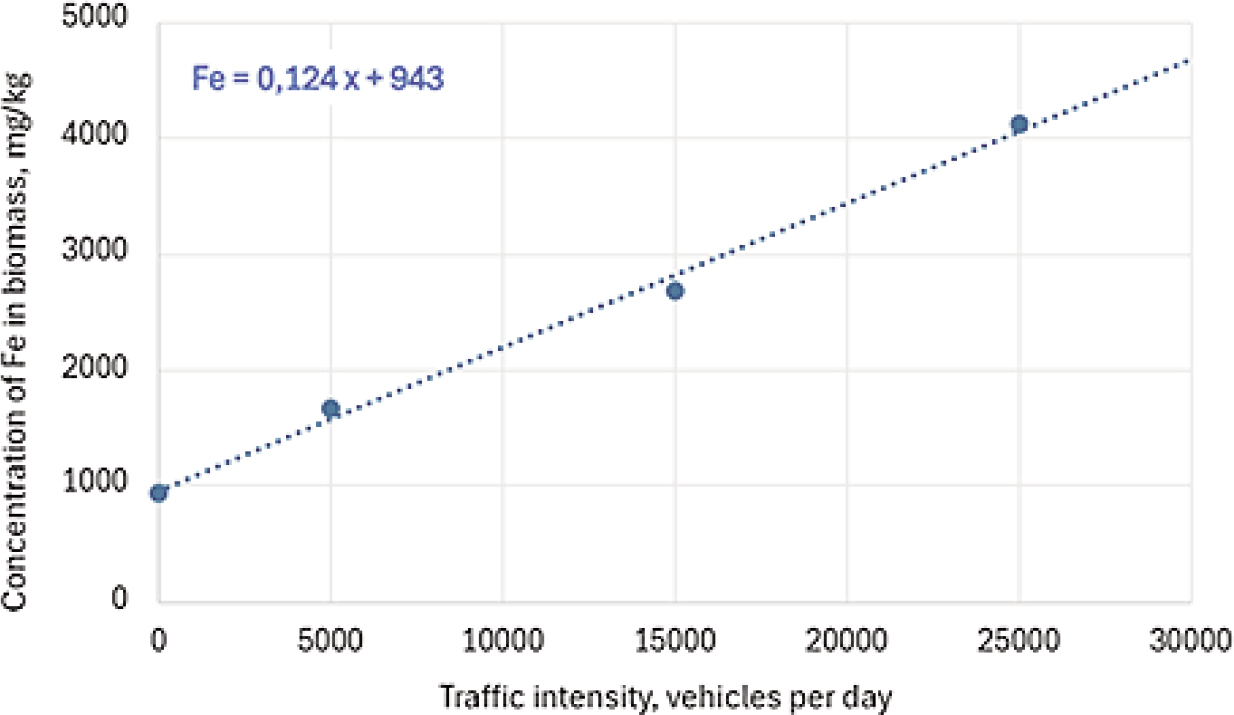
Figure 3.3
Dependence of iron (Fe) content in dandelion biomass on traffic intensity
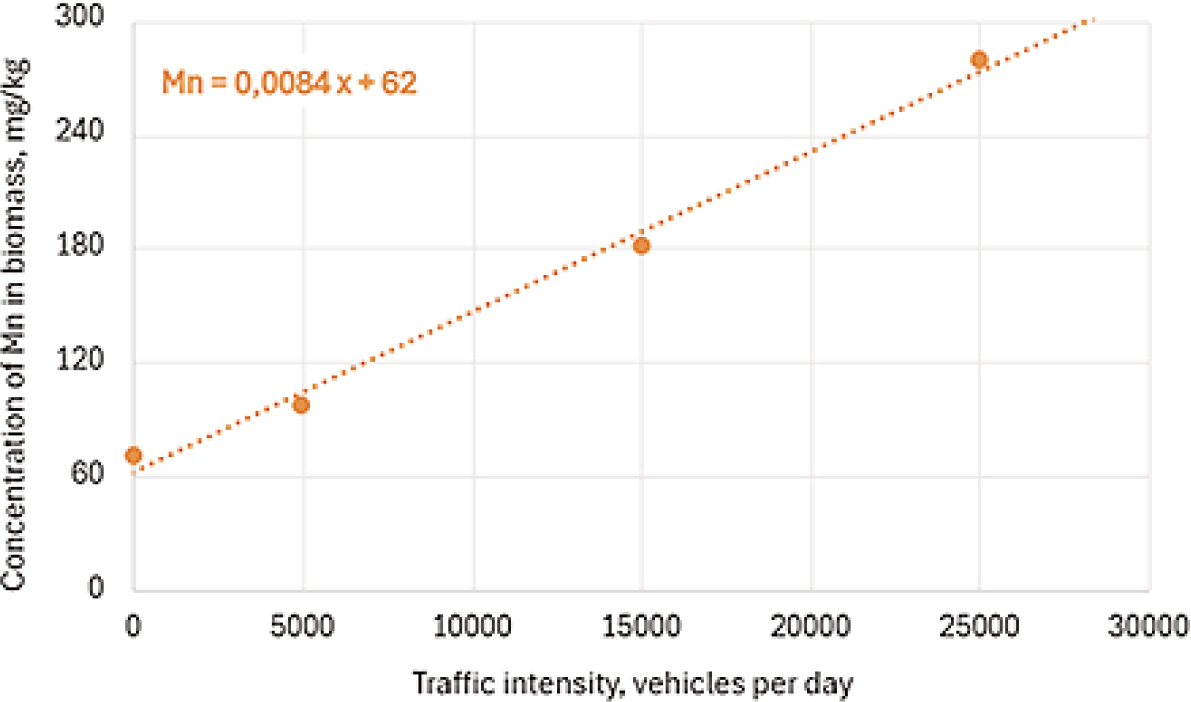
Figure 3.4
Dependence of manganese (Mn) content in dandelion biomass on traffic intensity
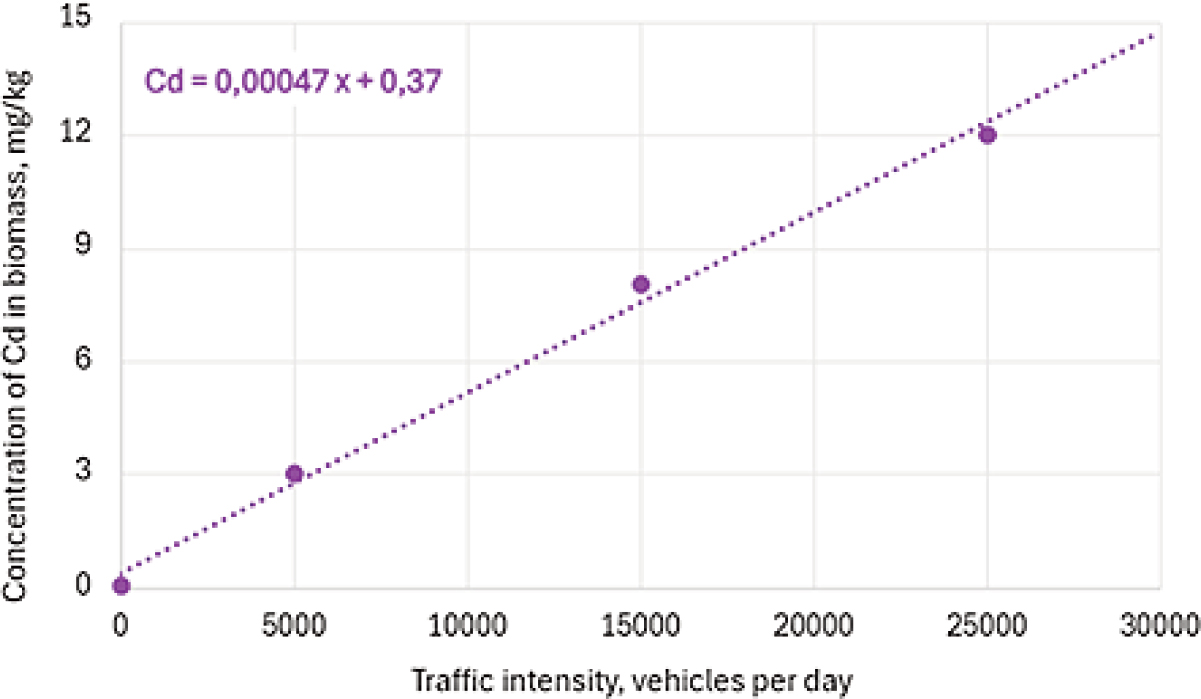
Figure 3.5
Dependence of cadmium (Cd) content in dandelion biomass on traffic intensity