
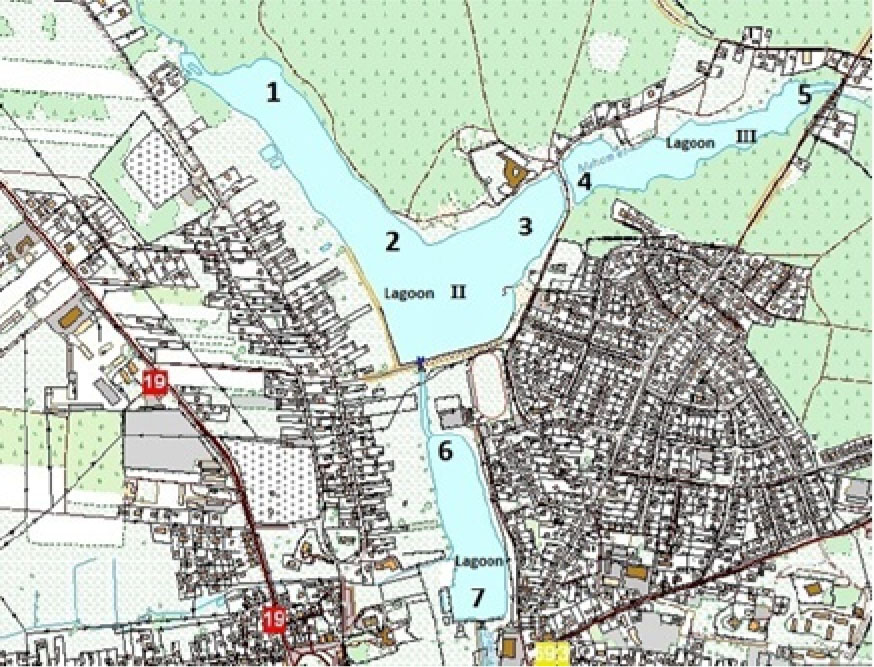
Figure 2.1.
Map with the location of measurement and control points [21]
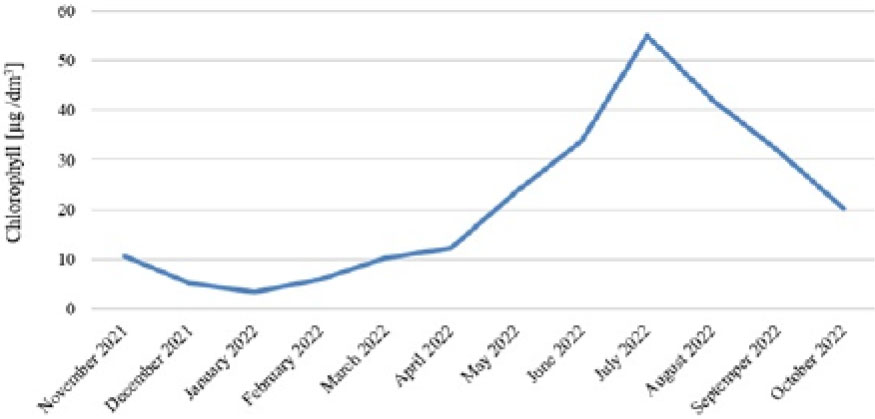
Figure 3.1.
Changes in chlorophyll a concentration in a given hydrological year
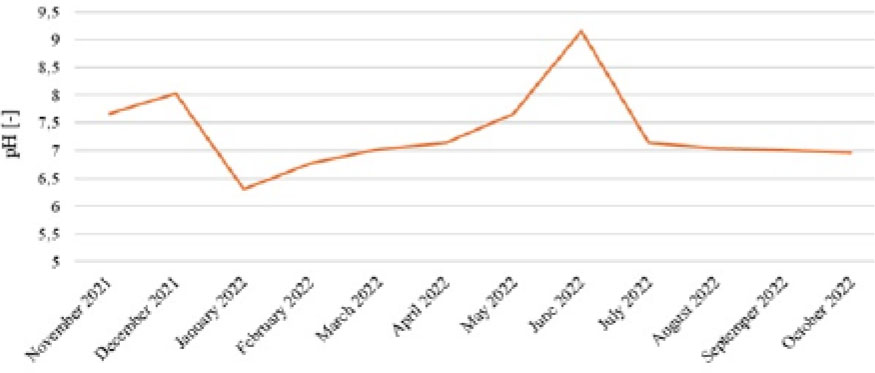
Figure 3.1.
Changes in chlorophyll a concentration in a given hydrological year
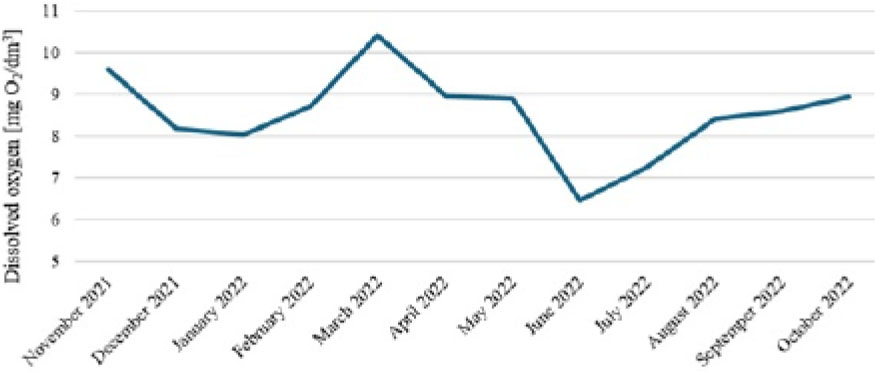
Figure 3.3.
Changes in dissolved oxygen concentration in a given hydrological year
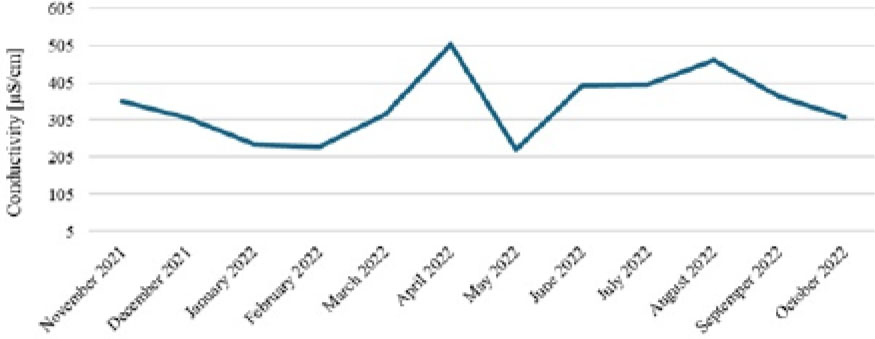
Figure 3.4.
Changes in conductivity in a given hydrological year
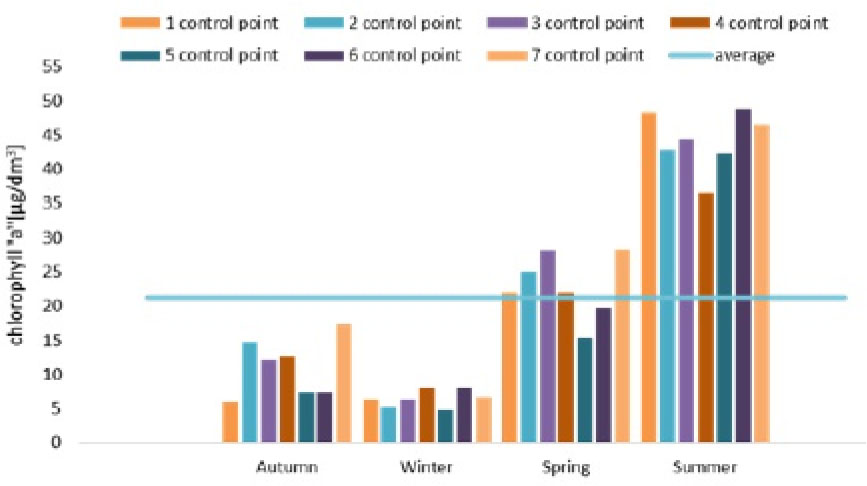
Figure 3.5.
Seasonal changes in the content of chlorophyll “a” in the water of the reservoir Siemiatycze
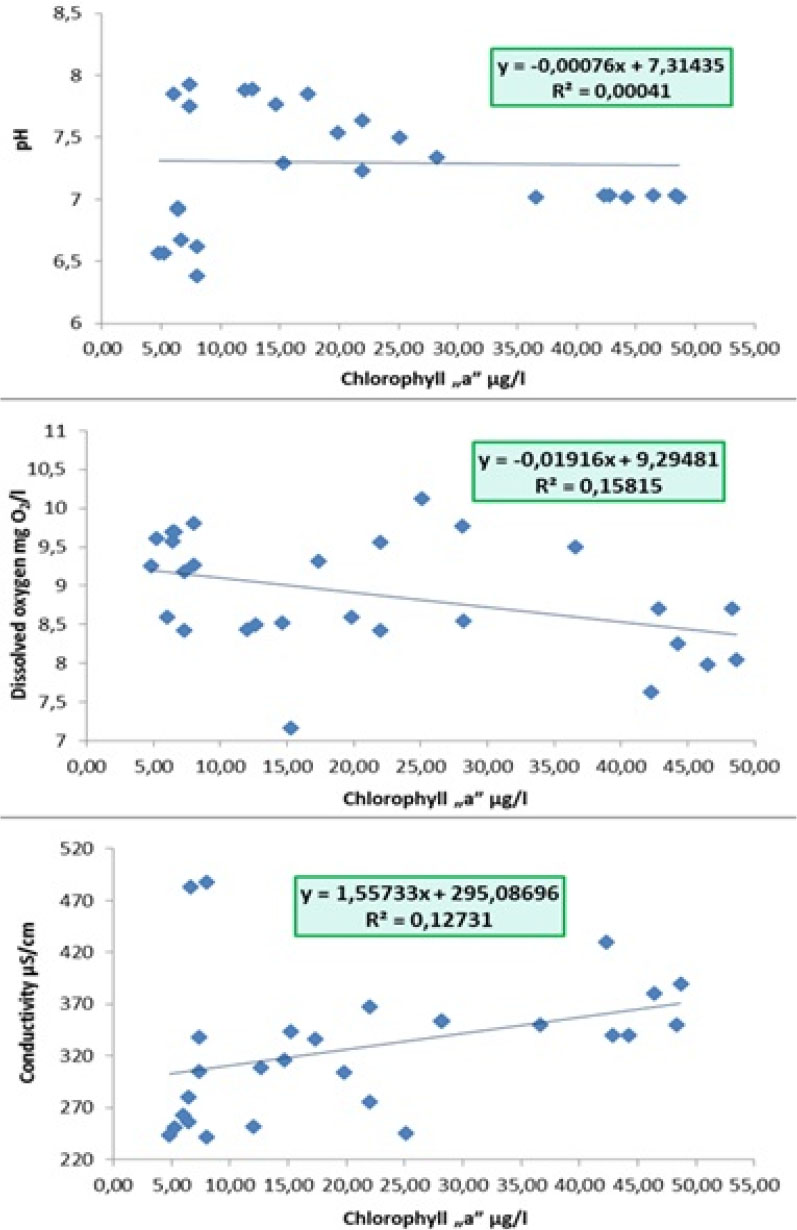
Figure 3.6.
Dependency of pH, dissolved oxygen and the concentration of the conductivity of chlorophyll “a”
Table 3.1.
The results of the markings in the Siemiatycze reservoir in ???
| Designation [unit] | Season | All measurement and control points | |||||
|---|---|---|---|---|---|---|---|
| Value | Median | Standard deviation | Statistical error | ||||
| minimum | average | maximum | |||||
| Chlorophyll [µg /dm3] | Autumn | 5.23 | 11.06 | 19.61 | 10.74 | 4.40 | 1.18 |
| Winter | 3.51 | 6.50 | 10.17 | 5.98 | 2.19 | 0.59 | |
| Spring | 12.21 | 22.92 | 33.87 | 23.63 | 5.72 | 1.53 | |
| Summer | 31.86 | 44.20 | 54.98 | 42.18 | 7.21 | 1.09 | |
| The entire research period | 3.51 | 21.17 | 54.98 | 16.23 | 15.57 | 2.08 | |
| The pH [pH] | Autumn | 7.67 | - | 8.03 | - | - | - |
| Winter | 6.30 | - | 7.03 | - | - | - | |
| Spring | 7.15 | - | 9.15 | - | - | - | |
| Summer | 6.96 | - | 7.11 | - | - | - | |
| The entire research period | 6.30 | - | 9.15 | - | - | - | |
| Dissolved oxygen [mg O2/dm3] | Autumn | 8.17 | 8.71 | 9.60 | 8.72 | 0.45 | 0.12 |
| Winter | 8.70 | 9.56 | 10.40 | 9.52 | 0.63 | 0.17 | |
| Spring | 6.44 | 8.88 | 6.44 | 8.96 | 1.35 | 0.36 | |
| Summer | 7.25 | 8.40 | 7.25 | 8.33 | 0.74 | 0.20 | |
| The entire research period | 6.44 | 8.89 | 11.14 | 8.83 | 0.94 | 0.13 | |
| Conductivity [µS/cm] | Autumn | 239.40 | 302.71 | 354.90 | 309.70 | 35.83 | 9.58 |
| Winter | 231.74 | 320.54 | 507.21 | 263.64 | 109.87 | 29.36 | |
| Spring | 225.86 | 320.39 | 396.79 | 325.13 | 51.86 | 13.86 | |
| Summer | 312.80 | 368.57 | 464.40 | 367.20 | 44.40 | 11.87 | |
| The entire research period | 225.86 | 328.05 | 507.21 | 321.55 | 69.78 | 9.32 | |
Table 3.2.
The values of the Pearson correlation coefficient (R) calculated for the examined indicators
| pH | Dissolved oxygen | Conductivity | Chlorophyll „a” | |
|---|---|---|---|---|
| pH | 1 | 0.0599 | 0.1001 | 0.0202 |
| Dissolved oxygen | 0.0599 | 1 | 0.1038 | 0.3977 |
| Conductivity | 0.1001 | 0.1038 | 1 | 0.3568 |
| Chlorophyll „a” | 0.0202 | 0.3977 | 0.3568 | 1 |
Table 3.3.
Trophic status of water basins in Siemiatycze, based on limits of chlorophyll “a” concentration developed by the OECD, Nuremberg & Forsberg and Ryding [22, 23, 24]
| Period | Chlorophyll “a” - average [µg/dm3] | OECD | Forsberg and Ryding | Nürnberg |
|---|---|---|---|---|
| Spring | 22.92 | Eutrophy | Eutrophy | Eutrophy |
| Summer | 44.19 | Hipertrophy | Hipertrophy | Hipertrophy |
| Autumn | 11.06 | Eutrophy | Eutrophy | Eutrophy |
| Winter | 6.49 | Mezotrophy | Mezotrophy | Mezotrophy |
| Year | 21.17 | Eutrophy | Eutrophy | Eutrophy |
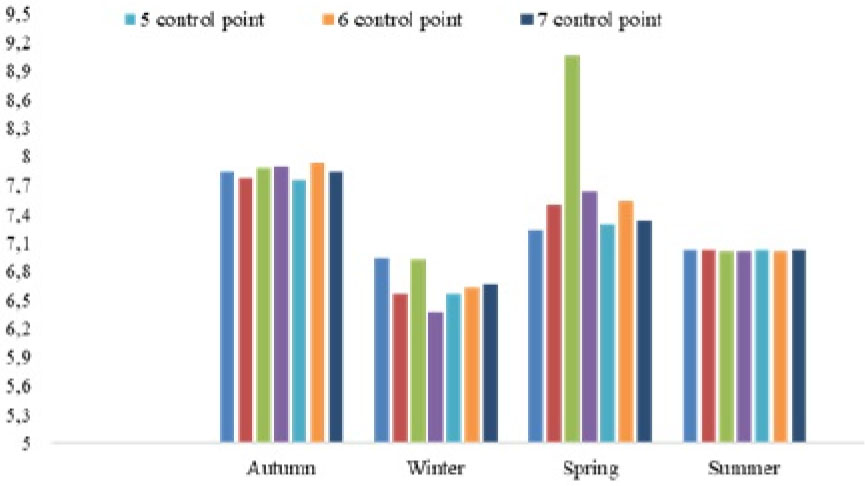
Figure 3.7.
Seasonal changes in pH in the water of Siemiatycze reservoir
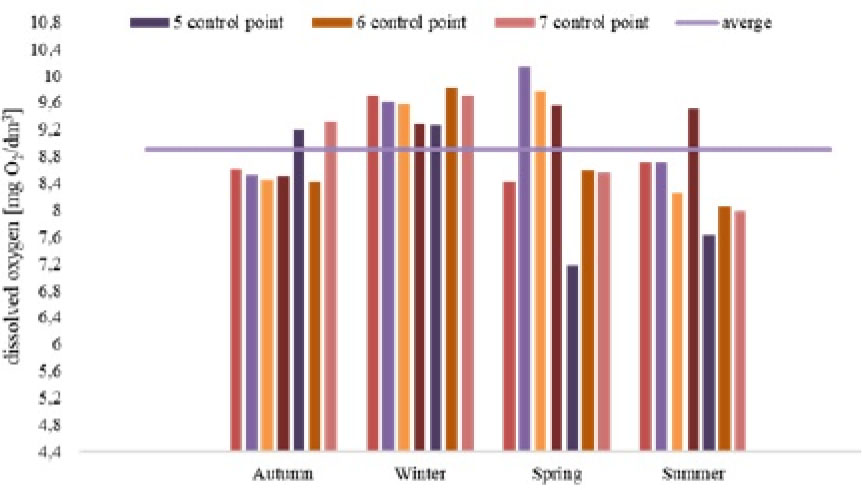
Figure 3.8.
Seasonal changes in the concentration of dissolved oxygen in the Siemiatycze reservoir
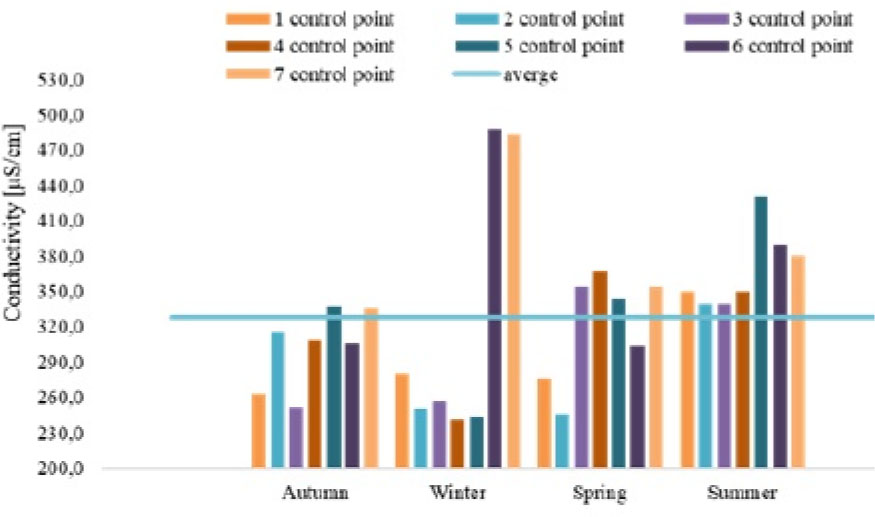
Figure 3.9.
Seasonal changes in conductivity in the Siemiatycze reservoir