

TABLE 1.
Model in RSM
| No | Sand [%] | Red mud [%] | Compression strength [MPa] | Absorption [%] | Abrasion [mm] | Response |
|---|---|---|---|---|---|---|
| X1 | X2 | Y1 | Y2 | Y3 | ||
| 1 | 0.5 | 0 | 17.61 | 10.16 | 0.07 | y1 |
| 2 | 0.5 | 0 | 14.51 | 10.07 | 0.06 | y2 |
| 3 | 0.5 | 0 | 14.34 | 10.16 | 0.05 | y3 |
| 4 | 0.5 | 5 | 20.52 | 9.95 | 0.09 | y4 |
| 5 | 0.5 | 5 | 17.69 | 9.22 | 0.07 | y5 |
| 6 | 0.5 | 5 | 13.02 | 10.96 | 0.05 | y6 |
| 7 | 0.5 | 10 | 22.96 | 10.26 | 0.07 | y7 |
| 8 | 0.5 | 10 | 20.24 | 8.83 | 0.05 | y8 |
| 9 | 0.5 | 10 | 12.24 | 11.31 | 0.05 | y9 |
| 10 | 0.5 | 20 | 20.41 | 9.23 | 0.06 | y10 |
| 11 | 0.5 | 20 | 19.43 | 10.58 | 0.10 | y11 |
| 12 | 0.5 | 20 | 9.98 | 11.26 | 0.15 | y12 |
TABLE 2.
Analysis of variance (ANOVA) for compressive strength
| Specification | Source | ||||
|---|---|---|---|---|---|
| df | SS(adj) | MS(adj) | F-value | p-value | |
| Model | 5 | 108.329 | 21.6659 | 7.65 | 0.014 |
| Linear | 2 | 63.290 | 31.6451 | 11.18 | 0.009 |
| Sand [%] | 1 | 62.768 | 62.7680 | 22.17 | 0.003 |
| Red mud [%] | 1 | 0.798 | 0.7975 | 0.28 | 0.615 |
| Square | 2 | 15.221 | 7.6104 | 2.69 | 0.147 |
| Sand [%] × sand [%] | 1 | 0.079 | 0.0794 | 0.03 | 0.873 |
| Red mud [%] × red mud [%] | 1 | 15.141 | 15.1414 | 5.35 | 0.060 |
| Two-way interaction | 1 | 41.989 | 41.9891 | 14.83 | 0.008 |
| Sand [%] × red mud [%] | 1 | 41.989 | 41.9891 | 14.83 | 0.008 |
| Error | 6 | 16.989 | 2.8315 | × | × |
| Total | 11 | 125.318 | × | × | × |
TABLE 4.
Analysis of variance (ANOVA) for absorption
| Specification | Source | ||||
|---|---|---|---|---|---|
| df | SS(adj) | MS(adj) | F-value | p-value | |
| Model | 5 | 4.54310 | 0.90862 | 2.22 | 0.179 |
| Linear | 2 | 2.64710 | 1.32355 | 3.24 | 0.111 |
| Sand [%] | 1 | 2.48133 | 2.48133 | 6.07 | 0.049 |
| Red mud [%] | 1 | 0.19447 | 0.19447 | 0.48 | 0.516 |
| Square | 2 | 0.87757 | 0.43878 | 1.07 | 0.399 |
| Sand [%] × sand [%] | 1 | 0.83570 | 0.83570 | 2.05 | 0.203 |
| Red mud [%] × red mud [%] | 1 | 0.04187 | 0.04187 | 0.10 | 0.760 |
| Two-way interaction | 1 | 0.82476 | 0.82476 | 2.02 | 0.205 |
| Sand [%] × red mud [%] | 1 | 0.82476 | 0.82476 | 2.02 | 0.205 |
| Error | 6 | 2.45155 | 0.40859 | × | × |
| Total | 11 | 6.99466 | × | × | × |
TABLE 6.
Analysis of variance (ANOVA) for abrasion
| Specification | Source | ||||
|---|---|---|---|---|---|
| df | SS(adj) | MS(adj) | F-value | p-value | |
| Model | 5 | 0.007467 | 0.001493 | 4.58 | 0.046 |
| Linear | 2 | 0.003321 | 0.001661 | 5.09 | 0.051 |
| Sand [%] | 1 | 0.000188 | 0.000188 | 0.57 | 0.477 |
| Red mud [%] | 1 | 0.003166 | 0.003166 | 9.70 | 0.021 |
| Square | 2 | 0.000834 | 0.000417 | 1.28 | 0.345 |
| Sand [%] × sand [%] | 1 | 0.000029 | 0.000029 | 0.09 | 0.777 |
| Red mud [%] × red mud [%] | 1 | 0.000805 | 0.000805 | 2.47 | 0.167 |
| Two-way interaction | 1 | 0.003886 | 0.003886 | 11.91 | 0.014 |
| Sand [%] × red mud [%] | 1 | 0.003886 | 0.003886 | 11.91 | 0.014 |
| Error | 6 | 0.001958 | 0.000326 | × | × |
| Total | 11 | 0.009425 | × | × | × |
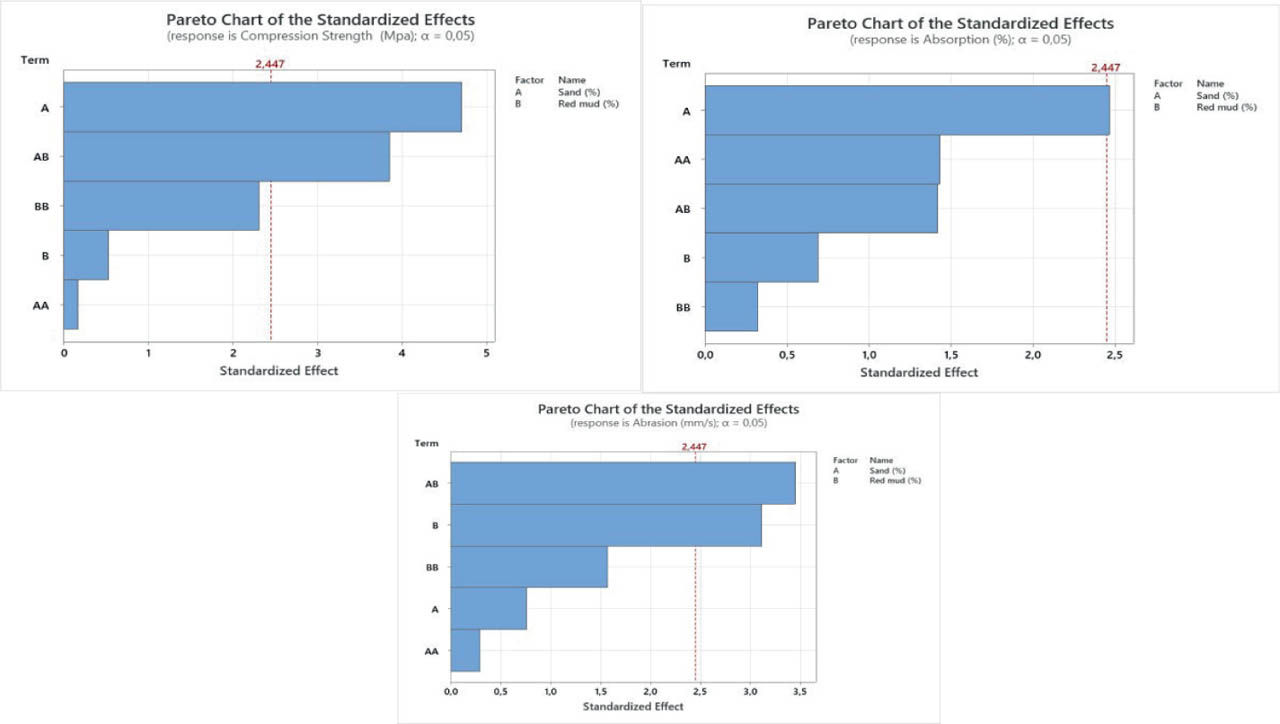
FIGURE 1.
Bar chart of the standardized effects for compression strength, absorption, and abrasion
Source: own work.
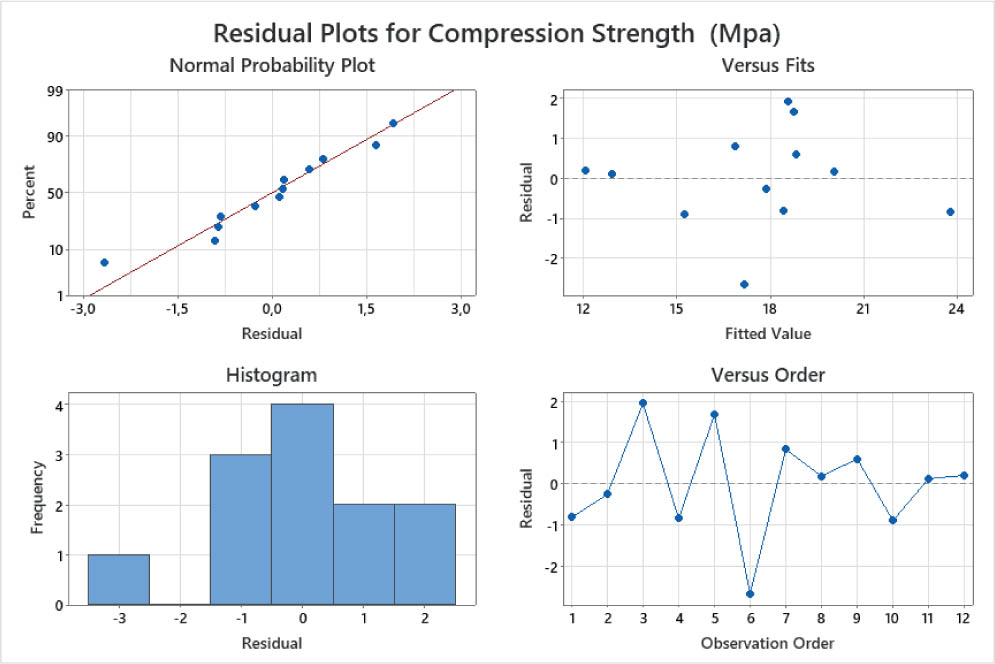
FIGURE 2.
Bar chart and residual plot for compression strength
Source: own work.
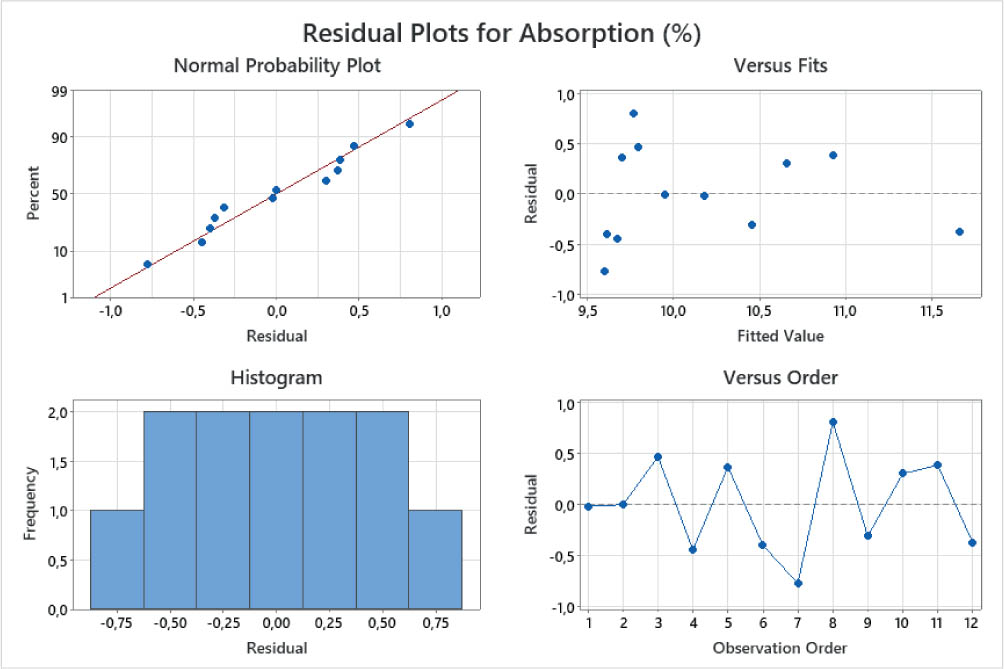
FIGURE 3.
Bar chart and residual plot for absorption
Source: own work.
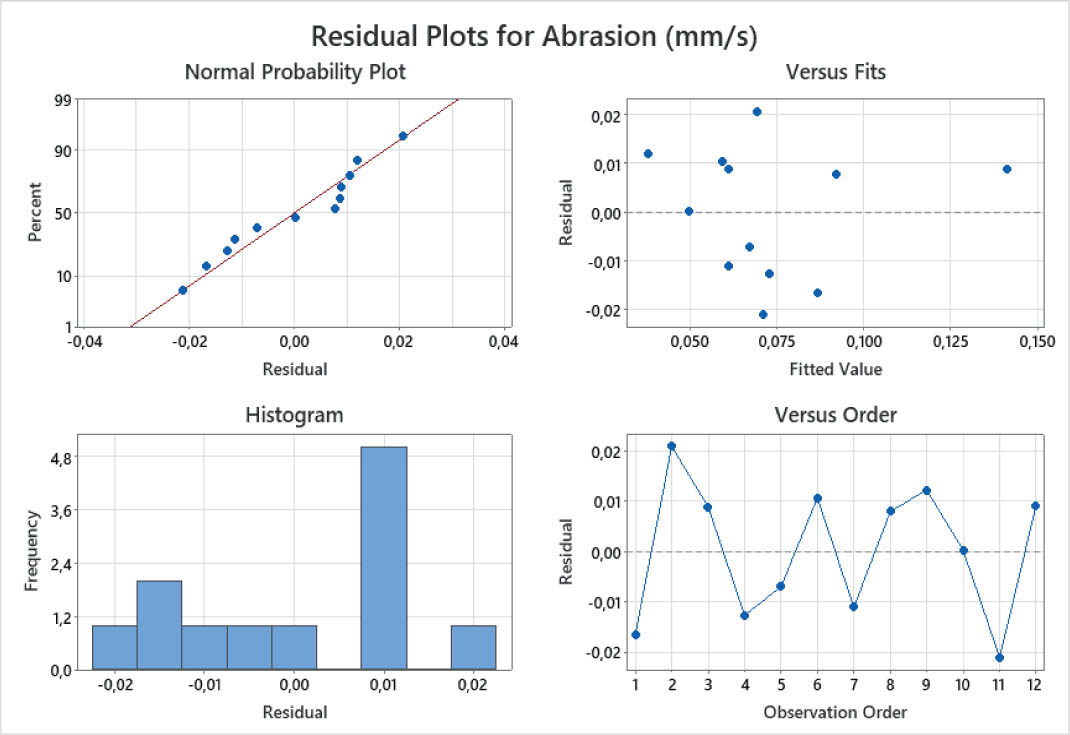
FIGURE 4.
Bar chart and residual plot for abrasion
Source: own work.
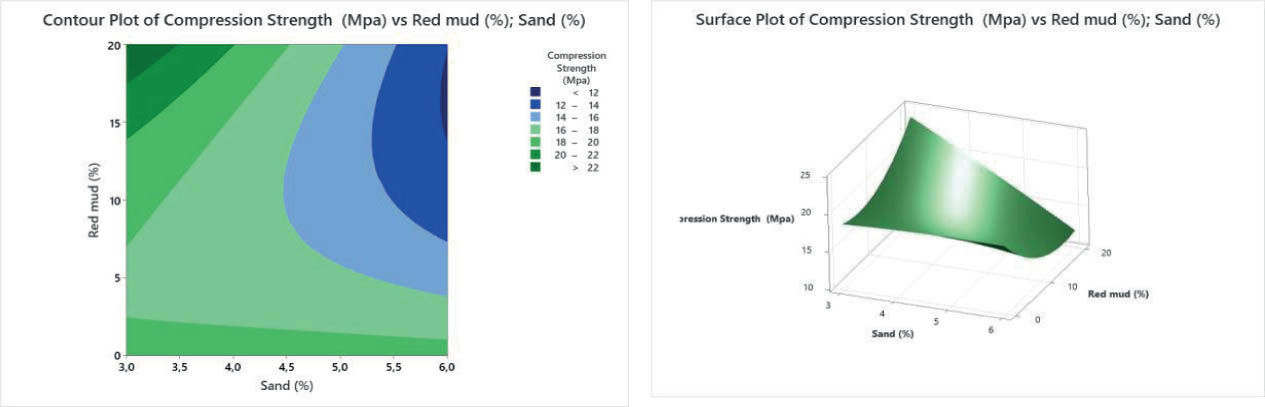
FIGURE 5.
Contour and surface plot for compression strength
Source: own work.
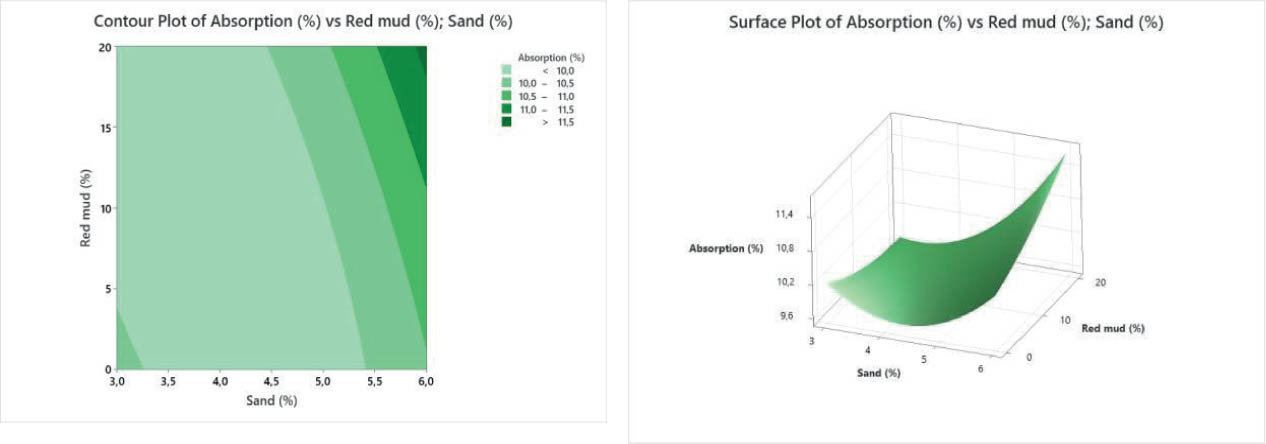
FIGURE 6.
Contour and surface plot for absorption
Source: own work.
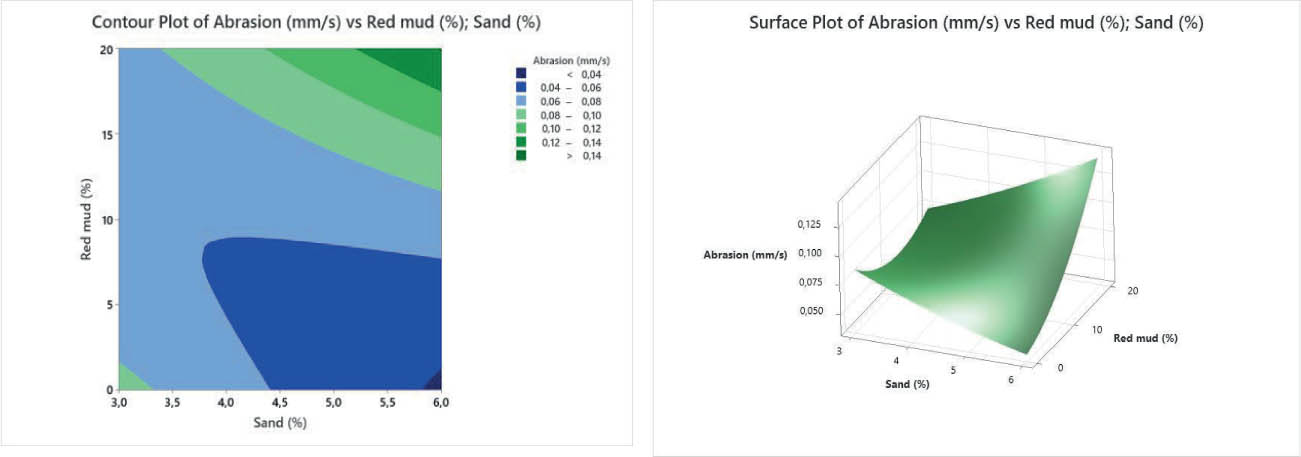
FIGURE 7.
Contour and surface plot for abrasion
Source: own work.
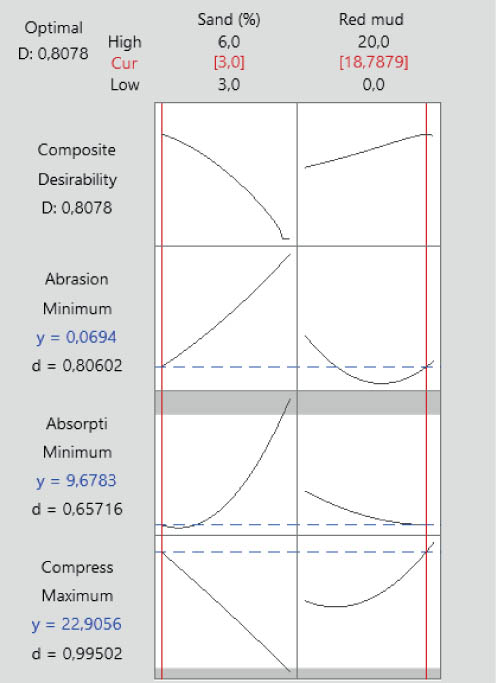
FIGURE 8.
Optimum plot
Source: own work.
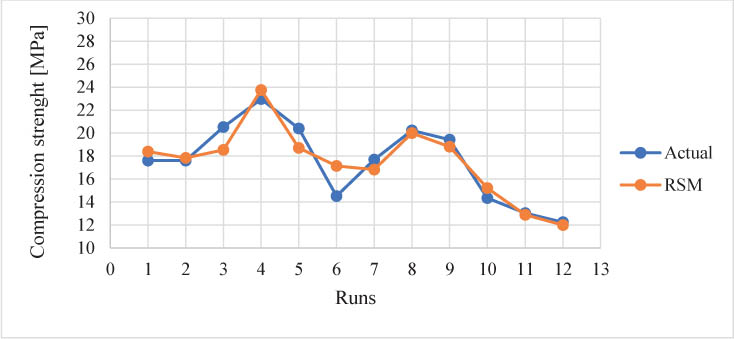
FIGURE 9.
Comparison plot of actual compression strength versus response surface methodology prediction
Source: own work.
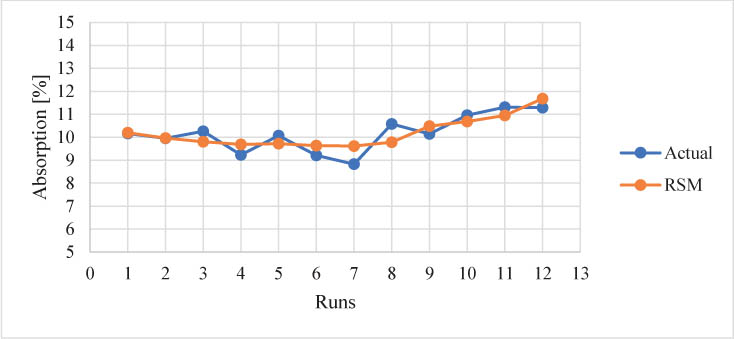
FIGURE 10.
Comparison plot of actual compression strength versus response surface methodology prediction
Source: own work.
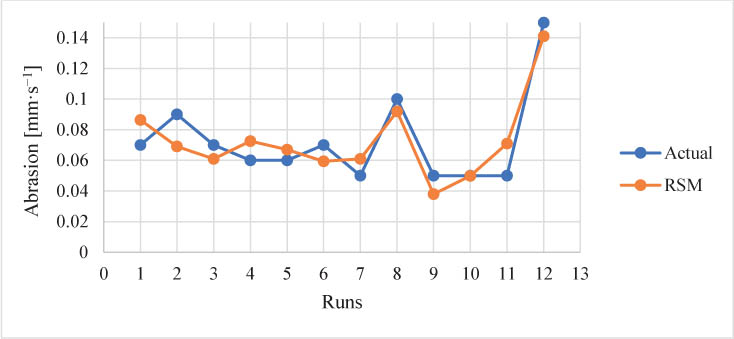
FIGURE 11.
Comparison plot of actual compression strength versus response surface methodology prediction
Source: own work.