

Introduction
Paving blocks are widely used as interlocking concrete elements for roadways, parking areas, pedestrian paths, and landscape applications due to their ease of installation, durability, and aesthetic flexibility. According to the Indonesian National Standard SNI 03-0691 (Badan Standardisasi Nasional [BSN], 1996), paving blocks are manufactured from a mixture of portland composite cement or other hydraulic binders, water, aggregates, and optional additives that do not adversely affect the quality of concrete blocks. Based on their compressive strength, paving blocks are classified into four quality grades: Class A for roads, Class B for parking areas, Class C for pedestrian pathways, and Class D for parks and other light-use applications (Io et al., 2024).
In recent years, the rapid increase in the prices of construction materials, particularly cement and natural sand, has significantly affected paving block production costs, leading to reduced profit margins for manufacturers. In cities such as Pontianak, the market price of paving blocks ranges from 90,000 IDR·m−2 to 120,000 IDR·m−2, with material costs being the dominant contributing factor. This economic challenge has encouraged the exploration of alternative and low-cost materials that are locally available and environmentally sustainable (Arya & Sahu, 2024).
Red mud, a by-product generated from alumina extraction through the Bayer process, has emerged as a promising alternative material in construction applications. On average, 0.3–0.5 tons of red mud are produced per ton of alumina, depending on the bauxite grade (Power et al., 2011). Liu et al. (2011), and Liu and Li (2015) reported that red mud is characterized by high alkalinity and the presence of trace radioactive elements and heavy metals, which may pose environmental hazards if not properly managed or disposed of. Consequently, the utilization of red mud in construction materials offers a dual benefit: reducing environmental pollution while lowering the consumption of conventional cement.
Red mud has the potential to be utilized in cement-based materials due to its high alumina, iron oxide, and silica contents, as well as its alkalinity and fine particle characteristics. These properties may contribute to its interaction with cementitious systems and influence strength development in cement-based materials (Sutar et al., 2014). According to numerous studies, compressive strength can be enhanced or maintained by partial replacement of cement with red mud, but only within a specific range of replacement. For instance, a red mud replacement of approximately 10–20% has been found to provide comparable or superior strength. In contrast, excessive replacement may reduce strength due to dilution effects and changes in binder reactivity. The chemical and mineralogical composition of red mud varies with bauxite source, geographical origin, and alumina-refining process, which is why these findings are not always consistent. Mix-specific evaluation is required due to the impact of this variability on its reactivity, alkalinity, and interaction with cement hydration products.
Studies focusing on paving blocks are comparatively scarce, despite previous research investigating red clay in cement mortar, concrete, and geopolymer systems (You et al., 2018). Existing paver-block studies have typically assessed specific red mud percentages or employed red mud primarily as a geopolymer precursor. However, they have not comprehensively optimized red mud–cement paving block mixtures by systematically linking replacement levels, mix proportions, and compressive strength. Thus, the present investigation's novelty lies in its systematic assessment and optimization of red mud as a partial cement substitute in paving blocks. The primary objective is to determine the optimal replacement level that enhances compressive strength while simultaneously addressing the variability in red mud properties. Compared with previous research that focused on conventional concrete, mortar, or geopolymer applications, this study provides new experimental evidence for the use of locally sourced red mud in the production of paving blocks. It establishes a more practical mix-design foundation for sustainable pavement materials.
In contrast to previous research that primarily examined red mud in conventional concrete or mortar systems, the current study focuses on the production of paving blocks. It systematically evaluates the optimal red mud replacement level with respect to compressive strength. This research addresses a current lacuna in the literature by introducing a mix-proportion optimization framework for red mud-based paving blocks that utilizes locally available red mud with unique chemical properties.
Therefore, this study proposes a multi-response optimization approach using response surface methodology (RSM) (Regulacion & Oreta, 2013; Abouhelal et al., 2023; Khan et al., 2025) to simultaneously evaluate and optimize the proportions of red mud and sand in paving block production. By considering multiple performance indicators, such as compressive strength, water absorption, density, and abrasion resistance, this research aims to develop an optimized mix design that satisfies SNI requirements while reducing production costs and promoting sustainable waste utilization. The findings are expected to provide a practical and statistically robust framework for industrial-scale paving block manufacturing using red mud as an alternative cementitious material.
Material and methods
Research procedure
The research procedure consisted of material characterization, mix design development, specimen preparation, curing, performance testing, and statistical optimization. This systematic experimental approach is commonly applied in cement-based material optimization studies, particularly in mixture design studies employing response surface-based optimization and factorial design methods (Myers et al., 2016; Meng et al., 2018; Nandurkar et al., 2025).
Materials
Cement. Portland composite cement (PCC) conforming to SNI 15-0302 (BSN, 2004) was used as the primary binder (Neville, 2011; Tw et al., 2023).
Aggregates. Sand and coarse aggregates were obtained from local sources and tested for mud content, moisture content, particle size distribution according to SNI 03-1968 (BSN, 1990), specific gravity, water absorption, and bulk density in accordance with relevant SNI standards (Topçu & Uygunoǧlu, 2010).
Red mud. Red mud was sourced from a bauxite processing facility and prepared by air-drying and sieving prior to use. Red mud replacement levels of 0%, 5%, 10%, and 20% by weight of cement were investigated (Power et al., 2011; Huang et al., 2022).
Water. Tap water supplied by the local water utility (PDAM) was used for mixing. The water quality met the general requirements for concrete mixing water (Neville, 2011).
Experimental design using response surface methodology. RSM was employed to model and optimize paving block mixtures with multiple interacting variables. Two independent variables were considered:
– X1: sand proportion (cement : sand ratios of 1 : 3, 1 : 4, and 1 : 6).
– X2: red mud replacement level (0–20% by cement weight).
RSM is widely used in cement-based materials research for its ability to generate predictive models and efficiently evaluate interaction effects (Myers et al., 2016; Khayat et al., 2019). The experimental design enabled the development of second-order polynomial regression models for each response.
Specimen preparation. Paving block specimens with dimensions of 200 × 100 × 60 mm were produced using three base mix ratios: 1 : 3 : 0.5, 1 : 4 : 0.5, and 1 : 6 : 0.5 (cement : sand : stone). The water-to-cement ratio was maintained at 0.25 for all mixtures, consistent with paving block production practices (Topçu & Uygunoǧlu, 2010; Nofrianto & Hutrio, 2023; Aryanto et al., 2025).
Testing program. The performance of paving blocks was evaluated based on the following tests, conducted in accordance with SNI 03-1968 (BSN, 1990) and SNI 03-0691 (BSN, 1996).
Bulk density measurement. Five specimens (paving blocks) were tested for each mixture to ensure statistical reliability, following common practice in paving block research (Gencel et al., 2012).
Statistical analysis and ANOVA. Analysis of variance (ANOVA) was applied to assess the statistical significance of the developed regression models and interaction terms between red mud content and sand proportion. Model adequacy was evaluated using the coefficient of determination (R2), adjusted R2, and lack-of-fit tests at a 95% confidence level (Myers et al., 2016).
Multi-response optimization using desirability function. A desirability function approach was used to simultaneously optimize multiple performance responses. The optimization objectives were defined as follows:
– maximize: compressive strength,
– minimize: water absorption and abrasion.
The desirability-based optimization approach is well established in cementitious material studies for balancing conflicting performance criteria (Meng et al., 2018).
Methodological contribution. The integration of RSM, ANOVA, and desirability function analysis provides a statistically robust framework for optimizing paving block mixtures incorporating industrial waste materials. This methodology enhances mix design efficiency and supports sustainable construction practices through reduced cement consumption and improved material utilization (Montgomery, 2017; Huang et al., 2022).
Results and discussion
Development of response surface models
Second-order polynomial regression models were successfully developed for the selected response variables, namely mechanical strength and durability, using RSM based on a central composite design (CCD). The ANOVA results confirmed that the models were statistically significant at the 95% confidence level, as indicated by model p-values below 0.05. The high values of R2 and adjusted R2 further demonstrated good agreement between the experimental and predicted responses, suggesting that the proposed models were able to adequately describe the combined effects of red mud content and sand proportion on paving block performance.
Beyond statistical significance, the adequacy of the models is also supported by their ability to capture the linear, quadratic, and interaction effects of the independent variables. This finding is consistent with findings by Yang et al. (2025), who reported that RSM was effective for optimizing red mud–based cementitious materials because it can account for multi-factor interactions that are often overlooked in conventional one-factor-at-a-time experimental approaches. Their study also highlighted that red mud content was one of the dominant factors affecting both compressive (Oleh et al., 2022) and flexural performance, which agrees with the present finding that variations in red mud dosage significantly influenced the response behavior of paving blocks.
The observed influence of red mud content on mechanical strength is generally in line with previous studies on red mud-modified concrete. Venkatesh et al. (2021) reported that concrete incorporating red mud achieved maximum compressive strength at approximately 10% replacement, accompanied by reduced porosity, lower water absorption, and improved chloride resistance. Similarly, Sunkpho et al. (2026) found that red mud replacement in the range of 10–15% enhanced compressive strength, flexural strength, and durability, whereas replacement levels above 15% tended to reduce performance. These findings support the present model response, particularly if the optimum red mud content obtained in this study falls within the moderate replacement range of insert optimum red mud content.
However, the present results also indicate that the beneficial effect of red mud is not independent of sand proportion. The significant interaction term between red mud content and sand proportion suggests that the performance of paving blocks is governed not only by the chemical contribution of red mud but also by particle packing, matrix densification, and aggregate–binder balance. This provides a more specific contribution compared with several previous studies that primarily examined red mud as a cement replacement in conventional concrete. For example, recent investigations on red mud concrete reported strength improvement mainly due to filler effects, pozzolanic activity, and densification of the interfacial transition zone, but they did not explicitly evaluate the combined role of red mud and sand proportion in paving block mixtures.
In terms of durability, the present findings are also consistent with earlier reports showing that red mud can improve resistance to water-related deterioration when used at an appropriate dosage. Venkatesh et al. (2021) observed reductions in open porosity, water absorption, sorptivity, and chloride permeability with red mud incorporation, which they attributed to improved microstructure and increased C–S–H gel formation. This supports the durability trend observed in the present study, where insert durability response, e.g., lower water absorption/abrasion loss was achieved at the optimized mixture. Nevertheless, the reduction in performance at excessive red mud levels, if observed, may be attributed to dilution of cementitious phases, increased alkalinity, or insufficient particle bonding, which has also been reported in the literature.
Compared with recent studies on red mud-based geopolymer paver blocks, the present work provides a different but complementary contribution (Mohibullah & Acharya, 2025) demonstrated that red mud–ground blast furnace slag geopolymer paver blocks could satisfy heavy-traffic requirements, with improved mechanical, abrasion, water absorption, carbon, and energy performance compared with conventional concrete paver blocks. While their study focused on geopolymer activation using red mud and slag, the present study focuses on the statistical optimization of red mud content and sand proportion using CCD-RSM. Therefore, the novelty of the present work lies in establishing predictive models that can guide mix proportioning for paving blocks rather than merely identifying a single best-performing mixture.
Overall, the developed RSM models provide a reliable and practical tool for predicting paving block performance within the investigated design space. The agreement between predicted and experimental values indicates that the models are suitable for mixture optimization. More importantly, the results confirm that the use of red mud in paving block production is technically feasible when its dosage is carefully controlled and balanced with the sand proportion. This finding strengthens the potential of red mud valorization in sustainable construction materials while also addressing the limitations noted in previous studies, particularly the need for more systematic optimization of red mud-based paving block mixtures.
In this research, the sand content was maintained at 0.5% for all samples, while the red mud content was set at four levels: 0%, 5%, 10%, and 20%, as illustrated in Table 1. To quantify the variability in the measured responses, including compressive strength, water absorption, and abrasion resistance, each mixture composition was tested in triplicate.
TABLE 1.
Model in RSM
| No | Sand [%] | Red mud [%] | Compression strength [MPa] | Absorption [%] | Abrasion [mm] | Response |
|---|---|---|---|---|---|---|
| X1 | X2 | Y1 | Y2 | Y3 | ||
| 1 | 0.5 | 0 | 17.61 | 10.16 | 0.07 | y1 |
| 2 | 0.5 | 0 | 14.51 | 10.07 | 0.06 | y2 |
| 3 | 0.5 | 0 | 14.34 | 10.16 | 0.05 | y3 |
| 4 | 0.5 | 5 | 20.52 | 9.95 | 0.09 | y4 |
| 5 | 0.5 | 5 | 17.69 | 9.22 | 0.07 | y5 |
| 6 | 0.5 | 5 | 13.02 | 10.96 | 0.05 | y6 |
| 7 | 0.5 | 10 | 22.96 | 10.26 | 0.07 | y7 |
| 8 | 0.5 | 10 | 20.24 | 8.83 | 0.05 | y8 |
| 9 | 0.5 | 10 | 12.24 | 11.31 | 0.05 | y9 |
| 10 | 0.5 | 20 | 20.41 | 9.23 | 0.06 | y10 |
| 11 | 0.5 | 20 | 19.43 | 10.58 | 0.10 | y11 |
| 12 | 0.5 | 20 | 9.98 | 11.26 | 0.15 | y12 |
Subsequently, Samples 1–3 constitute repeated tests for the mixture containing 0.5% sand and 0% red mud; Samples 4–6 constitute repeated tests for the mixture containing 0.5% sand and 5% red mud; Samples 7–9 constitute repeated tests for the mixture containing 0.5% sand and 10% red mud; and Samples 10–12 constitute repeated tests for the mixture containing 0.5% sand and 20% red mud. Experimental variability during specimen preparation, compaction, curing, and testing is responsible for the variations in response values among samples with equal mixture compositions.
Analysis results of the experiment with RSM surface
The model explains a significant amount of variation in compressive strength (R2 = 86.44%), though there is some lack of fit as indicated by the significant p-value for the lack-of-fit test (Tables 2–5).
TABLE 2.
Analysis of variance (ANOVA) for compressive strength
| Specification | Source | ||||
|---|---|---|---|---|---|
| df | SS(adj) | MS(adj) | F-value | p-value | |
| Model | 5 | 108.329 | 21.6659 | 7.65 | 0.014 |
| Linear | 2 | 63.290 | 31.6451 | 11.18 | 0.009 |
| Sand [%] | 1 | 62.768 | 62.7680 | 22.17 | 0.003 |
| Red mud [%] | 1 | 0.798 | 0.7975 | 0.28 | 0.615 |
| Square | 2 | 15.221 | 7.6104 | 2.69 | 0.147 |
| Sand [%] × sand [%] | 1 | 0.079 | 0.0794 | 0.03 | 0.873 |
| Red mud [%] × red mud [%] | 1 | 15.141 | 15.1414 | 5.35 | 0.060 |
| Two-way interaction | 1 | 41.989 | 41.9891 | 14.83 | 0.008 |
| Sand [%] × red mud [%] | 1 | 41.989 | 41.9891 | 14.83 | 0.008 |
| Error | 6 | 16.989 | 2.8315 | × | × |
| Total | 11 | 125.318 | × | × | × |
Regression equation for compression strength:
TABLE 4.
Analysis of variance (ANOVA) for absorption
| Specification | Source | ||||
|---|---|---|---|---|---|
| df | SS(adj) | MS(adj) | F-value | p-value | |
| Model | 5 | 4.54310 | 0.90862 | 2.22 | 0.179 |
| Linear | 2 | 2.64710 | 1.32355 | 3.24 | 0.111 |
| Sand [%] | 1 | 2.48133 | 2.48133 | 6.07 | 0.049 |
| Red mud [%] | 1 | 0.19447 | 0.19447 | 0.48 | 0.516 |
| Square | 2 | 0.87757 | 0.43878 | 1.07 | 0.399 |
| Sand [%] × sand [%] | 1 | 0.83570 | 0.83570 | 2.05 | 0.203 |
| Red mud [%] × red mud [%] | 1 | 0.04187 | 0.04187 | 0.10 | 0.760 |
| Two-way interaction | 1 | 0.82476 | 0.82476 | 2.02 | 0.205 |
| Sand [%] × red mud [%] | 1 | 0.82476 | 0.82476 | 2.02 | 0.205 |
| Error | 6 | 2.45155 | 0.40859 | × | × |
| Total | 11 | 6.99466 | × | × | × |
Regression equation for absorption:
The model explains a moderate portion of the variance in absorption (R2 = 64.95%). However, the low predicted R2 suggests that the model does not generalize well to new data (Tables 6–7).
TABLE 6.
Analysis of variance (ANOVA) for abrasion
| Specification | Source | ||||
|---|---|---|---|---|---|
| df | SS(adj) | MS(adj) | F-value | p-value | |
| Model | 5 | 0.007467 | 0.001493 | 4.58 | 0.046 |
| Linear | 2 | 0.003321 | 0.001661 | 5.09 | 0.051 |
| Sand [%] | 1 | 0.000188 | 0.000188 | 0.57 | 0.477 |
| Red mud [%] | 1 | 0.003166 | 0.003166 | 9.70 | 0.021 |
| Square | 2 | 0.000834 | 0.000417 | 1.28 | 0.345 |
| Sand [%] × sand [%] | 1 | 0.000029 | 0.000029 | 0.09 | 0.777 |
| Red mud [%] × red mud [%] | 1 | 0.000805 | 0.000805 | 2.47 | 0.167 |
| Two-way interaction | 1 | 0.003886 | 0.003886 | 11.91 | 0.014 |
| Sand [%] × red mud [%] | 1 | 0.003886 | 0.003886 | 11.91 | 0.014 |
| Error | 6 | 0.001958 | 0.000326 | × | × |
| Total | 11 | 0.009425 | × | × | × |
Regression equation for abrasion:
The model explains a significant portion of the variation in abrasion (R2 = 79.23%), but the low predicted R2 (0.00%) suggests that the model may not generalize well to new data, although it captures important relationships between factors.
Individual and simultaneous significance tests. By evaluating both individual and simultaneous significance, we gain a comprehensive understanding of how the proportions of red mud and sand influence paving block performance, which is critical for developing optimized sustainable materials in line with performance standards such as SNI 03-0691 (BSN, 1996) and findings by Wang (2025).
According to the Pareto charts, optimal utilization of red clay and sand can enhance the performance of paving blocks, particularly in abrasive resistance, water absorption, and compressive strength. The results of this study suggest that red clay has the potential to be used as a sustainable alternative paving block material without sacrificing quality (Fig. 1). These findings are consistent with the research by Mohibullah and Acharya (2025), who observed that geopolymer paving blocks made from red mud and ground blast furnace slag exhibited excellent mechanical performance and durability. The compressive strength of the blocks exceeded the requirements for heavy traffic, and the water absorption and abrasion values were below the specified limits. The same results were also reported by Zhang et al. (2021), who demonstrated that red mud-based pavement concrete is suitable for road infrastructure due to its good compressive strength, abrasion resistance, and water impermeability. Viyasun et al. (2021) discovered that the tensile properties of concrete can be improved at specific concentrations by substituting red mud, and that water absorption can be reduced in comparison to conventional concrete at specific red mud percentages. As a result, the findings of this study substantiate prior research that the use of red clay as a construction material can facilitate the creation of environmentally friendly pavers while simultaneously satisfying the technical specifications of a variety of applications.
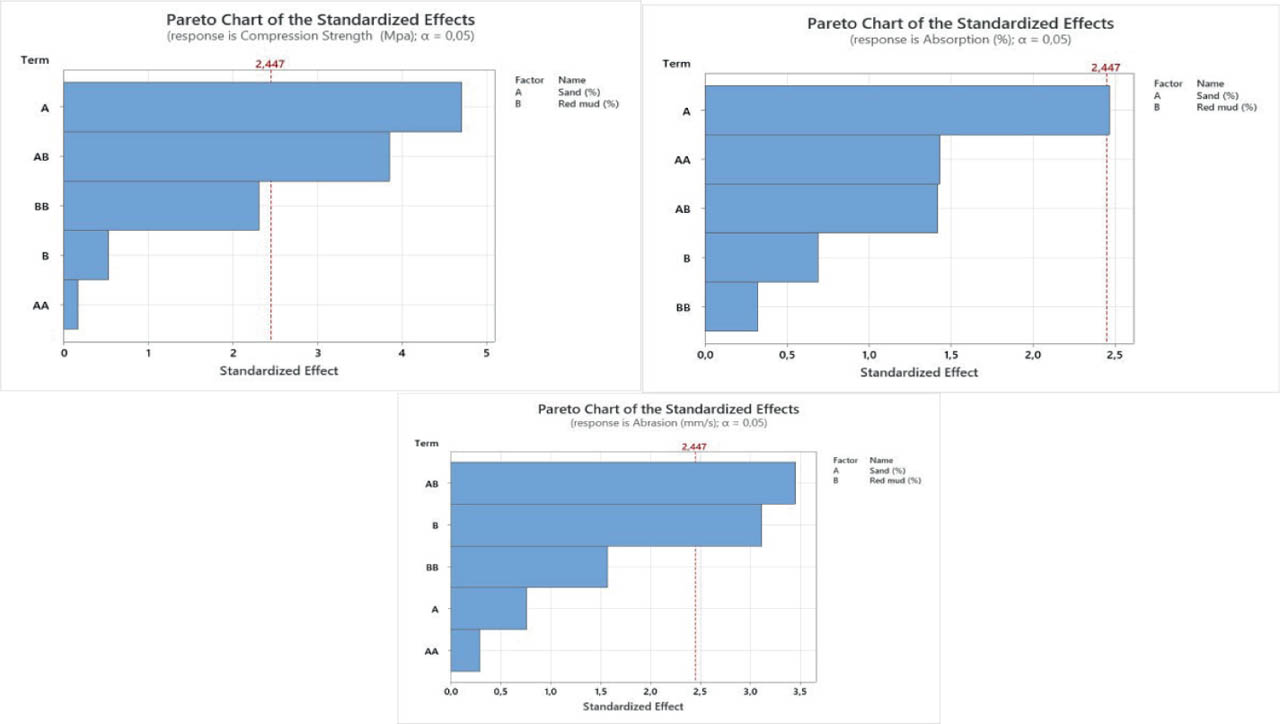
FIGURE 1.
Bar chart of the standardized effects for compression strength, absorption, and abrasion
Source: own work.
Model assumption verification. The verification process plays a crucial role in confirming the adequacy of the model for further optimization and prediction.
These findings validate the use of the regression model, making the results from this study reliable for optimization and prediction purposes in the development of paving blocks incorporating red mud and sand (Fig. 2).
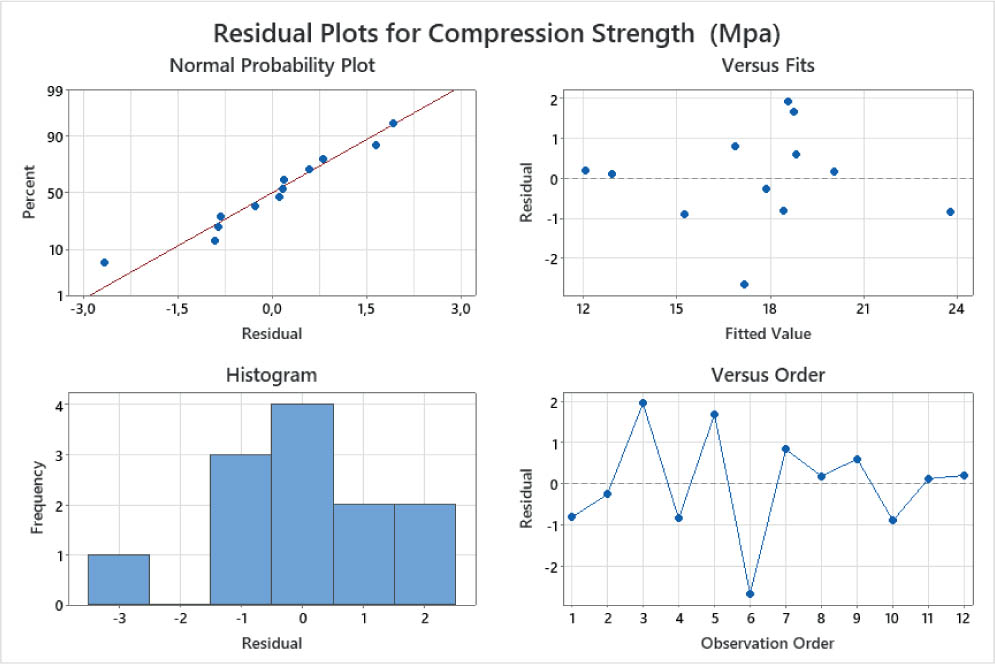
FIGURE 2.
Bar chart and residual plot for compression strength
Source: own work.
These findings support the use of the regression model for analyzing absorption, and the results are reliable for optimization and predictions related to paving block performance (Fig. 3).
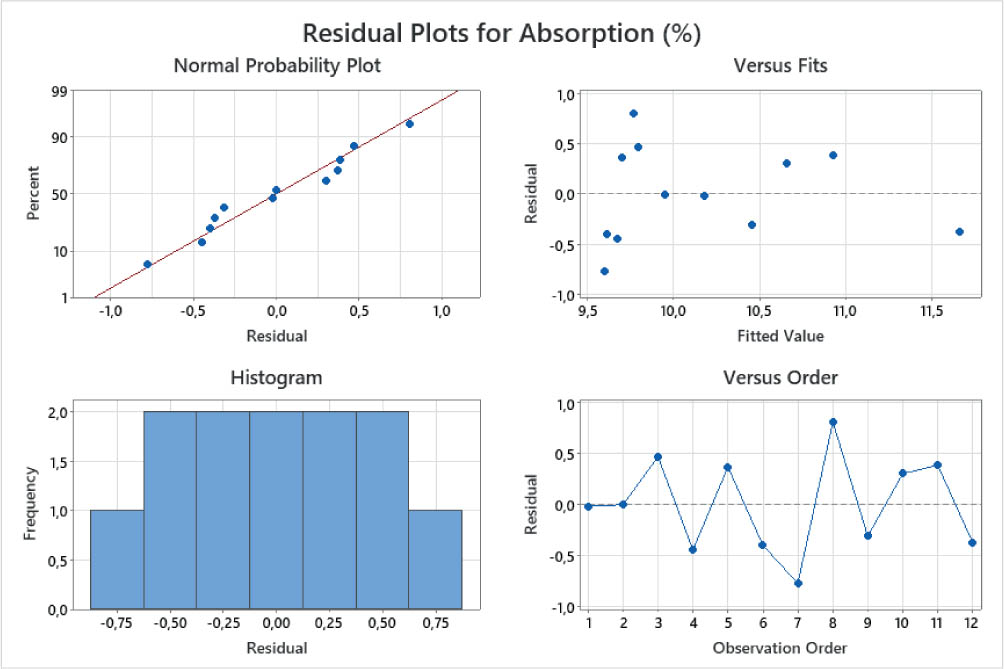
FIGURE 3.
Bar chart and residual plot for absorption
Source: own work.
These findings support the use of the regression model for analyzing abrasion and validate the results for optimization and prediction purposes related to paving block performance, water absorption, and a balance (Fig. 4).
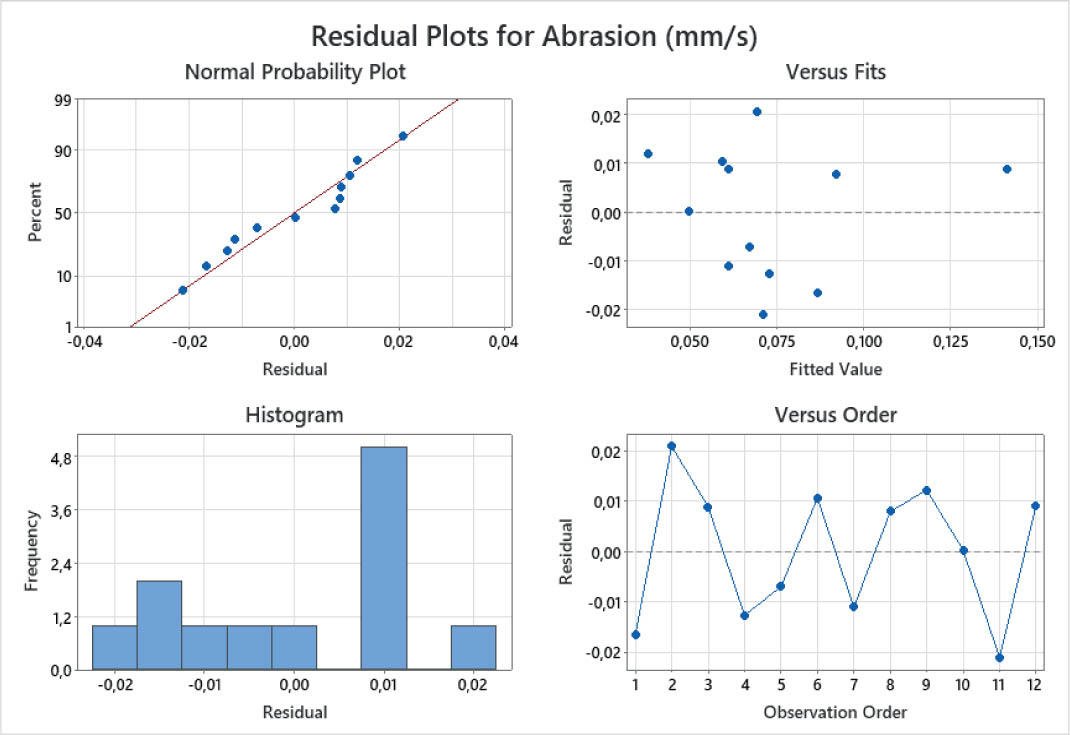
FIGURE 4.
Bar chart and residual plot for abrasion
Source: own work.
Response surface and contour plot analysis. Through this analysis we can explore and identify areas on the plot that show the best relationship between sand and red mud composition with the critical properties of paving blocks.
Both the contour and surface plots indicate that increasing sand and red mud content generally enhances compressive strength (Fig. 5). Both the contour and surface plots suggest that the proportion between sand and red mud should be minimized (Fig. 6). Both the contour and surface plots indicate that an optimal combination of sand and red mud results in the best abrasion resistance (Fig. 7).
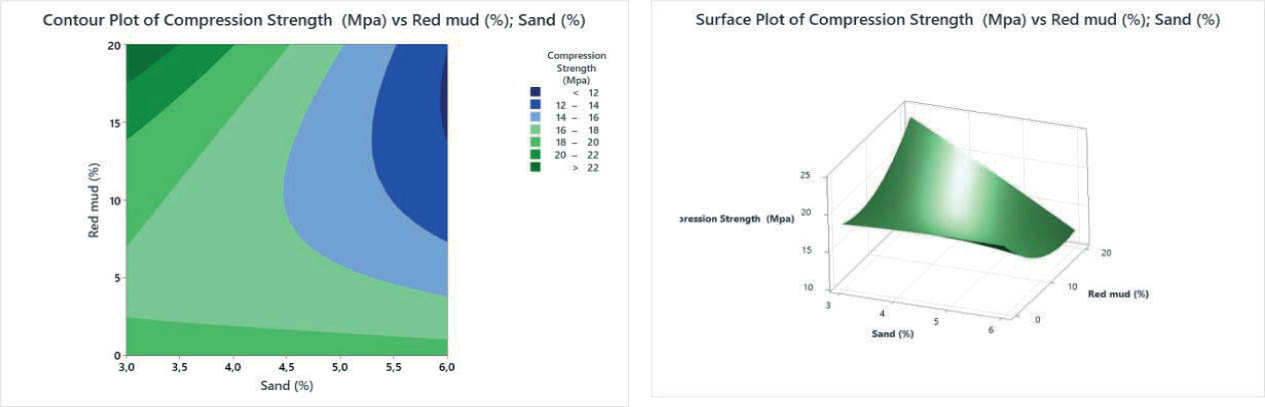
FIGURE 5.
Contour and surface plot for compression strength
Source: own work.
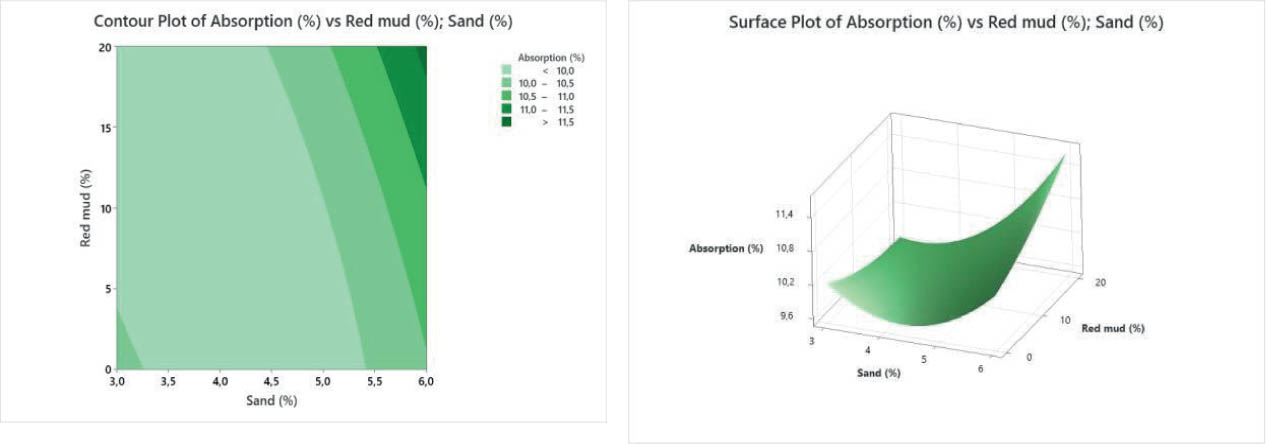
FIGURE 6.
Contour and surface plot for absorption
Source: own work.
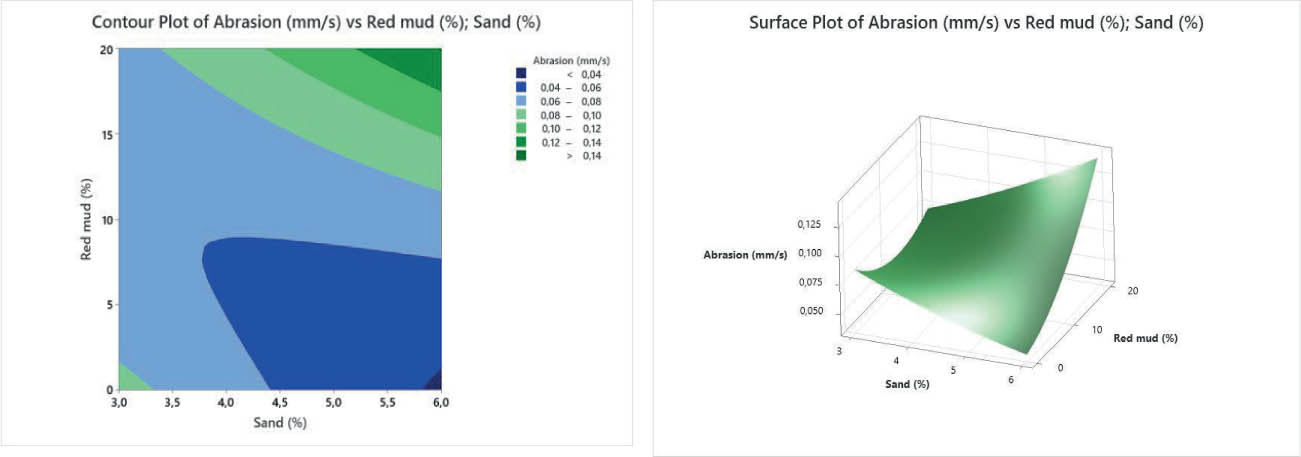
FIGURE 7.
Contour and surface plot for abrasion
Source: own work.
Optimization results. In the following analysis we will review the optimized mixture ratios that yield the best results for compressive strength, water absorption, and abrasion resistance. By applying this optimization approach, the paving block production can achieve a balanced and efficient process that meets industry standards.
The minimum abrasion value of y = 0.0694 was obtained at the optimal sand-to-red mud ratio, indicating that the mixture can reduce surface wear and improve the durability of the paving blocks. The desirability value for abrasion was d = 0.80602, which indicates a high level of optimization for this property. In addition, the minimum water absorption value of y = 9.6783 was achieved with a desirability value of d = 0.65716, suggesting that the selected material combination can reduce water absorption to an acceptable level. This is important for improving the long-term performance and durability of paving blocks. Furthermore, the maximum compressive strength value of y = 22.9056 was achieved with a desirability value of d = 0.99502, showing that the combination of sand and red mud can enhance the strength of paving blocks and make them suitable for applications requiring higher load-bearing capacity (Fig. 8).
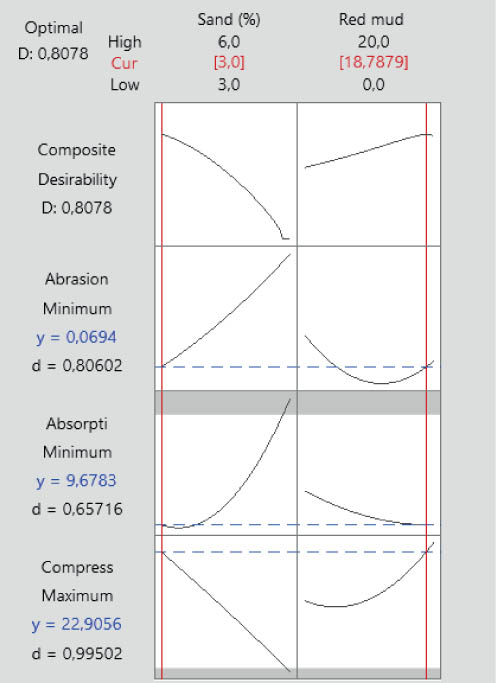
FIGURE 8.
Optimum plot
Source: own work.
Validity and implications. This section will examine the validity of the results derived from the optimization model, considering how well the model fits the data and the assumptions made during the analysis. By understanding both the validity of the findings and their implications, manufacturers can make informed decisions on optimizing their production processes for enhanced product performance while achieving sustainability goals (Aslami, 2023).
Figures 9–11 present the comparison between experimental results and RSM predictions for compressive strength, water absorption, and abrasion resistance of paving blocks with varying red mud and sand contents. For compressive strength, the RSM model closely follows the experimental trend, accurately identifying the peak strength region and the subsequent decline at higher replacement levels. Minor deviations occur where experimental values slightly exceed predictions, indicating that the model smooths localized variations arising from material heterogeneity and red mud–cement interactions.
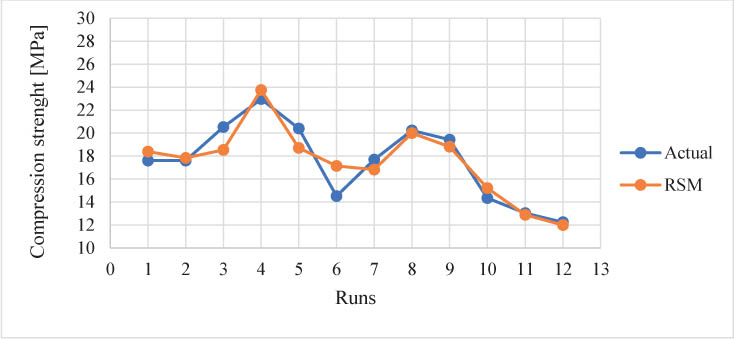
FIGURE 9.
Comparison plot of actual compression strength versus response surface methodology prediction
Source: own work.
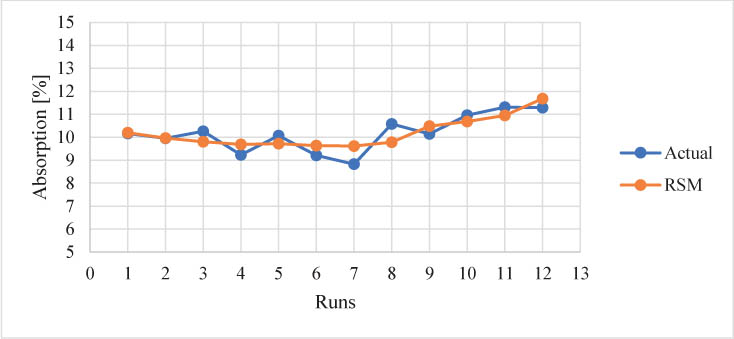
FIGURE 10.
Comparison plot of actual compression strength versus response surface methodology prediction
Source: own work.
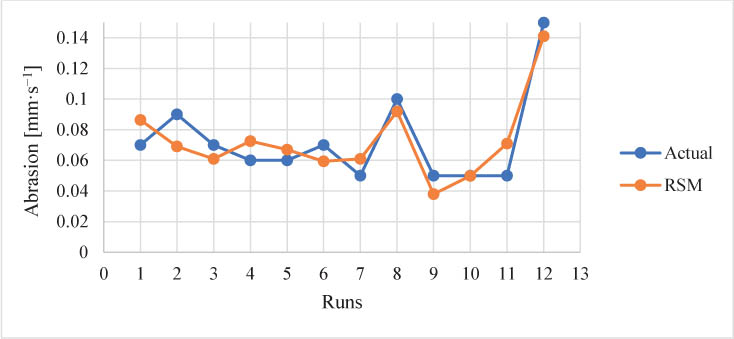
FIGURE 11.
Comparison plot of actual compression strength versus response surface methodology prediction
Source: own work.
For water absorption, strong agreement is observed between predicted and measured values, with both showing a consistent and gradual trend. This confirms that RSM effectively captures durability-related responses governed by pore structure and matrix continuity influenced by aggregate gradation and red mud content. Deviations remain within acceptable experimental limits.
In the case of abrasion resistance, the model reproduces the general trend, including increased abrasion loss at higher mix variations. Although slightly larger discrepancies appear at intermediate levels due to the sensitivity of surface integrity and microstructural defects, the predictions remain sufficiently accurate.
Overall, the close correspondence between experimental and predicted responses confirms that RSM is a reliable tool for multi-response optimization of red mud-based paving blocks, despite inherent limitations in modeling complex nonlinear material behavior.
Conclusion
This study confirms the feasibility of utilizing red mud as a partial replacement material in paving block production, in combination with optimized sand proportions, without compromising compliance with SNI 03-0691 requirements (BSN, 1996). Experimental results demonstrate that moderate incorporation of red mud enhances compressive strength while maintaining acceptable water absorption and abrasion resistance, supporting its use as a sustainable alternative material. The developed RSM models exhibit strong predictive capability, as evidenced by the close agreement between experimental and predicted responses, coefficients of determination (R2 and adjusted R2) generally exceeding 70–80%, and statistically valid residual distributions. Multi-response optimization using desirability functions, contour plots, and three-dimensional response surfaces identified an optimal mixture with approximately 18.79% red mud replacement and an optimized sand proportion of about 3%. This mixture yielded a 28-day compressive strength of approximately 22.9 MPa, corresponding to SNI Class B, water absorption of about 9.7%, and abrasion loss of approximately 0.07 mm·s−1. These performance levels indicate a balanced compromise between mechanical strength and durability. From a practical perspective, the optimized mixture is suitable for pedestrian and parking-area paving applications in tropical urban environments. Nevertheless, localized deviations between experimental and predicted values, particularly at higher red mud contents, highlight the limitations of RSM in capturing highly nonlinear material behavior. Therefore, the optimized range should be respected in practical implementation.
Future studies should investigate the long-term durability of red mud-based paving blocks under aggressive exposure conditions, including freeze–thaw cycles, sulfate attack, and carbonation, to better predict service life (Jaya et al., 2025). Additionally, life cycle assessment (LCA) and cost–benefit analysis are recommended to quantify the environmental and economic advantages of red mud utilization compared with conventional paving blocks. Finally, further research should focus on scaling up the optimized mix design to pilot-scale and field-produced paving blocks to evaluate manufacturing consistency, quality control, and in-service performance under real construction conditions.