
FIGURE 1.
FIGURE 2.
FIGURE 3.
FIGURE 4.
FIGURE 5.
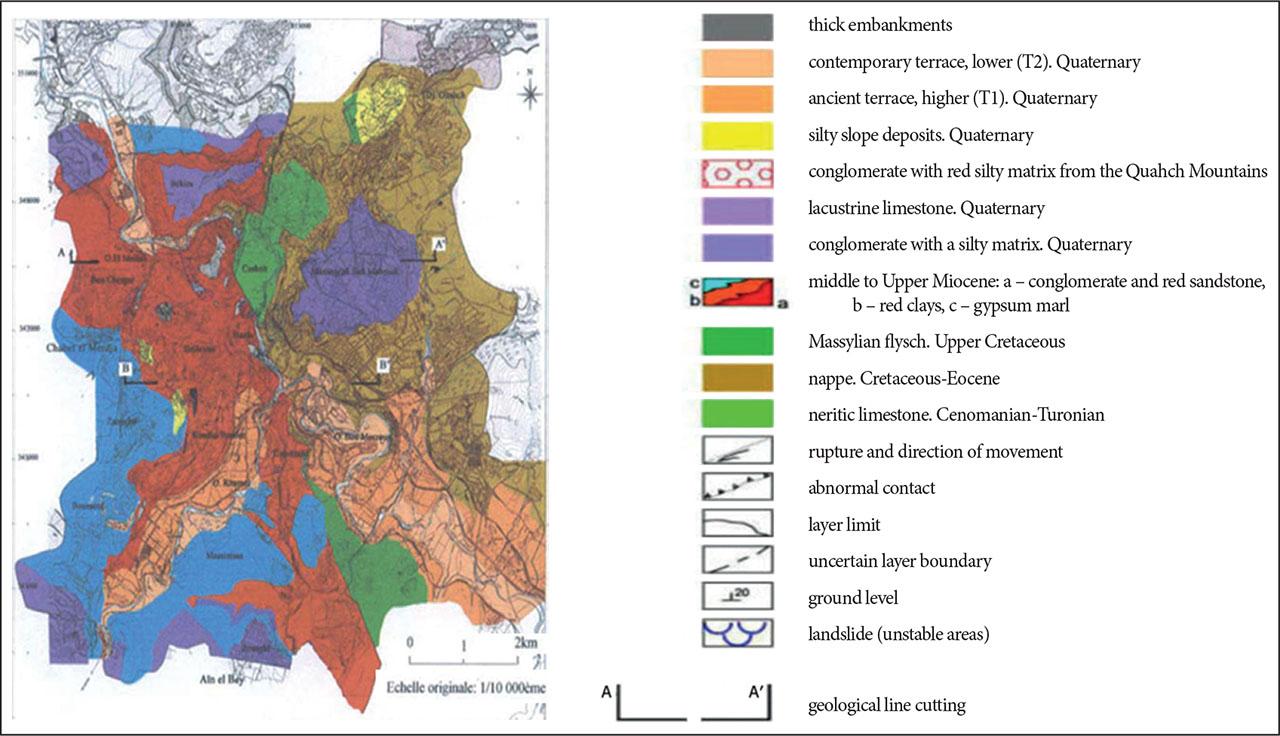
FIGURE 6.
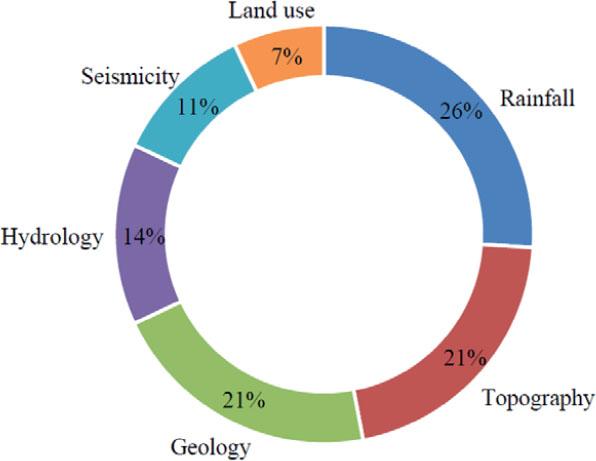
FIGURE 7.
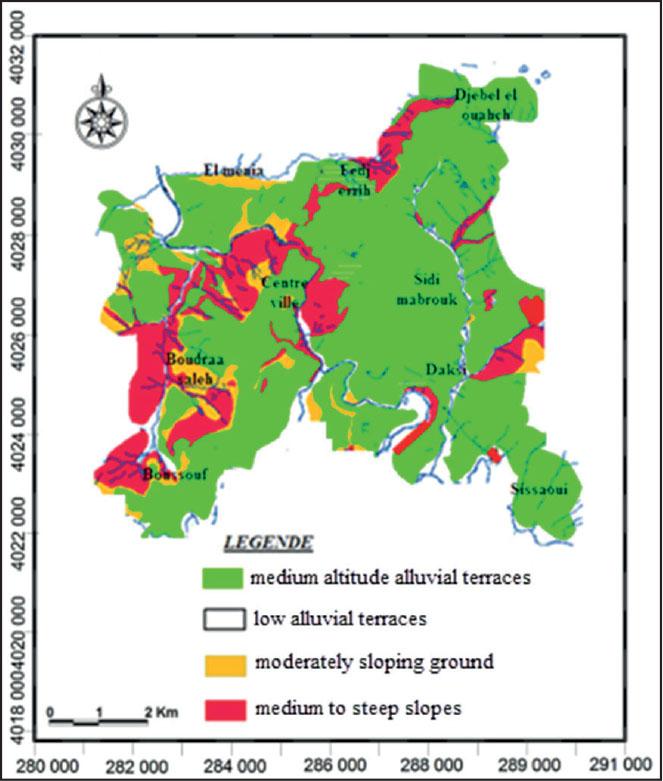
FIGURE 8.
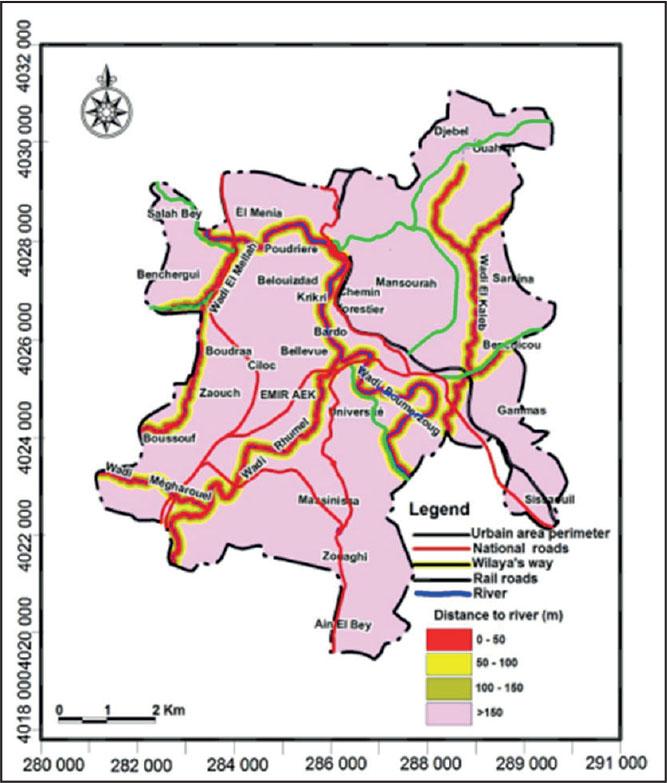
FIGURE 9.
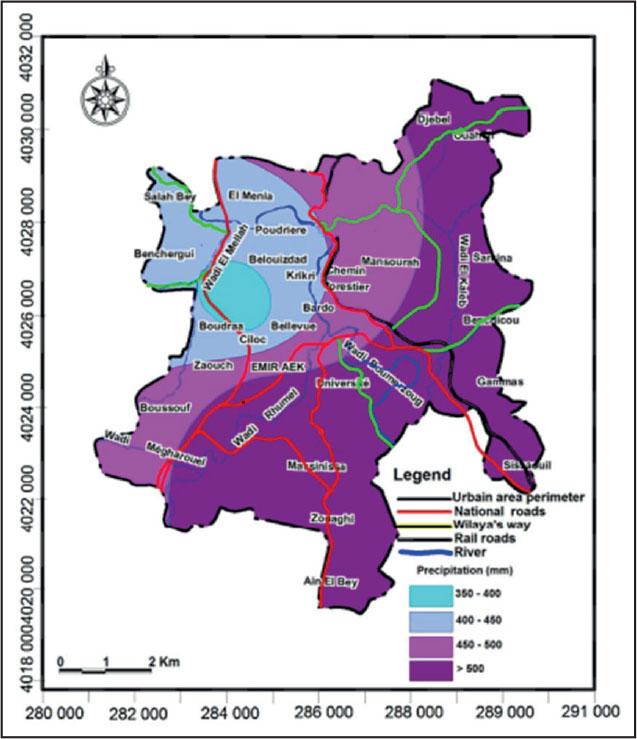
FIGURE 10.
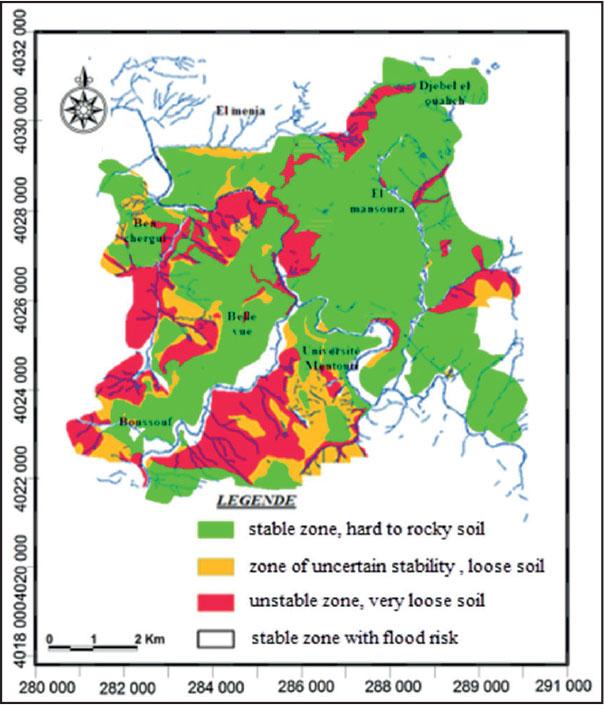
FIGURE 11.
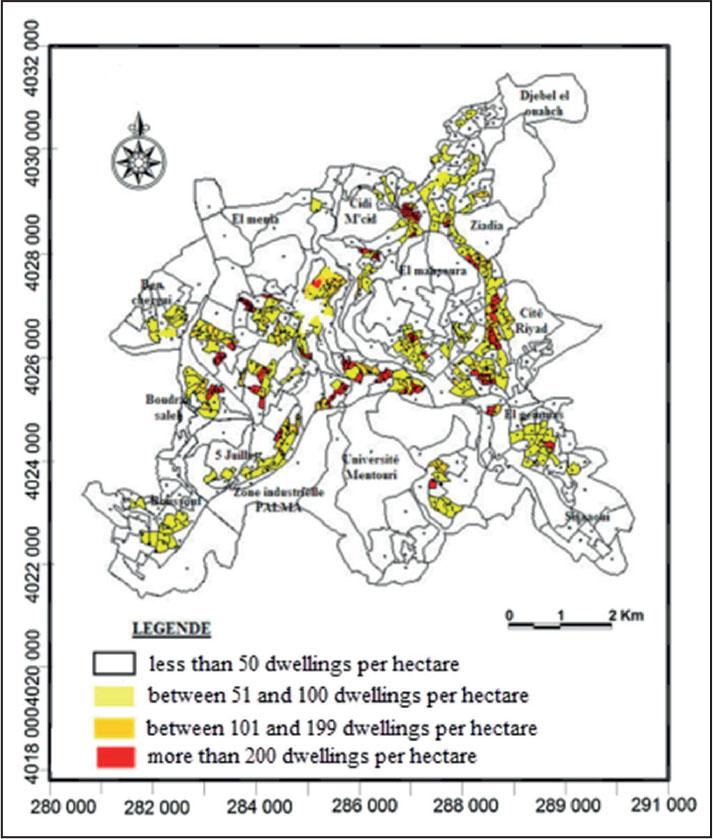
FIGURE 12.
Classification according to the rainfall parameter
| Index (RI1) = 1 | Index (RI2) = 2 | Index (RI3) = 3 |
|---|---|---|
| rainfall intensity < 50 mm | rainfall intensity between 50 and 100 mm / 24 hours | rainfall intensity > 100 mm / 24 hours |
| low risk | medium risk | high risk |
| green | orange | red |
Classification according to the slope of the land parameter
| Index (SLI1) = 1 | Index (SLI2) = 2 | Index (SLI3) = 3 |
|---|---|---|
| slope <15% | slope between 15% and 45% | slope >45% |
| low risk | medium risk | high risk |
| green | orange | red |
Classification according to the distance from watercourses parameter
| Index (HI1) = 1 | Index (HI2) = 2 | Index (HI3) = 3 |
|---|---|---|
| distance from watercourses more than 100 m | distance from watercourses between 50‒100 m | distance from watercourses less than 50 m |
| low risk | medium risk | high risk |
| green | orange | red |
Classification according to soil type
| Degree of risk of indices (SI) | SI1 = 1 | SI2 = 2 | SI3 = 3 |
|---|---|---|---|
| Ground instability | low | medium | high |
| Soil quality for construction | good | medium | bad |
| Color | green | orange | red |
Classification of the housing density index in the city of Constantine
| Index (CDI) dwelling | (CDI1) = 1 | (CDI2) = 2 | (CDI3) = 3 |
|---|---|---|---|
| Number of homes per 1 ha | 50‒100 | 100‒200 | >200 |
| Degree of risk | medium | high | very high |
| Color of risk | yellow | orange | red |