
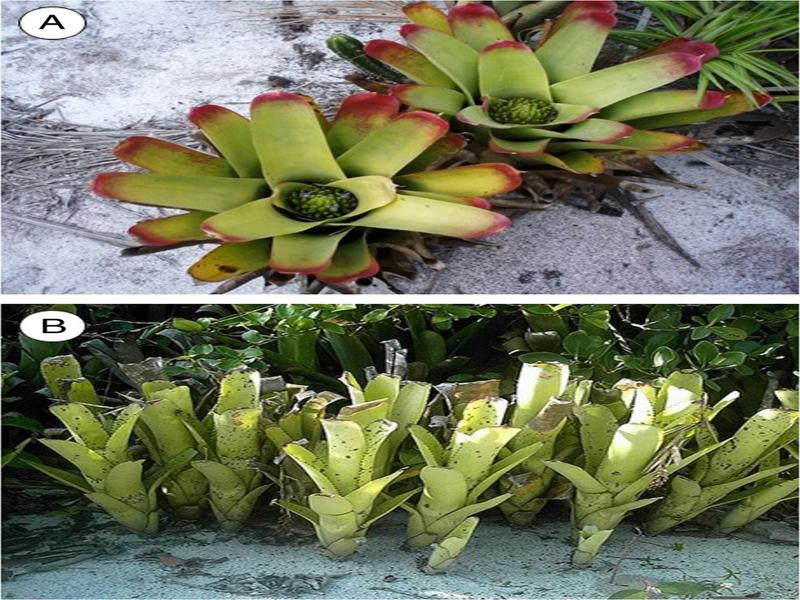
Figure 1:
Bromeliads sampled in Restinga de Jurubatiba National Park. (A) Neoregelia cruenta; (B) Aechmea nudicaulis.
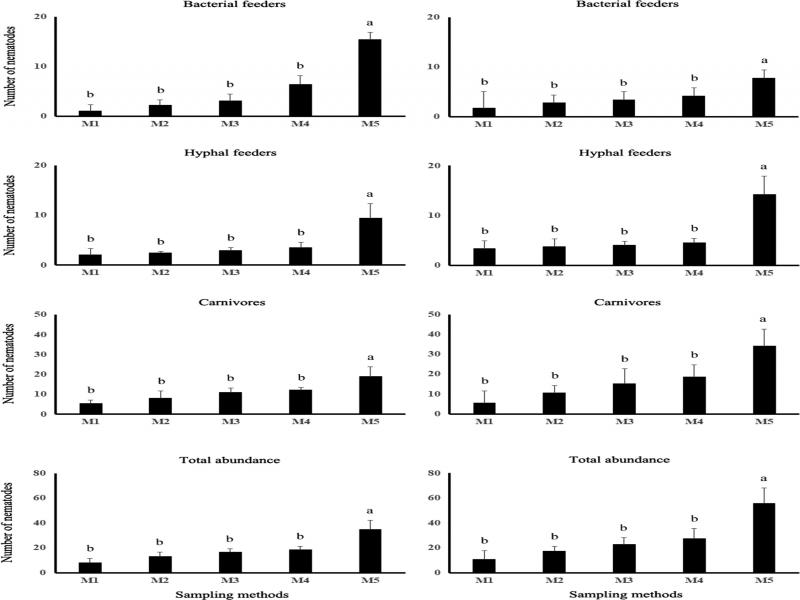
Figure S1.
Number of nematodes recovered by sampling methods M1 through M5 from the phytotelma of Aechmea nudicaulis (left graphs) and Neoregelia cruenta (right). Different lowercase letters indicate different means by the Tukey test at 5%. Values are means of 16 plants for each method and each bromeliad species.
Table S1.
Nematode abundance (total and per trophic groups) recovered from the phytotelma of mature N. cruenta and A. nudicaulis, in two phenological stages.
| Abundance | |||||
|---|---|---|---|---|---|
| Species/phenological stage | Total | Bacterial feeders | Hyphal feeders | Carnivores | |
| N. cruenta with inflorescence | 194.6aa | 42.1a | 48.8a | 103.7a | |
| N. cruenta without inflorescence | 139.6b | 15.2b | 22.3ab | 102.1a | |
| A. nudicaulis with inflorescence | 40.7c | 1.2b | 9.7b | 29.8b | |
| A. nudicaulis without inflorescence | 49.9c | 3.7b | 10.2ab | 36b | |
Table 1.
Descriptive statistics of nematode abundance (total and per trophic group) recovered from the phytotelma of N. cruenta.
| Abundance | ||||
|---|---|---|---|---|
| Statistics | Total | Bacterial feeders | Hyphal feeders | Carnivores |
| Mean (min–max) | 62.8a (1-534) | 30 (1-504) | 13.3 (0-201) | 14.2 (0-87) |
| SD | 14 | 15.6 | 47.7 | 11 |
| CV% | 22.3 | 52 | 358.6 | 77.5 |
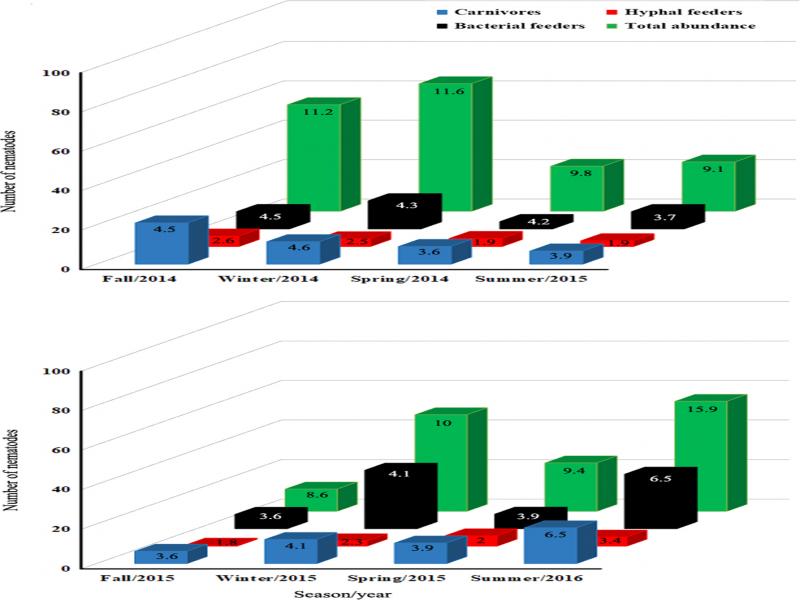
Figure 2:
Fluctuation of nematode abundance (total and per trophic group) during seasons in the phytotelma of N. cruenta. Numbers in the columns indicate the standard error of the mean. Values are means of eight bromeliads sampled per season.
Table S2.
Statistical parameters for the correlation analysis between nematode abundance and climate variables in the phytotelma N. cruenta.
| Statistical parameters | |||
|---|---|---|---|
| Abundance | p value | F test | r 2 |
| Rainfall | |||
| Total | 0.39 | 0.87 | 0.13 |
| Bacterial feeders | 0.78 | 0.08 | 0.01 |
| Hyphal feeders | 0.09 | 4.17 | 0.4 |
| Carnivores | 0.82 | 0.06 | 0.01 |
| Air temperature | |||
| Total | 0.97 | 0.001 | 0.0002 |
| Bacterial feeders | 0.77 | 0.09 | 0.02 |
| Hyphal feeders | 0.85 | 0.04 | 0.01 |
| Carnivores | 0.35 | 1.04 | 0.15 |
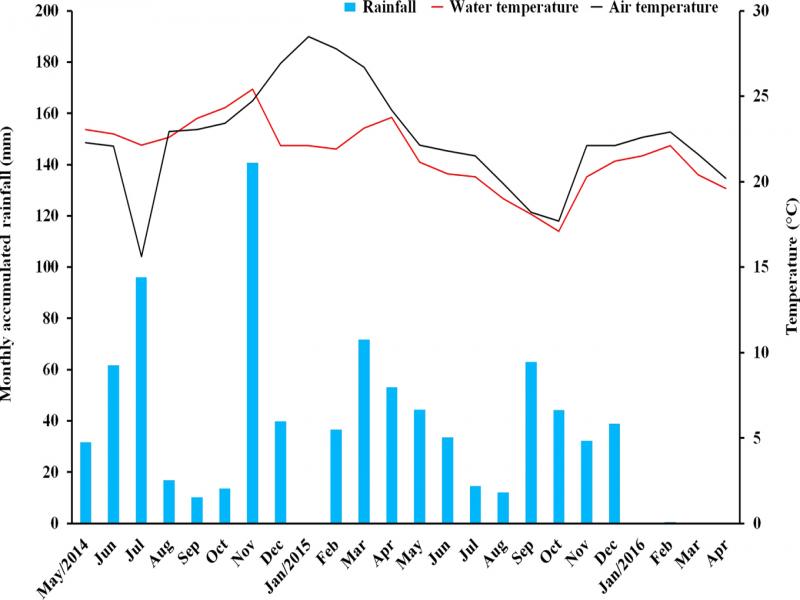
Figure 3:
Monthly accumulated rainfall and monthly mean temperatures (air and water retained in the bromeliad phytotelma) in Restinga de Jurubatiba National Park.
Table 2.
Descriptive statistics of impounded organic debris and physico-chemical variables of the water in the phytotelma of N. cruenta.
| Variables | |||||||||
|---|---|---|---|---|---|---|---|---|---|
| Statistics | ODa(g) | Volume (ml) | DOC (mg.L−1) | N (mg.L−1) | Temp (°C) | pH | DO2 (mg.L−1) | DS (mg.L−1) | EC (mS.cm−1) |
| Mean (min–max) | 13.7b (1–51) | 222.5 (37–910) | 97.4 (15.9–574) | 4.2 (0.1–12.8) | 22.1 (20–29) | 5.6 (3.5–8.1) | 5.7 (3.2–8) | 80 (8–247) | 0.1 (0.01–0.4) |
| SD | 10.4 | 157.8 | 108.5 | 2.9 | 2.6 | 0.7 | 1 | 56.6 | 0.1 |
| CV % | 75.8 | 71 | 111.4 | 68.2 | 11.7 | 12.5 | 17.6 | 70.7 | 72.7 |
1 Notes: aOD: Organic debris; DOC: Dissolved organic carbon; N: Nitrogen; Temp: Temperature; pH: Hydrogen potential; DO2: Dissolved oxygen; DS: Dissolved solids; EC: Electrical conductivity; SD: Standard deviation; CV%: Coefficient of variation. bValues are means of eight phytotelmata sampled every three months from June 2014 through March 2016, for a total of 64 samples.
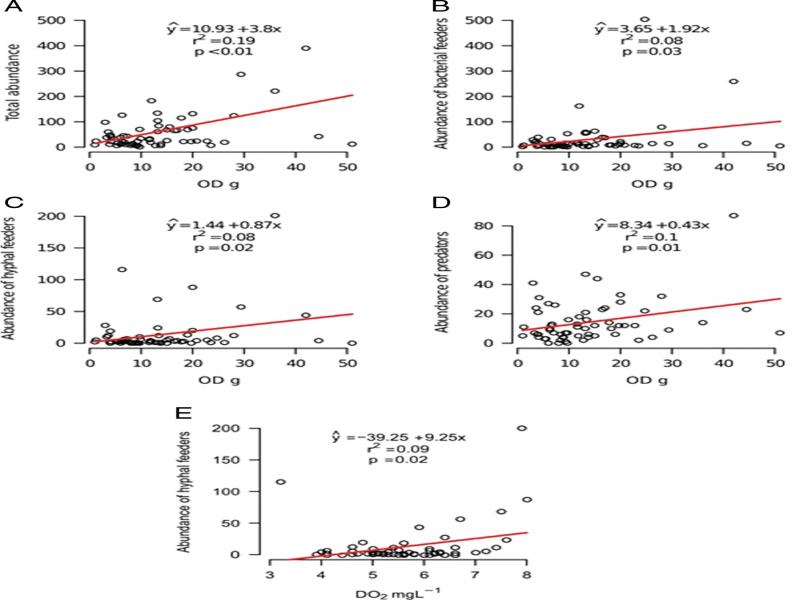
Figure 4:
Regression analysis between nematode abundance (total and per trophic group), organic matter impounded in the phytotelma, and physico-chemical variables of the water in the phytotelma of Neoregelia cruenta. OD: organic debris; DO2: Dissolved oxygen.