
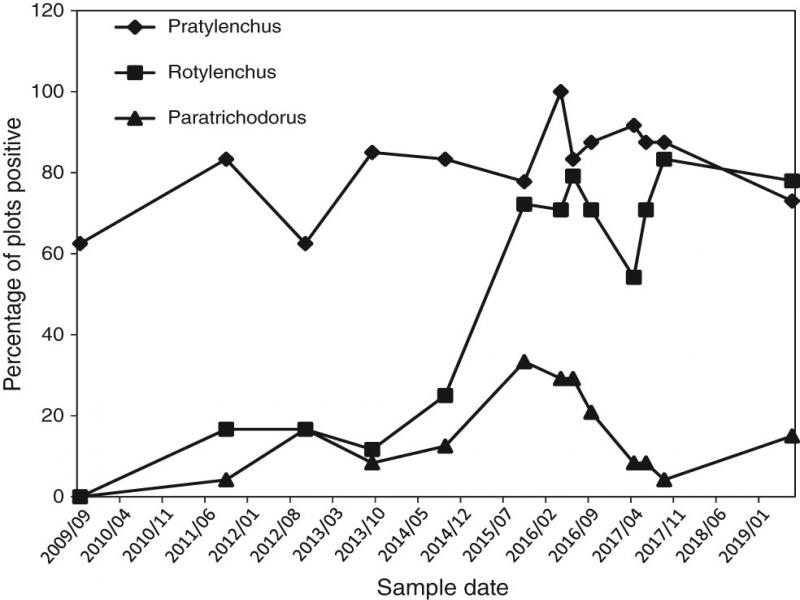
Highbush blueberry (Vaccinium corymbosum L.) is an economically important crop in British Columbia (BC) and the Pacific Northwest of North America. In BC, over 12,000 ha of blueberry fields yielded an average of 76,750 tons of marketable fruit over the 2014 to 2015 period (Statistics Canada, 2019). Several groups of plant-parasitic nematodes have been found to be associated with highbush blueberry in the region, with Pratylenchus and Paratrichodorus nematodes being the most frequently found genera (Zasada et al., 2010). Subsequent research assessed the pathogenicity of Paratrichodorus renifer, the most common Paratrichodorus species in blueberry plantations in BC (Forge et al., 2012), and documented the host parasite-relationship of Pratylenchus crenatus with highbush blueberry and weeds commonly found in blueberry plantations in the region (Zasada et al., 2017).
Optimal soil conditions and production practices for highbush blueberry differ from other perennial fruit crops grown in the region: The optimal soil pH for blueberry production, 4.5 to 5.2, is lower than for most other crops. Most commercial blueberry production also involves the use of sawdust mulch that helps to maintain low soil pH, suppress weeds, and moderate soil temperature and moisture regimes (BCMAL, 2020). Due in-part to the use of such carbon-rich mulches, most conventional blueberry production in the region depends on supplemental application of nitrogen (N) fertilizers to balance N immobilization and maintain productivity (Ehret et al., 2014; Messiga et al., 2018). The effects of N fertilizer application rates on blueberry productivity, fruit quality, and soil N dynamics have been the focus of previous research in the region (Ehret et al., 2014; Messiga et al., 2018).
Nitrogen fertilization may also influence diseases and pest populations that could in-turn have longer-term negative feedback effects on productivity of blueberry plantations. However, little is known of the effects of N fertilization on pests of blueberry. Previous research on the influences of N fertilization on genera or species of plant-parasitic nematodes of agronomic significance was focused primarily on natural grassland, pasture, forage, or cereal production systems (Dmowska and Ilieva, 1995; Todd, 1996; Sarathchandra et al., 2001; Verschoor et al., 2001; Forge et al., 2005a), and most of such studies reported an increase in population densities with increasing N fertilization rates. With respect to horticultural crops, Forge et al. (2019) reported an increase in population densities of Mesocriconema xenoplax with N fertilization rates to grapevines. Collectively, these results are consistent with theory and observations on responses of other invertebrate herbivores to plant N enrichment (Mattson, 1980; Mahdavi-Arab et al., 2014). In contrast, Azpilicueta et al. (2014) reported that N fertilization decreased population densities of Pratylenchus sp. in apple orchard plots relative to non-fertilized plots.
Nitrogen fertilization has also been commonly observed to suppress certain populations of free-living soil nematodes, particularly omnivores and predators in the Dorylaimida with ‘persister’ or K-selected traits, resulting in reduced indices of diversity and food web structure such as the nematode community structure index (e.g. Ferris et al., 2001; Forge et al., 2005b; Wang et al., 2006; Azpilicueta et al., 2014; Pan et al., 2015; Song et al., 2016). Such changes in soil food web structure have been theoretically associated with reduced capacity of the soil food web to provide pest-suppressive services, facilitating increased population densities of plant-parasitic species (Sánchez-Moreno and Ferris, 2007; McSorley et al., 2008; Ferris et al., 2012).
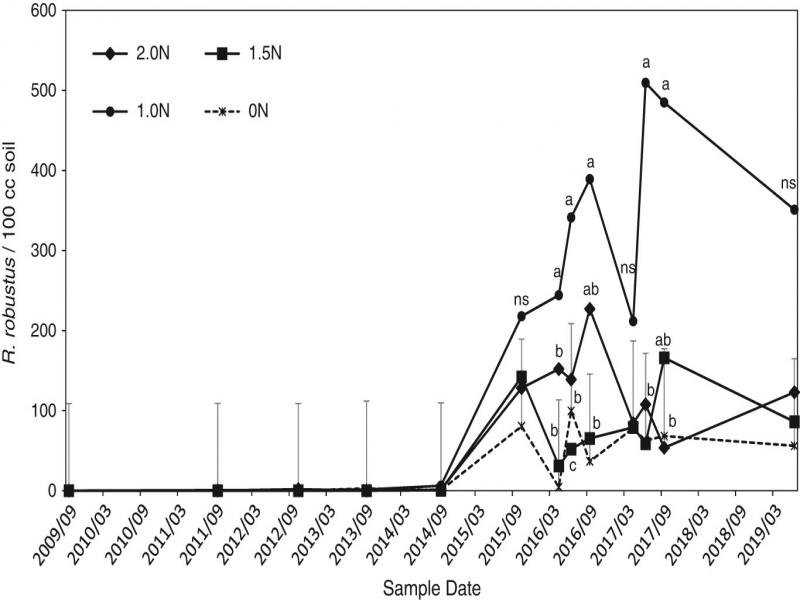
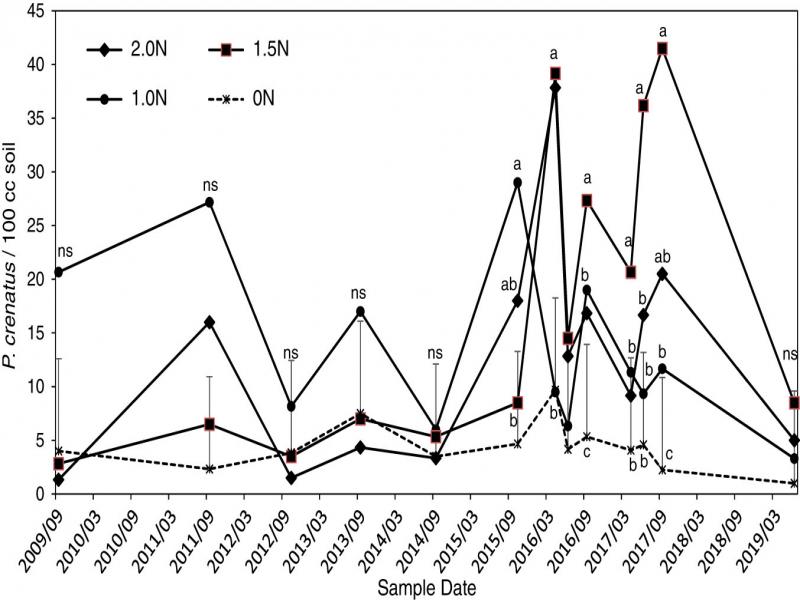
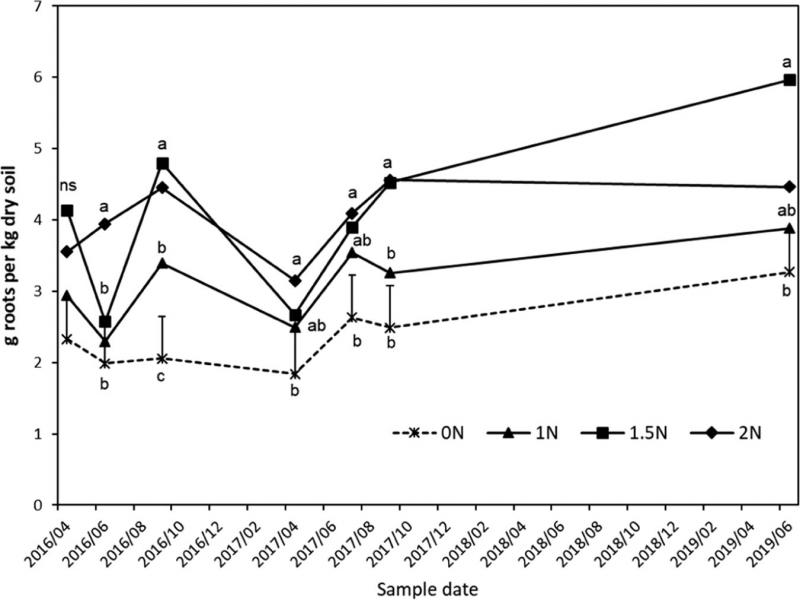
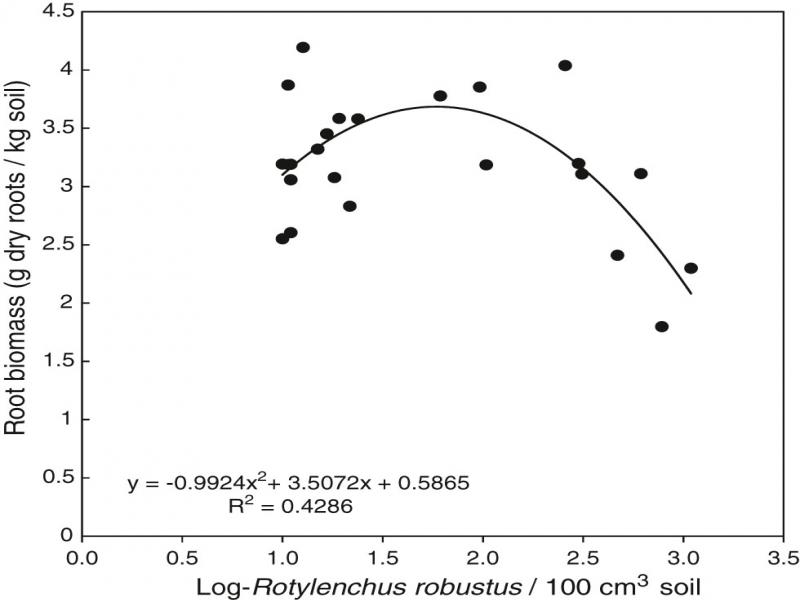
In 2009, a field experiment was established in BC to assess the multi-year effects of a range of N fertilizer application rates and application methods on blueberry productivity, fruit quality, soil chemical properties, and potential for nitrate leaching (Ehret et al., 2014; Messiga et al., 2018). This experiment presented an opportunity to also assess the effects of N fertilization on nematode populations under blueberry. Specifically, the objective of this research was to determine the effects of N fertilization on population densities of three species of plant-parasitic nematodes (Rotylenchus robustus, Pratylenchus crenatus, and Paratrichodorus renifer), root biomass, and indices of free-living soil nematode diversity and food web structure, under highbush blueberry.
Materials and methods
Study site
The 0.15-ha field of northern highbush blueberry (Vaccinium corymbosum L.) cv ‘Duke’ was planted in October, 2008 at the Agriculture and Agri-Food Canada, Agassiz Research and Development Centre, in Agassiz, British Columbia (lat. 49°14´33˝N, long. 121°45´35˝W). Over the preceding decade, the site was used for mixed-cropping, alternating between vegetable and forage crops. Soil at the site is a moderately well-drained Monroe series (eluviated eutric Brunisol) silt loam (Luttmerding and Sprout, 1967). At planting, soil organic matter was 5.27%, with 3.24% total organic carbon and 0.26% total N. The field was plowed and disked in the spring prior to planting and amended with elemental sulphur (0-0-0-90S; TerraLink Horticulture Inc., Abbotsford, BC) at a rate of 1,120 kg ha–1 to lower soil pH initially from 5.6 to 5.0. The field was then subsoiled and a bed shaper was used to create six blocks of five 1-m wide × 0.2-m high × 13 m long raised beds, with 3 m spacing between the row centers of the five beds in each block. Each bed was planted with 14 blueberry plants, with a 0.91 m spacing between plants. The plants were 2-yr-old container stock from a commercial nursery (JRT Nurseries, Abbotsford, BC). Approximately 8 cm of fresh western hemlock (Tsuga heterophylla Sarg.) and Douglas-fir (Pseudotsuga menziesii Franco) sawdust was applied on top of the beds as mulch, immediately after planting and reapplied in spring 2010, 2012, 2014, 2016, and 2018. All areas between and around the beds were seeded with a mix of 30% fescue and 70% perennial ryegrass (Alleyway Agricultural Mix, Richardson Seed, Abbotsford, BC).
Experimental design
Each bed was divided into two treatment plots of seven plants each, resulting in 10 plots in each of the six blocks. A total of 10 different fertilizer N treatments were applied to each of the six blocks of 10 plots as described in detail in Ehret et al. (2014) and Messiga et al. (2018). Only four of those treatments were sampled as part of this study. These treatments consisted of an unfertilized control (0N) and three levels of N applied at 50, 100, and 150% of rates recommended in the British Columbia Berry Production Guide (BCMAL, 2020) from 2009 through 2012. Commencing in 2013, the annual application rates in these three treatments shifted to 100, 150, and 200% of the rates recommended in the Production Guide due to realization that many growers in the region were using rates in excess of those recommended in the Production Guide (Table 1). By 2019, cumulative N inputs for these three treatments were 1,020, 1,573, and 2,126 kg N ha–1, and these four treatments are hereafter referred to as the 1N, 1.5N, and 2N treatments (Table 1). The N was applied as granular ammonium sulphate (21-0-0), broadcast on the surface of the sawdust mulch around the dripline of each plant in three equal split applications over an eight-week period each spring beginning at bud break (late April to early May).
Table 1.
Actual nitrogen application rates by year for the three fertilizer treatments sampled in this study, in relation to rates recommended for blueberry production in British Columbia (BCMAL, 2020).
| Nitrogen application rates (kg N ha–1) | ||||||||||||
|---|---|---|---|---|---|---|---|---|---|---|---|---|
| 2009 | 2010 | 2011 | 2012 | 2013 | 2014 | 2015-2019 | ||||||
| 1N | 11 | 14 | 25 | 39 | 100 | 111 | 144 | |||||
| 1.5N | 22 | 29 | 50 | 79 | 151 | 167 | 215 | |||||
| 2N | 32 | 43 | 75 | 118 | 201 | 222 | 287 | |||||
| Recommended | 22 | 29 | 50 | 79 | 100 | 111 | 144 | |||||
| Date | April 2017 | June 2017 | September 2017 | |||||||||
|---|---|---|---|---|---|---|---|---|---|---|---|---|
| Treatment | 0N | 1N | 1.5N | 2N | 0N | 1N | 1.5N | 2N | 0N | 1N | 1.5N | 2N |
| Ditylenchus | 91 (48) | 154 (58) | 109 (33) | 135 (61) | 50 (37) | 147 (240) | 81 (51) | 150 (225) | 96 (38) | 124 (73) | 65 (25) | 73 (37) |
| Acrobeloides | 43 (43) | 104 (77) | 69 (31) | 98 (80) | 41 (28) | 166 (286) | 117 (54) | 109 (97) | 31 (10) | 77 (51) | 81 (24) | 68 (68) |
| Rhabditidae | 23 (18) | 62 (78) | 52 (52) | 39 (42) | 46 (23) | 62 (100) | 26 (23) | 26 (20) | 35 (39) | 16 (13) | 17 (11) | 17 (21) |
| Aphelenchoides | 59 (37) | 66 (68) | 51 (21) | 42 (8) | 22 (16) | 26 (25) | 14 (14) | 19 (21) | 34 (23) | 25 (12) | 15 (13) | 10 (7) |
| Filenchus | 26 (11) | 43 (35) | 22 (17) | 15 (21) | 22 (24) | 8 (5) | 5 (4) | 3 (3) | 27 (26) | 51 (34) | 12 (13) | 4 (6) |
| Cervidellus | 23 (23) | 51 (47) | 28 (39) | 14 (17) | 13 (25) | 42 (72) | 5 (8) | 4 (7) | 16 (13) | 23 (16) | 8 (4) | 5 (6) |
| Alaimus | 9 (10) | 7 (7) | 3 (6) | 1 (2) | 21 (18) | 7 (7) | 13 (10) | 5 (6) | 24 (16) | 15 (19) | 5 (5) | 4 (7) |
| Plectus | 14 (11) | 17 (20) | 19 (13) | 7 (12) | 4 (7) | 1 (2) | 3 (7) | 0 | 9 (9) | 2 (3) | 0 | 2 (5) |
| Clarkus | 4 (10) | 7 (12) | 2 (3) | 0 | 5 (6) | 9 (14) | 1 (3) | 0 | 10 (8) | 12 (24) | 1 (2) | 1 (2) |
| Prismatolaimus | 11 (6) | 9 (12) | 1 (3) | 0 | 3 (5) | 0 (1) | 0 | 4 (8) | 9 (13)) | 1 (3) | 1 (2) | 1 (1) |
| Aphelenchus | 3 (10) | 0 | 1 (3) | 1 (2) | 1 (1) | 6 (15) | 0 | 0 | 1 (2) | 1 (2) | 2 (3) | 1 (2) |
| Teratocephalus | 6 (9) | 1 (2) | 1 (3) | 3 (5) | 0 (1) | 1 (2) | 0 | 0 | 0 (1) | 0 | 0 | 0 |
| Seinura | 1 (1) | 0 | 3 (4) | 0 | 0 (1) | 1 (2) | 1 (3) | 3 (8) | 0 (1) | 2 (4) | 1 (2) | 0 |
| Panagrolaimidae | 1 (2) | 5 (13) | 2 (3) | 2 (5) | 0 | 0 | 0 | 0 | 0 | 0 | 0 | 1 (2) |
| Thonus | 3 (5) | 0 | 0 | 0 | 1 (1) | 0 | 3 (8) | 0 | 1 (3) | 2 (4) | 0 | 0 |
| Heterocephalobus | 1 (3) | 0 | 0 | 0 | 1 (3) | 1 (2) | 1 (2) | 0 | 1 (2) | 0 | 1 (1) | 0 |
| Tylencholaimus | 1 (2) | 0 | 0 | 0 | 1 (2) | 0 | 0 | 0 | 4 (6) | 0 | 0 | 0 |
| Achromadora | 3 (8) | 0 | 1 (3) | 0 | 0 (1) | 1 (1) | 0 | 0 | 0 | 0 | 0 | 0 |
| Cephalobus | 0 | 0 | 0 | 0 (1) | 1 (3) | 0 | 0 | 0 | 1 (3) | 2 (4) | 0 | 1 (1) |
| Monhysteridae | 2 (3) | 0 | 0 | 0 | 1 (2) | 0 | 0 | 0 | 1 (3) | 0 (1) | 0 | 0 |
| Diphtherophora | 0 | 0 | 0 | 0 | 0 | 0 | 0 | 0 | 0 | 4 (10) | 0 | 0 |
| Diplogasteridae | 1 (2) | 1 (3) | 0 | 1 (2) | 0 (1) | 0 | 0 | 0 | 0 | 0 | 0 | 0 |
| Tylenchus | 0 | 0 | 1 (3) | 0 | 2 (3) | 0 | 0 | 0 | 0 (1) | 0 | 0 | 0 |
| Pungentus | 0 (1) | 0 | 0 | 0 | 1 (2) | 0 | 2 (5) | 0 | 0 | 0 | 0 | 0 |
| Nygolaimus | 0 | 0 | 0 | 0 | 0 | 0 | 0 | 0 | 0 (1) | 2 (5) | 0 | 0 |
| Acrobeles | 0 | 2 (4) | 0 | 0 | 1 (2) | 0 | 0 | 0 | 0 | 0 | 0 | 0 |
| Rhabdolaimus | 0 | 0 | 1 (3) | 0 | 0 | 0 | 0 | 0 | 0 (1) | 0 | 0 | 0 |
| Aporcelaimellus | 0 | 0 | 0 | 0 | 0 | 0 | 0 | 0 | 0 | 1 (2) | 0 | 0 |
| Cylindrolaimus | 0 (1) | 0 | 0 | 0 | 0 | 0 | 0 | 0 | 0 | 0 | 0 | 0 |
| Leptonchidae | 0 (1) | 0 | 0 | 0 | 0 | 0 | 0 | 0 | 0 | 0 | 0 | 0 |
| Eucephalobus | 0 (1) | 0 | 0 | 0 | 0 | 0 | 0 | 0 | 0 | 0 | 0 | 0 |
| Chiloplacus | 0 (1) | 0 | 0 | 0 | 0 | 0 | 0 | 0 | 0 | 0 | 0 | 0 |
| Ecumenicus | 0 | 0 | 0 | 0 | 0 | 0 | 0 | 0 | 0 (1) | 0 | 0 | 0 |
| Anguinidae | 0 | 0 | 0 | 0 | 0 | 0 | 0 | 0 | 0 (1) | 0 | 0 | 0 |
| Trophic groups (nematodes/100 cm 3 soil) and community structure indices | ||||||||||||
| Bacterivorous | 138 (98) | 259 (214) | 179 (45) | 165 (123) | 133 (78) | 282 (452) | 165 (56) | 148 (94) | 128 (72) | 137 (69) | 112 (29) | 98 (47) |
| Fungivorous | 180 (60) | 262 (106) | 185 (43) | 193 (68) | 96 (61) | 186 (276) | 99 (48) | 171 (242) | 162 (66) | 204 (96) | 94 (37) | 89 (44) |
| Omni+Predsa | 8 (11) | 7 (12) | 5 (4) | 0 | 6 (6) | 10 (15) | 8 (9) | 3 (8) | 12 (8) | 17 (28) | 2 (2) | 1 (2) |
| Enrichment Index | 51 (9) | 51 (10) | 55 (12) | 53 (10) | 67 (12) | 52 (11) | 46 (15) | 53 (8) | 56 (10) | 46 (4) | 45 (12) | 46 (11) |
| Structure Index | 41 (10) | 25 (15) | 23 (12) | 12 (11) | 54 (19) | 32 (14) | 29 (11) | 17 (13) | 52 (13) | 46 (10) | 21 (14) | 13 (13) |
| Channel Index | 66 (19) | 61 (27) | 50 (21) | 60 (24) | 30 (17) | 50 (21) | 54 (21) | 51 (31) | 56 (19) | 70 (18) | 58 (12) | 64 (25) |
| Shannon Diversity | 7.30 (1.11) | 5.66 (1.65) | 5.97 (0.88) | 4.66 (1.15) | 6.79 (1.15) | 6.46 (1.22) | 4.94 (1.25) | 3.99 (0.80) | 7.51 (1.92) | 7.33 (2.48) | 5.37 (1.09) | 4.67 (1.01) |
| Simpson Diversity | 5.51 (1.04) | 4.60 (1.58) | 4.72 (0.70) | 3.82 (0.98) | 5.42 (1.00) | 5.12 (1.10) | 3.91 (1.07) | 3.17 (0.73) | 5.78 (1.79) | 4.69 (1.80) | 4.24 (1.02) | 3.69 (0.84) |
| Treatment | S–W | Simpson | SI | EI | CI | O + P | Bact | Fung |
|---|---|---|---|---|---|---|---|---|
| 0N | 7.02aa | 5.57a | 49a | 58a | 51 | 9ab | 133 | 146 |
| 1N | 6.48a | 4.90ab | 35b | 49b | 60 | 11a | 226 | 218 |
| 1.5N | 5.43b | 4.36b | 24c | 49b | 54 | 5bc | 152 | 126 |
| 2N | 4.44c | 3.51c | 14d | 50b | 58 | 1c | 137 | 151 |
| ANOVA summary (p-values) b | ||||||||
| Treatment | < 0.001 | < 0.001 | < 0.001 | 0.004 | 0.39 | 0.004 | 0.18 | 0.09 |
| Date | 0.21 | 0.57 | 0.05 | 0.07 | 0.002 | 0.47 | 0.19 | 0.04 |
| T × D | 0.57 | 0.80 | 0.29 | 0.05 | 0.18 | 0.67 | 0.91 | 0.70 |