
In the United States, corn and soybean are among the most important crops, comprising 36.0 and 36.2 million hectares, respectively, in 2018, which was 55.5% of total area planted to principal crops (NASS-USDA, 2018). Since these crops cover such a large area, identifying management practices in corn and soybean production that promote sustainability (productivity over time while conserving natural resources) is an important goal. Nematodes play an important role in sustainability because management of plant-parasitic nematodes is necessary to optimize crop productivity (Grabau and Chen, 2016a, 2016b) and non-parasitic, free-living nematodes contribute to and are sensitive indicators of soil fertility and ecology (Bongers, 1990; Ferris et al., 2001).
In particular, soybean cyst nematode (Heterodera glycines) is the major yield-limiting pest in soybean production (Koenning and Wrather, 2010). Additional strategies to manage this pest are needed because management relies on a narrow set of practices including corn-soybean crop rotation (Grabau and Chen, 2016a, 2016b) and use of resistant cultivars (Chen et al., 2001), most of which are derived from a single parent source. Swine manure application is one alternative strategy as it has been shown to suppress soybean cyst nematode (SCN) through release of nematicidal compounds in greenhouse studies (Xiao et al., 2007, 2008). Additionally, swine manure and other fertilizers may improve crop production and tolerance to nematode infection by improving soil fertility and quality (Bao et al., 2013). In addition to physical and chemical components provided by fertilizers, biological components, such as free-living nematodes and the soil-dwelling organisms associated with them, are important contributors to soil nutrient cycling and quality. Fertilizer application may influence soil ecology and the nematode community because it provides an influx of nutrients and other compounds. Application of animal manures or plant-based fertilizers may influence soil ecology in a different manner than conventional fertilizers. Unlike conventional fertilizers, manures and plant-based fertilizers contain carbon sources that stimulate population growth of soil-dwelling organisms (Hernandez et al., 2007). When manures are applied, plant-available nutrients are released over multiple seasons and organic material may persist for an extended period of time (Diaz et al., 2012), so the residual impact of manure application on soil ecology over multiple seasons is of interest.
The influence of fertilizers on soil ecology in corn-soybean crop rotation systems is of interest because rotation with corn or SCN-resistant soybean is the main SCN management strategy and soil community response to fertilizers may vary by crop. In particular, both nutrient uptake (Halvorson and Schlegel, 2012) and root exudate profiles (Wagner and Broder, 1993) differ between corn and soybean, so nutrients and compounds available to the soil nematode and microbial community may vary by crop. Soil structure, plant residue volume and nutrient content, soil moisture, and other factors also vary between corn and soybean (Wagner and Broder, 1993; Nickel et al., 1995; Pedersen and Lauer, 2004; Halvorson and Schlegel, 2012) which may influence soil community responses to fertilizer application. Because of these factors, corn and soybean can also directly influence nematode community composition with corn stimulating fungivore population growth but soybean stimulating bacterivore population growth, particularly after multiple years of monoculture (Grabau and Chen, 2016c).
The long-term aim of this study was to improve sustainability of corn-soybean systems by identifying alternative strategies to suppress SCN, reduce crop damage from SCN, improve crop yield, and improve or maintain biological components of soil quality. Plant-parasitic nematode management and crop yield results from the study were reported in a previous paper (Bao et al., 2013). This paper primarily focuses on the influence of fertilizer application and crop rotation on components of soil quality. Previously reported studies in the region have investigated the impact of swine manure or conventional synthetic or mined nitrogen (N) – phosphorus (P) – potassium (K) – sulfur (S) fertilizer and nematicide application in combination with conventional or conservation tillage (Grabau et al., 2018) as well as long-term corn and SCN-susceptible soybean crop sequences crossed with nematicide application on the nematode community (Grabau and Chen, 2016c). The specific objectives of this study are to assess the simple and interactive effects of fertilizer application (swine manure and conventional PK fertilizer) and short-term crop sequences on the nematode community. Specific hypotheses included: (i) manure application provides carbon sources to the nematode community that conventional PK fertilizer or no fertilizer does not resulting in an enrichment of the nematode community; (ii) short-term crop sequences do not influence the soil environment enough to impact the nematode community within the two-year scope of this study; and (iii) short-term crop sequences and fertilizer application have an interaction effect on the nematode community, particularly that soybean cropping enhances the enrichment effects of swine manure.
Materials and Methods
Experimental design
Data for this study were collected from the same field experiments described in the study of Bao et al., (2013), and conducted from 2009 to 2010 in Waseca, MN. Experiments were conducted at sites with varying levels of SCN suppression (Bao et al., 2013). The sites were an SCN-suppressive site (S-site) where SCN abundances on SCN-susceptible soybean have been much less than average compared with similar fields in the region (Bao et al., 2011) and an SCN-conducive site (C-site). The level of suppressiveness at the two field sites has been previously assessed in greenhouse assays (Chen, 2007; Bao et al., 2011) and greenhouse tests demonstrated that suppressiveness to SCN at the S-site was partly due to soil microbes (Bao et al., 2011).
The S-site (44° 04′ 21″ N, 93° 31′ 24″ W) is a Nicollet clay loam (fine loamy, mixed, mesic Aquic Hapludoll). The C-site (44° 05′ 30″ N, 93° 32′ 47″ W) is a Webster clay loam (fine loamy, mixed, mesic Endoaquoll). At each site, the experiment was a randomized complete block design in a split-plot arrangement with four replicates. The main plot factor was crop sequence and the subplot factor was fertilizer. The crop sequence treatments were (i) SCN-susceptible soybean (Sus), (ii) SCN-resistant soybean (Res), or (iii) corn in 2009 followed by susceptible soybean in 2010. The fertilizer treatments were (i) liquid swine manure (manure), (ii) conventional P-K fertilizer (PK), and (iii) no fertilizer applied in 2009. The manure (37.4 m3 manure/ha or 239 kg total N/ha + 26 kg P/ha + 112 kg K/ha) was injected 10 cm under the soil at 76 cm spacing and crops were planted directly over the injected area in 2009. Conventional PK fertilizer was applied to the surface of the soil at 49 kg P/ha and 93 kg K/ha and incorporated with tillage before planting in 2009. Nitrogen was not included in the conventional fertilizer application because growers do not typically apply nitrogen to soybean, which fixes its own nitrogen. None of the plots received fertilizer in 2010. Conventional tillage practices were employed in the fall at both sites.
Soil sampling and nematode community quantification
A composite soil sample was collected from each plot. For each sample, 20 soil cores were taken at 0 to 20 cm depth in the two central rows of the plot with a 2-cm-diameter soil probe. Plots were sampled at four different times: (i) before fertilizer application and planting, (ii) 45 d after planting (DAP) – in 2009 only, (iii) midseason – around two months after planting, and (iv) harvest. Soil was stored at 10 °C and processed for nematodes within 2 d.
Soil samples were mixed by manually pushing samples through a metal screen with 4 mm square apertures. Nematodes were extracted from a 100 cm3 soil subsample for each plot by hand-decanting and sucrose centrifugation (Jenkins, 1964). Subsequently, vermiform plant-parasitic and free-living nematodes were identified to genera morphologically by microscope and quantified. Abundances (nematodes/100 cm3 soil) of herbivores, bacterivores, fungivores, and omnivores/predators were calculated (Yeates et al., 1993). Herbivores consisted primarily of SCN and spiral nematodes, which have the potential to cause an economically important level of damage, as well as nematodes in the Suborder Tylenchinae or Family Psilenchidae, which are not thought to cause an economically important level of damage to crops. Abundances of nematode feeding guilds were also calculated, for use in select analyses, based on feeding groups and Bongers (1990) colonizer-persister (c-p) scale.
Various nematode community indices were also calculated based on abundances and ecological niches of nematodes in each plot. These indices included ratio of fungivore and bacterivores to herbivores (FBPP), Shannon–Weaver diversity index (Shannon, 1948), structure index (SI), channel index (CI), and enrichment index (EI). Briefly, the structure index measures the number of trophic links in the food web with higher values indicating a more structured food web (Ferris et al., 2001). The enrichment index measures food web enrichment based on the weighted relative abundance of colonizer nematodes (Ferris et al., 2001). The channel index (Ferris et al., 2001) measures fungal decomposition channels (greater values) relative to bacterial (lesser values). FBPP is an indicator of whether overall impact of the nematode community is positive or negative (Wasilewska, 1989).
Statistical analysis
Data were analyzed separately for each season because treatment effects varied by season, but combined between sites. Dependent variables were evaluated for normality and homogeneity of variance and nematode abundances were transformed by natural log before analysis while nematode community indices were not transformed. A modified three-factor (site by crop sequence by fertilizer) ANOVA, for combining two split-plot experiments (Carmer et al., 1989), was conducted for each response variable. Site main effects were treated as random effects and were included as a source of variation, but not tested for significance (Carmer et al., 1989). Site was treated as a random factor, but site by crop sequence and fertilizer interactions were treated as fixed effects and tested for significance to determine if crop sequence and fertilizer effects were consistent from site to site. A level of α = 0.05 was used for determining significance in ANOVA models and separating fertilizer or crop sequence treatments using Fisher’s protected LSD. Data were analyzed using R version 3.0 (The R Foundation for Statistical Computing, Vienna, Austria).
Results
Trophic group abundances
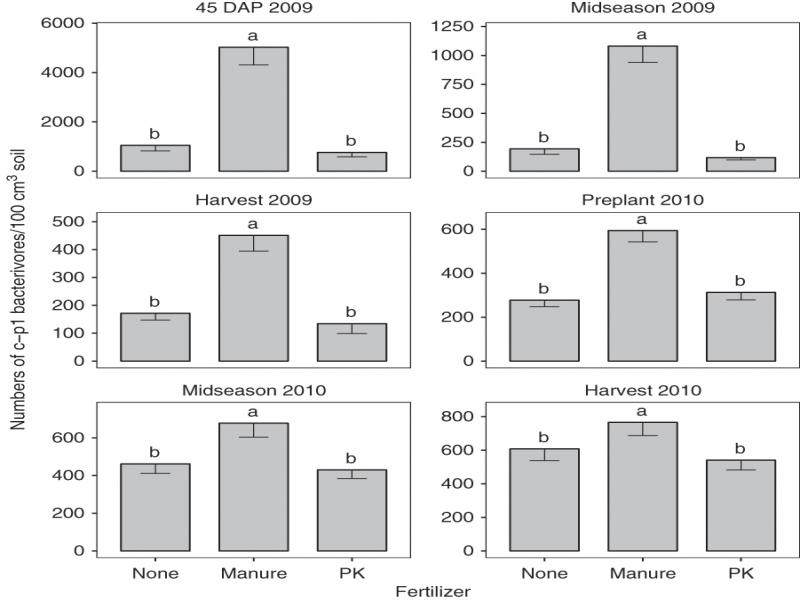
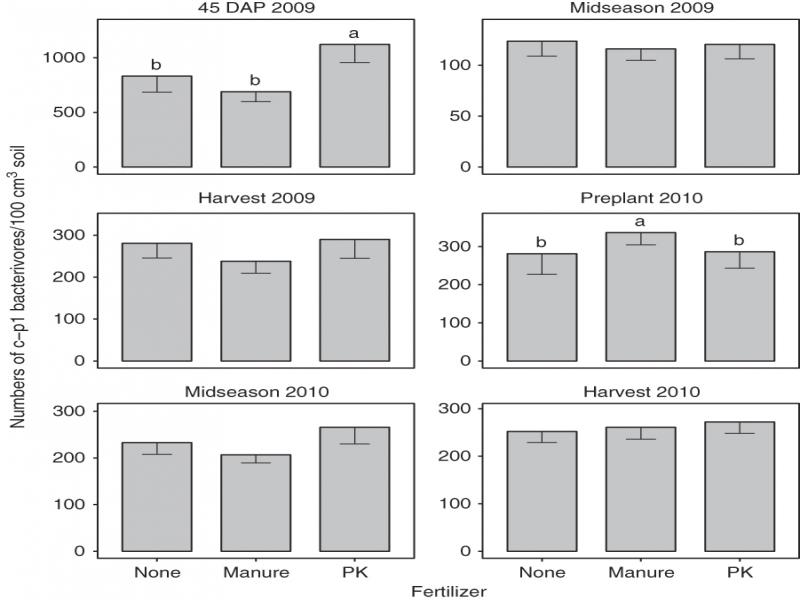
Bacterivore abundances were significantly affected by crop sequence in Fall 2009 and Spring 2010 with abundances greater for resistant soybean than corn or susceptible soybean (Table 1). Manure consistently increased bacterivore abundances compared with no fertilizer or chemical fertilizers from 45 DAP 2009 through Midseason 2010 (Table 1). This trend was driven primarily by c-p1 bacterivores as manure consistently increased abundances of this group compared with no fertilizer or chemical fertilizers (Fig. 1), but generally did not affect c-p2 bacterivores (Fig. 2) and there were very few bacterivores belonging to any other guild.
Table 1
Effects of crop sequence and fertilizer on bacterivore abundances by sampling date combined across SCN-conducive and suppressive sites.a
| 2009 | 2010 | |||||||||||||
|---|---|---|---|---|---|---|---|---|---|---|---|---|---|---|
| Pi | b | P45d | Pm | Pf | Pi | Pm | Pf | |||||||
| Crop sequence c | ||||||||||||||
| Corn-Sus | 1,077 | 3,056 | 601 | 309 | C | 545 | B | 743 | 962 | |||||
| Res-Sus | 1,020 | 2,923 | 523 | 732 | A | 830 | A | 846 | 968 | |||||
| Sus-Sus | 1,125 | 3,500 | 628 | 525 | B | 715 | AB | 698 | 888 | |||||
| Fertilizer | ||||||||||||||
| None | 1,070 | 1,879 | b | 316 | b | 453 | b | 560 | b | 700 | b | 916 | ||
| Manure | 1,057 | 5,716 | a | 1,198 | a | 690 | a | 931 | a | 887 | a | 1,053 | ||
| PK | 1,095 | 1,883 | b | 237 | b | 424 | b | 599 | b | 700 | b | 849 | ||
| ANOVA (F-value) | ||||||||||||||
| Crop (C) | 0.30 | 0.11 | 0.49 | 24.39 | ** | 4.83 | * | 0.70 | 0.33 | |||||
| Site (S) × C | 0.38 | 0.62 | 0.72 | 0.30 | 2.53 | 0.31 | 0.68 | |||||||
| Fertilizer (F) | 0.34 | 28.23 | ** | 70.73 | ** | 13.08 | ** | 24.70 | ** | 3.72 | * | 2.32 | ||
| S × F | 1.92 | 0.85 | 0.15 | 0.30 | 1.01 | 1.48 | 0.17 | |||||||
| F × C | 0.64 | 1.42 | 2.34 | 2.44 | 2.55 | 0.35 | 1.52 | |||||||
| S × F × C | 3.62 | * | 0.52 | 0.47 | 0.52 | 1.06 | 0.84 | 0.35 | ||||||
| 2009 | 2010 | |||||||||||||
|---|---|---|---|---|---|---|---|---|---|---|---|---|---|---|
| Pi | b | P45d | Pm | Pf | Pi | Pm | Pf | |||||||
| Crop sequence c | ||||||||||||||
| Corn-Sus | 1,173 | 1,050 | 274 | B | 520 | 580 | B | 737 | 1,256 | A | ||||
| Res-Sus | 1,203 | 1,225 | 280 | B | 470 | 510 | B | 668 | 850 | B | ||||
| Sus-Sus | 1,186 | 1,265 | 361 | A | 604 | 783 | A | 710 | 728 | B | ||||
| Fertilizer | ||||||||||||||
| None | 1,193 | ab | 1,180 | a | 306 | 623 | 614 | 770 | 1,128 | a | ||||
| Manure | 1,024 | b | 958 | b | 299 | 478 | 628 | 655 | 848 | b | ||||
| PK | 1,345 | ab | 1,401 | a | 309 | 493 | 632 | 690 | 859 | b | ||||
| ANOVA (F-value) | ||||||||||||||
| Crop (C) | 0.36 | 0.95 | 4.54 | * | 2.74 | 10.98 | ** | 0.08 | 8.05 | ** | ||||
| Site (S) × C | 1.18 | 0.18 | 0.37 | 1.31 | 5.65 | * | 0.11 | 0.54 | ||||||
| Fertilizer (F) | 3.87 | * | 9.02 | ** | 0.16 | 1.68 | 0.05 | 0.29 | 3.39 | * | ||||
| S × F | 2.83 | 5.44 | ** | 1.18 | 0.11 | 2.37 | 0.10 | 0.64 | ||||||
| F × C | 0.45 | 0.75 | 4.23 | ** | 0.93 | 0.51 | 1.40 | 0.72 | ||||||
| S × F × C | 0.87 | 0.34 | 0.31 | 1.11 | 0.58 | 0.39 | 0.07 | |||||||
| 2009 | 2010 | |||||||||||||
|---|---|---|---|---|---|---|---|---|---|---|---|---|---|---|
| Pi | b | P45d | Pm | Pf | Pi | Pm | Pf | |||||||
| Crop sequence c | ||||||||||||||
| Corn-Sus | 582 | 904 | 168 | 143 | B | 208 | 371 | A | 349 | A | ||||
| Res-Sus | 513 | 653 | 145 | 286 | A | 238 | 241 | B | 285 | AB | ||||
| Sus-Sus | 503 | 665 | 126 | 197 | AB | 188 | 207 | B | 245 | B | ||||
| Fertilizer | ||||||||||||||
| None | 553 | 782 | 151 | ab | 210 | 199 | 252 | 293 | ||||||
| Manure | 513 | 611 | 163 | a | 190 | 237 | 303 | 291 | ||||||
| PK | 531 | 829 | 125 | b | 226 | 199 | 265 | 293 | ||||||
| ANOVA (F-value) | ||||||||||||||
| Crop (C) | 1.06 | 1.87 | 2.68 | 3.85 | * | 2.61 | 6.21 | * | 8.43 | ** | ||||
| Site (S) × C | 2.07 | 0.96 | 0.72 | 0.32 | 3.59 | 0.33 | 0.20 | |||||||
| Fertilizer (F) | 0.59 | 2.10 | 3.78 | * | 0.05 | 2.24 | 0.21 | 0.68 | ||||||
| S × F | 1.14 | 2.04 | 0.01 | 1.05 | 2.64 | 1.83 | 2.66 | |||||||
| F × C | 2.31 | 0.25 | 0.88 | 1.39 | 2.47 | 1.81 | 1.33 | |||||||
| S × F × C | 1.87 | 0.64 | 0.69 | 0.32 | 1.44 | 1.29 | 1.22 | |||||||
| 2009 | 2010 | |||||||||||||
|---|---|---|---|---|---|---|---|---|---|---|---|---|---|---|
| Vi | b | V45d | Vm | Vf | Vi | Vm | Vf | |||||||
| Crop sequence c | ||||||||||||||
| Corn-Sus | 1.8 | 6.6 | 5.1 | A | 1.3 | B | 1.6 | B | 1.7 | A | 1.3 | B | ||
| Res-Sus | 1.6 | 3.7 | 3.9 | AB | 2.9 | A | 2.6 | A | 1.8 | A | 1.8 | A | ||
| Sus-Sus | 1.6 | 9.7 | 2.7 | B | 1.3 | B | 1.2 | B | 1.4 | B | 1.8 | A | ||
| Fertilizer | ||||||||||||||
| None | 1.8 | 2.6 | b | 2.4 | b | 1.5 | b | 1.5 | b | 1.5 | 1.4 | b | ||
| Manure | 1.8 | 15.2 | a | 7.2 | a | 2.3 | a | 2.4 | a | 1.9 | 1.9 | a | ||
| PK | 1.5 | 2.1 | b | 2.2 | b | 1.7 | ab | 1.5 | b | 1.5 | 1.6 | ab | ||
| ANOVA (F-value) | ||||||||||||||
| Crop (C) | 0.81 | 1.17 | 7.77 | ** | 11.53 | ** | 10.73 | ** | 3.79 | * | 4.40 | * | ||
| Site (S) × C | 0.91 | 1.06 | 4.58 | * | 3.62 | 1.36 | 0.14 | 0.90 | ||||||
| Fertilizer (F) | 2.04 | 7.28 | ** | 32.70 | ** | 3.39 | * | 15.66 | ** | 2.83 | 5.05 | * | ||
| S × F | 0.46 | 4.53 | * | 9.71 | ** | 0.30 | 2.51 | 1.80 | 1.60 | |||||
| F × C | 0.28 | 1.51 | 1.86 | 0.83 | 1.82 | 0.63 | 0.78 | |||||||
| S × F × C | 0.22 | 1.28 | 1.15 | 0.86 | 0.51 | 0.59 | 0.75 | |||||||
| 2009 | 2010 | |||||||||||||
|---|---|---|---|---|---|---|---|---|---|---|---|---|---|---|
| Vi | b | V45d | Vm | Vf | Vi | Vm | Vf | |||||||
| Crop sequence c | ||||||||||||||
| Corn-Sus | 59 | 21 | 21 | 29 | 19 | 20 | A | 14 | ||||||
| Res-Sus | 49 | 18 | 20 | 27 | 13 | 10 | B | 12 | ||||||
| Sus-Sus | 54 | 18 | 21 | 24 | 13 | 11 | B | 11 | ||||||
| Fertilizer | ||||||||||||||
| None | 59 | 25 | a | 28 | a | 29 | b | 18 | a | 14 | 13 | ab | ||
| Manure | 54 | 5 | b | 6 | b | 13 | c | 10 | b | 12 | 10 | b | ||
| PK | 50 | 27 | a | 27 | a | 38 | a | 16 | a | 16 | 15 | a | ||
| ANOVA (F-value) | ||||||||||||||
| Crop (C) | 2.59 | 0.44 | 0.02 | 0.57 | 2.36 | 5.41 | * | 0.72 | ||||||
| Site (S) × C | 0.84 | 0.02 | 0.04 | 2.42 | 0.17 | 0.52 | 0.28 | |||||||
| Fertilizer (F) | 2.33 | 28.51 | ** | 32.27 | ** | 29.96 | ** | 13.63 | ** | 1.46 | 4.20 | * | ||
| S × F | 2.14 | 1.25 | 3.21 | * | 7.63 | ** | 0.08 | 0.00 | 0.48 | |||||
| F × C | 2.79 | * | 2.19 | 0.44 | 0.31 | 2.35 | 0.30 | 0.22 | ||||||
| S × F × C | 1.53 | 1.26 | 0.46 | 1.30 | 0.37 | 0.49 | 0.38 | |||||||
| 2009 | 2010 | |||||||||||||
|---|---|---|---|---|---|---|---|---|---|---|---|---|---|---|
| Vi | b | V45d | Vm | Vf | Vi | Vm | Vf | |||||||
| Crop sequence c | ||||||||||||||
| Corn-Sus | 40 | B | 75 | 75 | 67 | 74 | 77 | 82 | ||||||
| Res-Sus | 45 | A | 75 | 77 | 65 | 77 | 84 | 82 | ||||||
| Sus-Sus | 39 | B | 75 | 75 | 66 | 75 | 81 | 81 | ||||||
| Fertilizer | ||||||||||||||
| None | 40 | 69 | b | 75 | b | 62 | b | 72 | b | 80 | b | 81 | b | |
| Manure | 41 | 91 | a | 95 | a | 79 | a | 81 | a | 84 | a | 85 | a | |
| PK | 43 | 64 | b | 72 | b | 56 | c | 74 | b | 78 | b | 79 | b | |
| ANOVA (F-value) | ||||||||||||||
| Crop (C) | 5.45 | * | 0.02 | 0.09 | 0.13 | 0.51 | 3.48 | 0.58 | ||||||
| Site (S) × C | 0.29 | 0.24 | 0.08 | 2.44 | 0.50 | 0.28 | 0.17 | |||||||
| Fertilizer (F) | 1.20 | 56.47 | ** | 60.59 | ** | 32.64 | ** | 8.66 | ** | 5.64 | ** | 4.80 | * | |
| S × F | 3.38 | * | 1.24 | 0.49 | 0.74 | 0.01 | 0.53 | 1.32 | ||||||
| F × C | 1.70 | 2.37 | 2.67 | * | 1.44 | 0.97 | 0.31 | 0.64 | ||||||
| S × F × C | 1.61 | 0.88 | 2.24 | 2.16 | 0.94 | 0.85 | 0.23 | |||||||
| 2009 | 2010 | |||||||||||
|---|---|---|---|---|---|---|---|---|---|---|---|---|
| Vi | b | V45d | Vm | Vf | Vi | Vm | Vf | |||||
| Crop sequence c | ||||||||||||
| Corn-Sus | 1.97 | 1.64 | 1.65 | 1.84 | 2.00 | 2.07 | 2.11 | |||||
| Res-Sus | 1.99 | 1.71 | 1.72 | 1.91 | 1.96 | 2.00 | 2.03 | |||||
| Sus-Sus | 2.00 | 1.61 | 1.69 | 1.95 | 1.89 | 2.05 | 2.14 | |||||
| Fertilizer | ||||||||||||
| None | 1.98 | 1.82 | a | 1.86 | a | 1.90 | 1.93 | b | 2.04 | b | 2.05 | |
| Manure | 1.99 | 1.25 | b | 1.34 | b | 1.87 | 1.88 | b | 1.97 | b | 2.09 | |
| PK | 1.99 | 1.89 | a | 1.86 | a | 1.92 | 2.03 | a | 2.11 | a | 2.14 | |
| ANOVA (F-value) | ||||||||||||
| Crop (C) | 0.17 | 0.62 | 0.22 | 2.95 | 2.22 | 1.14 | 0.99 | |||||
| Site (S) × C | 0.46 | 0.73 | 0.09 | 0.05 | 2.00 | 2.01 | 0.00 | |||||
| Fertilizer (F) | 0.09 | 33.91 | ** | 36.37 | ** | 0.77 | 7.88 | ** | 7.07 | ** | 1.95 | |
| S × F | 1.66 | 5.27 | ** | 6.95 | ** | 2.67 | 1.52 | 4.16 | * | 1.91 | ||
| F × C | 0.09 | 1.88 | 2.78 | * | 1.57 | 3.52 | * | 1.28 | 0.77 | |||
| S × F × C | 0.64 | 0.11 | 0.60 | 1.21 | 1.43 | 1.26 | 0.27 | |||||