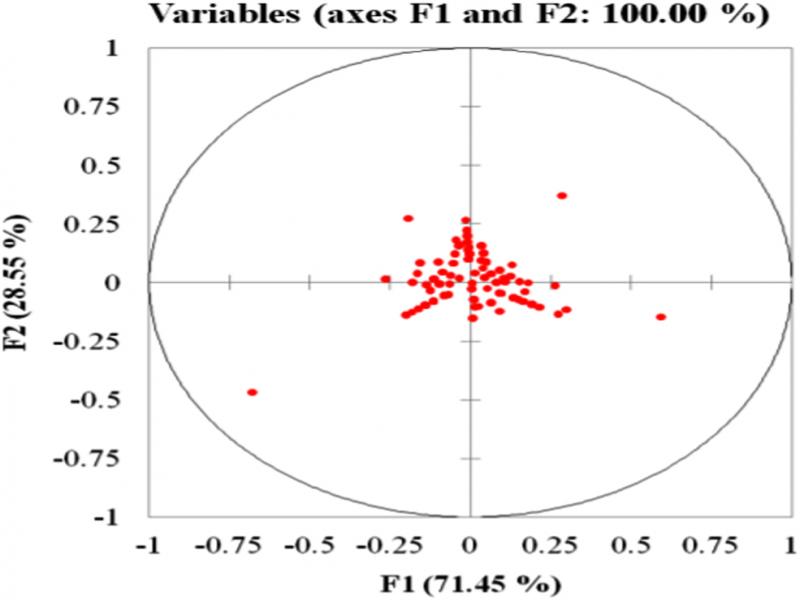
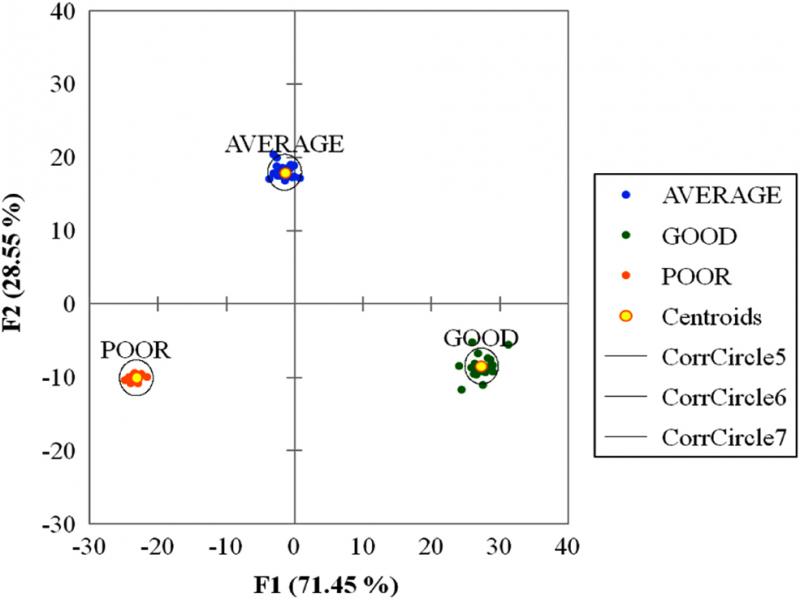
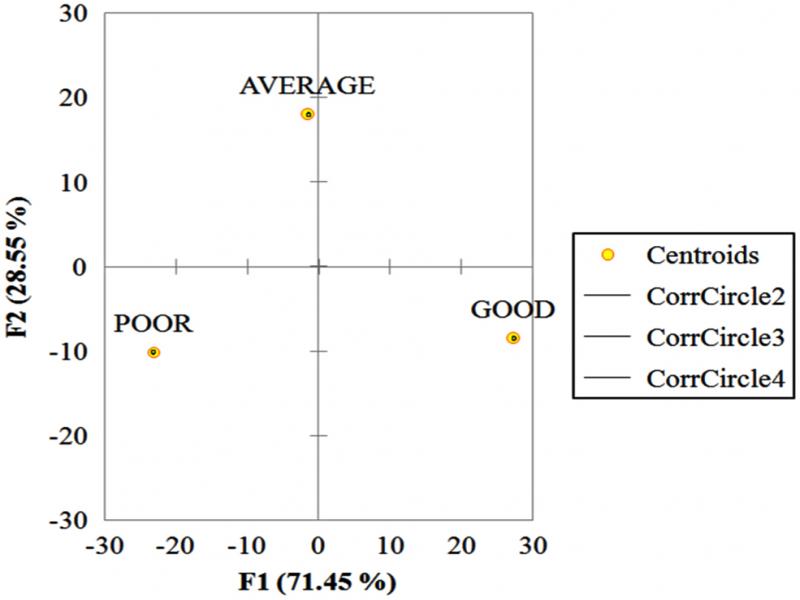
Educational psychology affords many academic values to be applied in the growth and evaluation of computer-assisted instructional technology. Milheim and Martin (1991) identified learner control as a significant variable in increasing the pedagogy of software in studying learner control motivation, attribution, and informational processing theory. It is advantageous for making best use of learner control as it enhances the relevance of learning, expectations for success, and general contentment, leading to sharp impulse (Gagne, 1985). In recent years, the educational development is focused on smart education in which the technology plays a vital role in smart learning carried out in the classroom (Kankaanranta and Makela, 2014). A smart learning environment will lead to new knowledge as every learner is unique.
Educational psychology is a very important regulation that is added to the learning of instructors and learners. The main concern in an educational psychology is to understand the learning process, i.e., the procedures and strategies that the learners use to acquire new information. Learning, still, does not take place in a vacuum. Understanding the best circumstances in which learning can occur is essential. Learning deals with the issues in the surrounding. The learning situation comes in the middle between the learner and the instructor. Topics like classroom environment and group-active techniques and aids that facilitate learning, evaluation techniques, and practices, guidance, and counseling, help in the smooth functioning of the teaching learning process.
Furthermore, learning is typically exaggerated by learning styles, and if learners make use of several learning styles, learning speed is higher (Galit et al., 2007). In recent years, interest has grown in the learning-centered paradigm (McManus, 2001) because it places learners at the center of the experience, empowers, and motivates them to assume responsibility in their learning, and approves teaching and learning approaches designed to encourage students to see themselves as active thinkers and problem-solvers. A learning-style preference study to native speakers (NNS) and cognitive styles were studied by Reid (1987).
Literature review
The environment of a learner could be distinguished by synchronous and asynchronous learning, also the level of communication between learner-learners, learner-instructor, learner-content, and learner-instructional media (Hiltz, 1994; Marks et al., 2005; Oliver et al., 2009). The partial access to time and place that is a fixed schedule in a specific classroom is the disadvantage of synchronous learning. The face-to-face interactions between learner and other learners, instructor, and content that are supposed to induce attention in learning and to highlight knowledge-acquisition process are the advantages of synchronous learning. The physical closeness may generate an intelligence of belonging and exchange of emotional support (Karacapilidis, 2010). However, the common atmosphere of a classroom may support a tendency of group conventionality to the attitude expressed by the faculty. A student with individual ingenuity may have to slow down his/her progress to the speed of the class.
Asynchronous learning has an advantage in offering unlimited access to class contents or materials anytime and anywhere. A responsive plan of course deliverance permits a learner to improve at his/her own speed. The learner not getting immediate answers to their questions on a certain topic is the drawback of asynchronous learning. Also, the learner does not get immediate feedback on their response to class materials and instructional delivery to strengthen their learning (Keller and Knopp, 1987). Alternatively, the real-time online feedback becomes possible with instructors and learners with modern growth of internet-based communication skills, and even creates a virtual learning community (Bower and Richards, 2005; Karacapilidis, 2010) that studied the impact of virtual classroom laboratories that are supportive mostly in the field of computer science education. Also, the research by Ferm and Naughton (2002) discusses the positive role of video-conferencing technologies in online education. This study primarily focuses on the creation of brainstorming-style discussions and small group meetings that are fundamental to many of modern educational techniques. Magdalene Delighta Angeline et al. (2017) analyzed the learners’ problem in learning, and also introduced a new method of teaching to improve the learners’ performance in academics. Angel et al. (2011) identified that North Carolina Virtual Public Schools (NCVPS) offered students improved flexibility and responsibilities, expanded opportunities, and individualized instruction and support. However, some problems existed for learner eagerness. Learners did not all the time have the practical skills or resources for online learning and many lacked self-direction. Han and Kamber (2006) describe the data mining software that allows the clients to examine the information in diverse aspects, classify it, and summarize the relationships, which are identified during the mining process. Galit et al. (2007) gave a case study that is to analyze the learners’ learning behavior to predict the results and to warn learners at risk before their final exams. Minaei and Punch (2003) used genetic algorithms with a combination of multiple classifiers to predict students’ final grades. Magdalene Delighta Angeline et al. (2015) classify the categories of learner’s performance in their academic qualification by reducing the failure ratio by taking appropriate steps at the right time to improve the quality of education using the class association rule. Kotsiantis et al. (2004) and Nebot et al. (2006) applied several machine-learning and classification techniques to predict the students’ final score, and the significance of each feature is also assessed. Etchells et al. 2006) carried out this work using artificial neural networks to predict students’ final grades. AI-Radaideh et al. (2006) applied the data mining approaches, principally categorization to assist in raising the quality of the educational system by evaluating learners’ data. He also applied a Decision Tree model to predict the final grade of learners who studied the C++ course at Yarmouk University, Jordan, in the year 2005. Different classification methods, namely ID3, C4.5, and the Naive Bayes, were used. The upshot of their consequences indicated that the Decision Tree model had better prediction than other models.
New York’s Smart School program emphasizes the role of technology integrated into the classroom by enhancing student achievement and practice students to take part in the 21st-century financial system (New York Smart Schools Commission Report, 2014). In recent times, many investigations instigate to pay concentration to the significance and requirement of genuine activities in which learners work with problems in the real world (Hwang et al., 2008). So, as to locate students in genuine learning environments, it is imperative to propose learning that combines both real and virtual learning environments. This paper discusses about smart learning in an instructor-led virtual classroom and also the effective prediction of learners’ performance with Discriminant Analysis.
Learning in the instructor-led virtual classroom
The instructor-led virtual classroom is a smart way of teaching and learning environment where learners can work jointly, exchange a few words, monitor and argue the presentation, and employ with learning resources working in a group. The learner’s concentration strengthens in instructor-led virtual classrooms as its environment is interactive. The smart instructor-led virtual classrooms provide
Immediate feedback.
Access to instructors.
Face-to-face interaction.
In smart instructor-led virtual classrooms, there is an instructor in the environment with learners when doing or looking at activities. Instructor-led virtual classrooms can also be more instructive, provided that a supplementary provides effective knowledge. The class notes are recorded and the important details of the topic are pointed out in an instructor-led virtual classroom. The interaction is made through content-related discussion topics by the learner. The learner uses text features to discuss the topics with the group. The discussion group helps the learner to get an answer for the posted question. The learner is allowed to take part in the discussion and share their own creative ideas. The learner has the facility to view the lecture on a topic in powerpoint slides. The learner uses programs independently to create an innovative product for the course in applications such as word and excel. The instructor uses multimedia resource that helps the learner to access and view to acquire more ideas. The real-time feedback is provided in such a smart educational environment to engage the learner into effective, proficient, and meaningful learning. This instructor-led virtual classrooms use a cognitive approach further to enhance the withstanding ability of any learner. The analysis of learner’s information, such as assessment of academics, attitudes, and behavioral pattern, helps the educational institutes to predict failure rate measuring to reduce the same and to check whether they are using their resources in the right places and producing the right results.
Cognitive approach
Cognition is a new topic in the field of cognitive science. The basic argument is about the significance of physical experience in sense-making and learning (Nunez et al., 1999). The cognitive approach is a specialized learning method that the learners use to learn more effectively. It includes recurrence, organizing new language, reviewing meaning, speculating meaning from context, and using imagery for memorization. All of these approaches involve purposeful manipulation of language to improve learning. The cognitive approach refers to the means an individual imagines and practices information. It is essential for a learner to improve their cognitive skills to produce a good outcome. The learner should possess:
The ability to sustain concentration on a particular object, action, or thought.
The ability to manipulate objects.
The ability to visualize images and scenarios.
Abilities that facilitate goal-oriented behavior, such as the tendency to plan and execute a goal.
The ability to withstand distraction and internal advises.
The ability to identify and manage one’s own emotions for good performance.
Learning in an instructor-led virtual classroom is done with the help of various methods such as project-based approach, interactive learning approach, exposition learning approach, contingent assignment, and imaginative empowerment approach. Each approach identifies the learner with different cognitive skills and learning is made with the respective identified approach. Identifying the cognitive skills of each learner and providing learning based on the skill is very difficult. In the instructor-led virtual classroom approach, learning is afforded by observing the learner’s cognitive skills. The different cognitive skills are given in Figure 1. The cognitive skills of each learner are recognized with their associated behavior. The associated behavior comprises solving problems, making use of a new method, defining new examples, summarizing, memorizing topics, judging the value of methods, pointing out, and recalling. The instructor-led virtual classrooms implemented with the cognitive approach of learning create a new learning environment and increase the learning speed of each learner. The monotonous learners enjoy the new situation of learning and the outcome of the learner is improved in a short span of time.
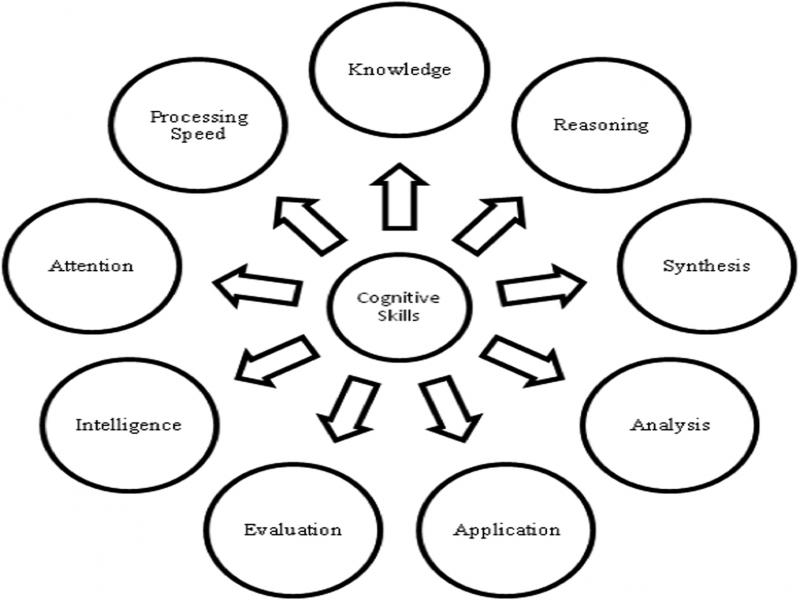
Figure 1:
Cognitive skills and related behaviors.
The observation made from each learner is summarized as follows:
A monotonous learner’s keenness is augmented.
An innovative thought-provoked outcome is yielded.
Learners engage themselves in group activities voluntarily.
Idea sharing and discussion are done.
Stress-free learning is made.
The upshot of learning is enhanced.
Asking and answering the question.
Later, the prediction and analysis are made with the Discriminant analysis that enhances the performance of each learner.
Learning approaches
Project-based approach
In a project-based method, the learners are grouped into seven teams with four members in each team. All the team members are instructed to select a topic from microprocessor and microcontroller subjects. The teams were given one month’s time to get ready with their own topics. Each team used different materials to explain their concepts. The materials used by the teams are charts, newspaper content, information from internet sources, cardboard work, and real-life examples to explain the microprocessor working along with the instructions and instruction set. The cognitive skills observed at the end of the work from each team are synthesis, intelligence, reasoning, evaluation, and application. The percentage of skills observed from each team is analyzed and grouped under a grade.
If-then rules were formed as follows:
If skill percentage> = 90 then Grade = ‘A’
If skill percentage> = 80 then Grade = ‘B’
If skill percentage> = 70 then Grade = ‘C’
If skill percentage< = 50 then Grade = ‘D’
Grade ‘A’ has the highest percentage and the maximum team members came out with a good explanation on their topics given in Figure 2. The viewers of this approach learned well and were able to grasp the basic concepts.
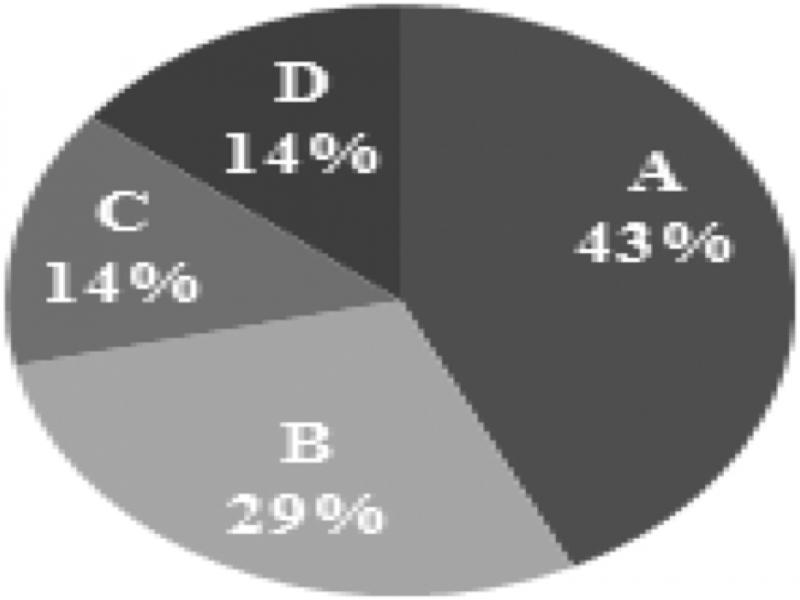
Figure 2:
Cognitive skill percentages for grade.
Team-based work
In team-based work, the learners are grouped and given different topics for each team in software-testing subject. The time duration for preparing the topic is 45 minutes and the presentation is 15 minutes to each team. In total, there were ten teams with two or three members in each team. The learners enjoyed preparing, discussing among them, and working together preparing materials. The presentation of each team was more creative and realistic. The outcomes from the students are as follows:
Increased interest.
Cleared doubts.
Equally shared in doing.
The cognitive skills are observed and analysis was made for each team.
Creative empowerment approach
In a creative empowerment approach, the students were grouped into four teams. Each team was provided with a specialized topic on “how a final product undergoes various testing before releasing it.” The learners were very much enthusiastic in proceeding with their work. They themselves implemented their own ideas in various levels of testing. The upshot of this method was:
Increased creative skills.
Came out with their own ideas.
Different implementation methods.
Diverse styles in presenting.
Sound understanding in the technological approach.
Interactive learning approach
In this approach, the learners were made to act, listen, view, and ask question immediately. This approach was applied to learners for object-oriented programming and computer network subjects. The findings of this approach were:
Active participation.
Improved listening capability.
Knowing the models effortlessly.
Questioning the abilities enhanced.
Better communication between the learner and facilitator.
Presentation-learning approach
In a presentation-learning approach, the learner as well as the facilitator were made to present content using powerpoint slides or multimedia presentation softwares. The learner was able to study about the working principles and their simulation in a real way. The simulation and presentation were for mobile communication and programming paradigm subjects. The learners’ individual cognitive skills were analyzed. The learners were educated to be aware of the concept in detail. The learner’s cognitive processes influence the nature of what is learned. People learn new information more easily when they can relate it to something they already know.
Figure 3 shows the analysis chart of various approaches for different cognitive skills. The creative empowerment approach produces good effect among learners with 92.2%.
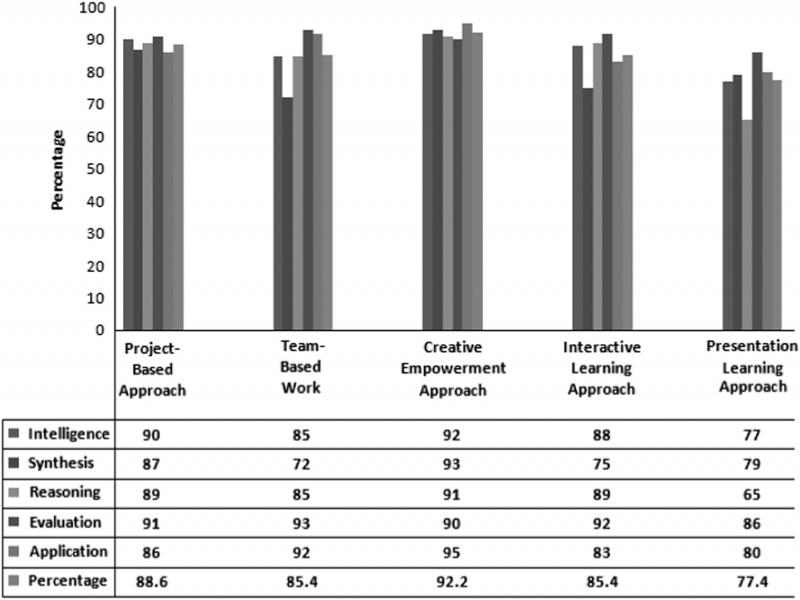
Figure 3:
Analysis of learning with various approaches.
It was found that the cognitive skill named evaluation has 90.4% in Figure 4, which was the highest when compared with other skills. The analysis was made with the different subjects for the same group of learner in each approach that modernizes and enhances the learning of the learners. Intelligence encompasses a number of mental abilities such as reasoning, planning, and problem-solving. Cognitive theory also highlights student-centered instruction, supportive learning groups, multiple presentations of key thoughts, and energetic, investigative learning.
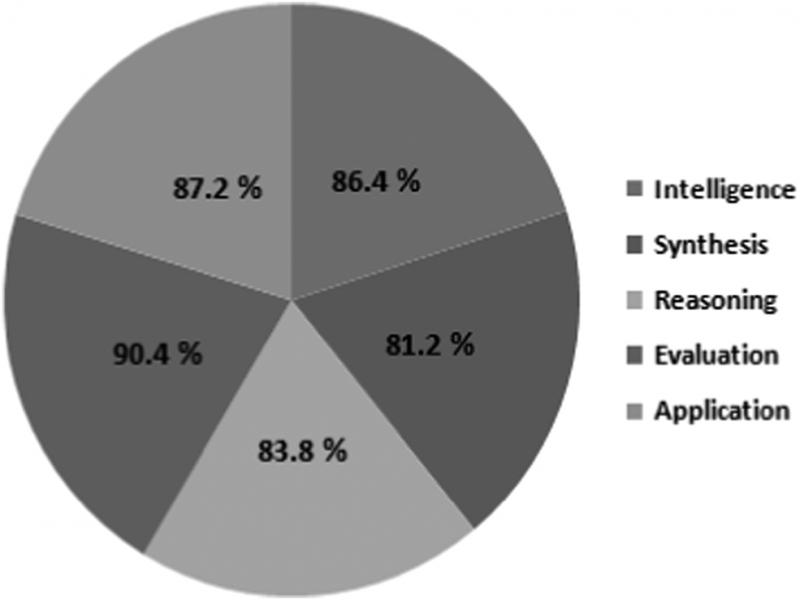
Figure 4:
Overall percentage of cognitive skills when applied with various learning approaches in an instructor-led virtual classroom.
Data mining algorithm
There are various data mining algorithms such as decision tree, Naive Bayes, Rule induction, Supervised Learning, Apriori algorithm, and Association rule analysis. This paper scrutinizes the Discriminant analysis that is a very powerful data mining technique.
Data collection
The learners’ data sets collected in the current research study pertain to the different subjects pursued by the learners of engineering graduates from Dr. G. U. Pope College of Engineering. Learners’ performances in the respective subject prerequisites were collected from the departmental records of result summaries pertaining to three passed-out batches of computer science and engineering discipline.
Discriminant analysis
Discriminant analysis is a statistical technique to classify objects based on a set of measurable object’s feature (Michael et al., 2000). The linear combination for a discriminant analysis, also known as the Discriminant function, is derived from an equation:
(1)where Z = Discriminant score Wi = Discriminant weight for variable i Xi = Independent variable i Fisher’s Discriminant Algorithm is given as follows:Estimate class means, covariance matrices, and prior probabilities.Compute the pooled covariance matrix and invert it.Compute the discriminant vector.Apply the discriminant using equation Y = WT x.Fisher’s Linear Discriminant Analysis is based on the idea of searching for a linear combination of variables that best separates the target classes. Normally, we seek a direction w such that:
(2)is a maximum, where m1 and m2 are the group means and SW is the pooled within-class sample covariance matrix, in its bias-corrected form given by:“Pooled” is the total, all points contributing. The effectiveness of the discrimination is assessed by calculating the Mahalanobis distance between two groups. If the distance is greater than 3, then the probability of misclassification is reasonably undersized:
Last, a new point is classified by projecting it onto the maximally separating direction and classifying it as C1 if:
The variances appear along the diagonal and covariances appear in the off-diagonal elements given as follows:
(6)whereV is a c x c variance-covariance matrix.N is the number of scores in each of the c data sets. Xi is a deviation score from the ith data set.ΣXi2/N is the variance of elements from the ith data set.ΣXi Xj/N is the covariance for elements from the ith and jth data sets.The variance-covariance matrix is created as follows:
Suppose X is an n x k matrix holding ordered sets of raw data:
Start with the raw data of matrix X, create a variance-covariance matrix to show the variance within each column and the covariance between columns.
Transform the raw scores from matrix X into deviation scores for matrix x.
Compute x’x, the k x k deviation sums of squares and cross-product matrix for x.
Then, divide each term in the deviation sums of squares and cross-product matrix by n to create the variance-covariance matrix. That is:
Experimental results
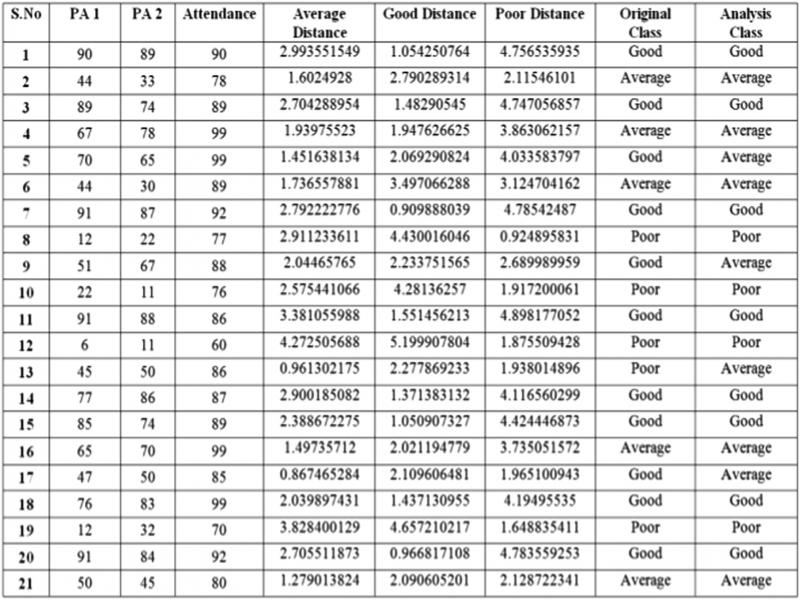
The learner’s cognitive skills are observed during the lecture time and learning in the instructor-led virtual classroom is done using cognitive methods. The learner is assessed using the internal assessment test and the attendance in the classroom. Table 1 describes about the discriminant analysis for performance. The mean for the input data internal 1, internal 2, attendance is estimated for the performance. The performance is categorized into three: average, good, and poor.
Table 1.
Discriminant analysis for performance.
| Sample summary | Sample size | Internal 1 mean | Internal 2 mean | Attendance mean |
|---|---|---|---|---|
| Average | 5 | 54 | 51.2 | 89 |
| Good | 11 | 78 | 77 | 90.54545455 |
| Poor | 5 | 19.4 | 25.2 | 73.8 |
| Classification matrix | Average | Good | Poor | Correct |
|---|---|---|---|---|
| Average | 5 | 0 | 0 | 100 |
| Good | 3 | 8 | 0 | 72.7272727 |
| Poor | 1 | 0 | 4 | 80 |
| Matrix of vars and covars | PA 1 | PA 2 | Attendance |
|---|---|---|---|
| Average | |||
| PA 1 | 126.5 | 243.5 | 96.5 |
| PA 2 | 243.5 | 472.7 | 178 |
| Attendance | 96.5 | 178 | 100.5 |
| Good | |||
| PA 1 | 258 | 163.6 | 10.4 |
| PA 2 | 163.6 | 152.2 | 7 |
| Attendance | 10.4 | 7 | 22.27273 |
| Poor | |||
| PA 1 | 237.8 | 190.4 | 126.85 |
| PA 2 | 190.4 | 268.7 | 107.8 |
| Attendance | 126.85 | 107.8 | 92.2 |
| Pooled | |||
| PA 1 | 224.289 | 187.31 | 55.41111 |
| PA 2 | 187.311 | 249.31 | 67.4 |
| Attendance | 55.4111 | 67.4 | 55.19596 |
| Correct | 81.0% | ||
| Base | 52.4% | ||
| Improvement | 60.0% |
| Variable | Categories | Frequencies | % |
|---|---|---|---|
| Predicted performance | Average | 68 | 34.171 |
| Good | 62 | 31.156 | |
| Poor | 69 | 34.673 |
| Variable | Categories | Frequencies | % |
|---|---|---|---|
| Predicted performance | Average | 0 | 0.000 |
| Good | 0 | 0.000 | |
| Poor | 1 | 100.000 |
| Class | Sum of weights | Prior probabilities | |
|---|---|---|---|
| Average | 68.000 | 0.342 | |
| Good | 62.000 | 0.312 | |
| Poor | 69.000 | 0.347 |
| Class | Average | Good | Poor |
|---|---|---|---|
| Average | 0 | 1,526.947 | 1,257.661 |
| Good | 1,526.947 | 0 | 2,554.130 |
| Poor | 1,257.661 | 2,554.130 | 0 |
| Class | Average | Good | Poor |
|---|---|---|---|
| Average | 2.147594 | 1,529.279 | 1,259.779 |
| Good | 1,529.094 | 2.332341 | 2,556.248 |
| Poor | 1,259.809 | 2,556.462 | 2.118397 |
| Class | Average | Good | Poor |
|---|---|---|---|
| Average | 0 | 6.580 | 5.723 |
| Good | 6.580 | 0 | 11.082 |
| Poor | 5.723 | 11.082 | 0 |
| Class | Average | Good | Poor |
|---|---|---|---|
| Average | 1 | 0.021 | 0.028 |
| Good | 0.021 | 1 | 0.006 |
| Poor | 0.028 | 0.006 | 1 |
| Lambda | 0.000 | |
| F (observed value) | 7.018 | |
| F (critical value) | 2.551 | |
| DF1 | 384 | |
| DF2 | 10 | |
| P value | 0.001 | |
| alpha | 0.05 |
| Trace | 1.992 | |
| F (observed value) | 7.610 | |
| F (critical value) | 2.310 | |
| DF1 | 384 | |
| DF2 | 12 | |
| P value | 0.000 | |
| alpha | 0.05 |
| Trace | 596.480 | |
| F (observed value) | 7.256 | |
| F (critical value) | 3.923 | |
| DF1 | 384 | |
| DF2 | 6 | |
| P value | 0.011 | |
| alpha | 0.05 |
| Root | 426.213 | |
| F (observed value) | 13.319 | |
| F (critical value) | 3.691 | |
| DF1 | 192 | |
| DF2 | 6 | |
| P value | 0.002 | |
| alpha | 0.05 |
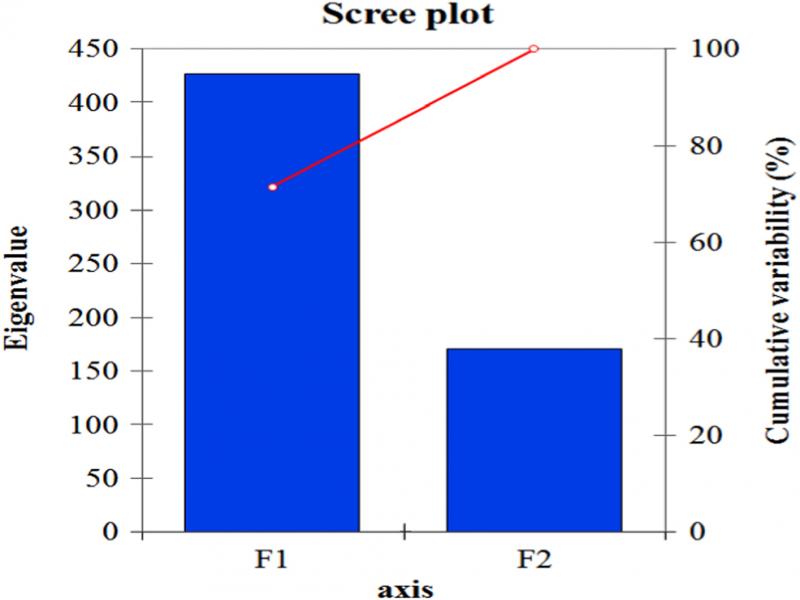
| F1 | F2 | |
|---|---|---|
| Eigenvalue | 426.213 | 170.267 |
| Discrimination (%) | 71.455 | 28.545 |
| Cumulative % | 71.455 | 100.000 |
| F1 | F2 | |
|---|---|---|
| Eigenvalue | 426.213 | 170.267 |
| Bartlett’s statistic | 1125.651 | 516.894 |
| P value | 0.000 | 0.000 |
| F1 | F2 | |
| 0.999 | 0.997 |
| F1 | F2 | |
|---|---|---|
| AVERAGE | −1.441 | 17.951 |
| GOOD | 27.354 | −8.465 |
| POOR | −23.159 | −10.085 |