
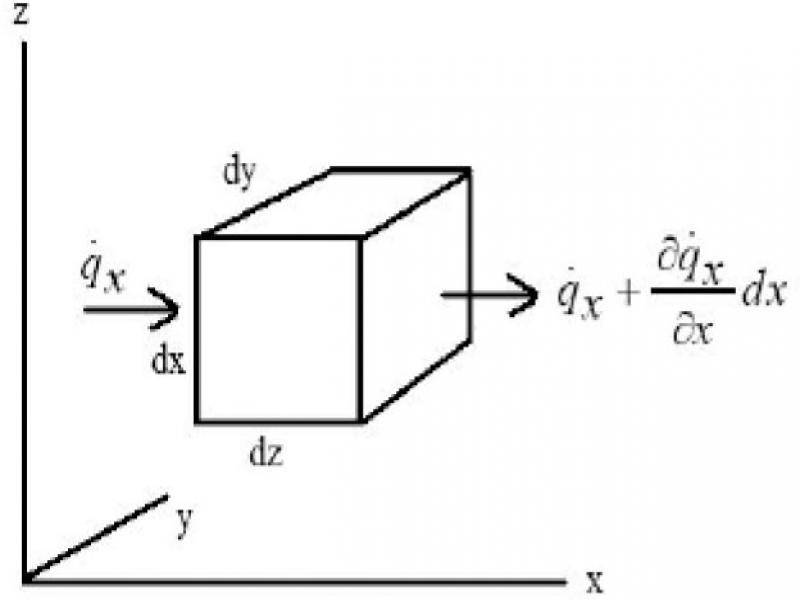
Figure 1.
Fluid flow through a parallelepiped
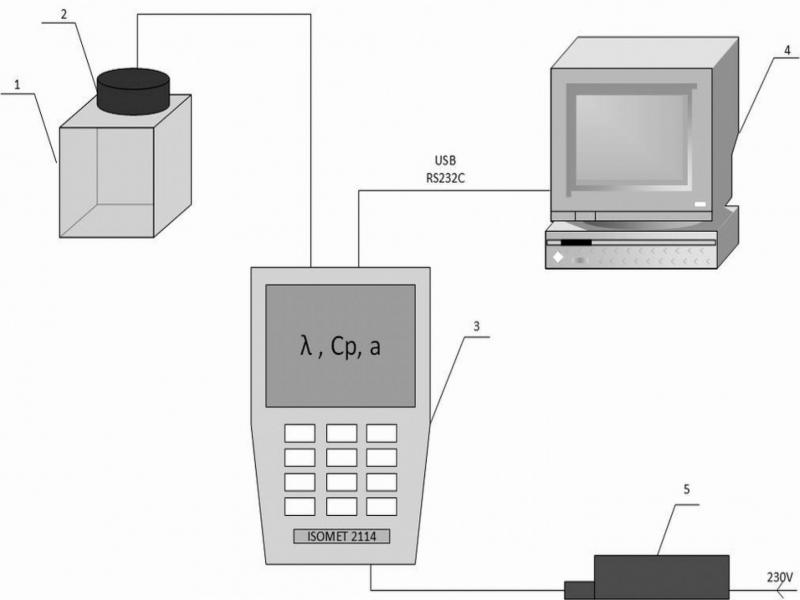
Figure 2.
Experimental setup to measure conductivity λ, specific heat capacity Cp and thermal diffusivity a: 1 – tested specimen, 2 – surface probe, 3 – microprocessor-controlled Isomet instrument, 4 – PC computer, 5 – AC/DC power supply
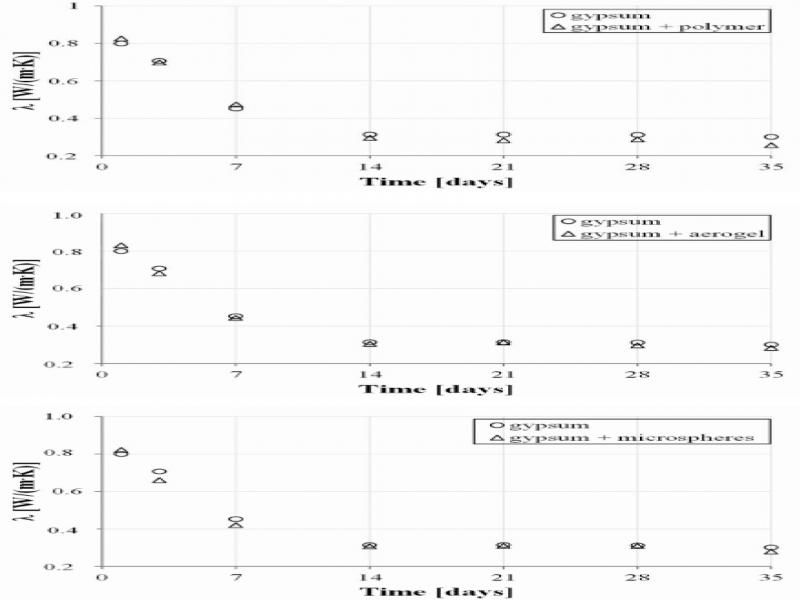
Figure 3.
Thermal conductivity changes of gypsum specimens during aging process for pure gypsum with different additives: a) polymer, b) aerogel, c) microspheres
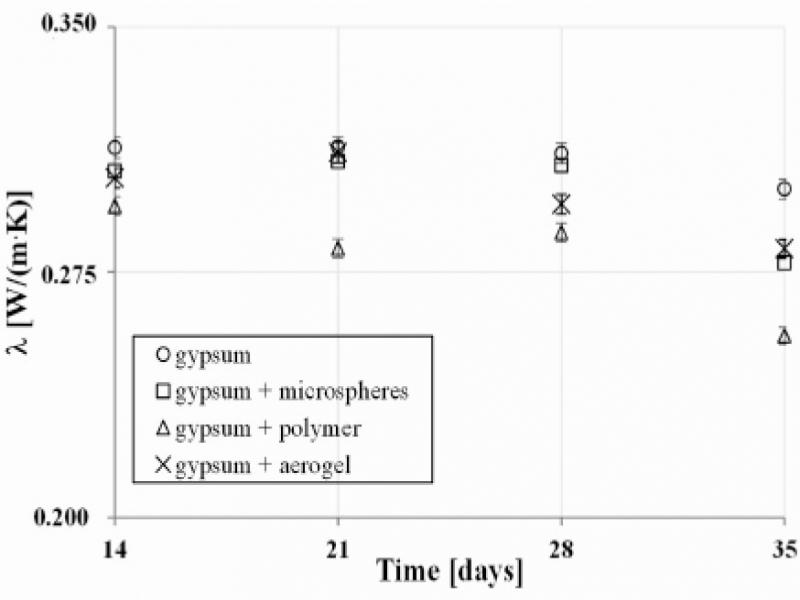
Figure 4.
Thermal conductivity changes of modified gypsum specimens during aging process between 14 and 35 days of measurement
Table 1.
Values of thermal conductivity λ, specific heat Cp , thermal diffusivity a, standard deviations σ and uncertainty of variation u of the pure gypsum and gypsum with additives polymer, aerogel and microspheres after 35 days
| Parameters | Materials | |||
| Pure gypsum | Gypsum and polymer | Gypsum and microspheres | Gypsum and aerogel | |
| Thermal conductivity λ (W/(m⋅K)) | 0.3004 | 0.2556 | 0.2778 | 0.2821 |
| Standard deviation σλ (W/(m⋅K)) | 0.0039 | 0.0069 | 0.0088 | 0.0072 |
| Uncertainty uλ (W/(m⋅K)) | 0.0022 | 0.0034 | 0.0044 | 0.0035 |
| Specific heat Cp (J/(kg⋅K)) | 1,520 | 1,597 | 1,594 | 1,630 |
| Standard deviation σCp (J/(kg⋅K)) | 31 | 14 | 31 | 87 |
| Uncertainty uCp (J/(kg⋅K)) | 11 | 8 | 17 | 49 |
| Thermal diffusivity a (mm2/s) | 0.1923 | 0.1716 | 0.1930 | 0.2074 |
| Standard deviation σa (mm2/s) | 0.0018 | 0.0023 | 0.0087 | 0.0095 |
| Uncertainty ua (mm2/s) | 0.0009 | 0.0012 | 0.0044 | 0.0049 |
Table 2.
Bulk density and total porosity of gypsum composites after 35 days
| Parameters | Building materials | |||
| Pure gypsum | Gypsum and polymer | Gypsum and microspheres | Gypsum and aerogel | |
| Bulk density (kg/m3) | 998 | 940 | 921 | 920 |
| Total porosity (%) | 57.5 | 60.0 | 60.8 | 60.9 |
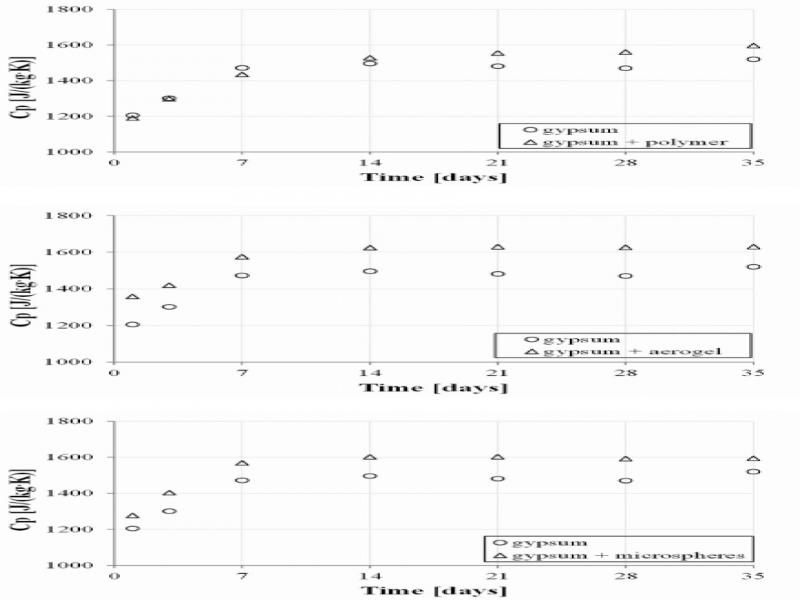
Figure 5.
Specific heat changes of gypsum specimens during aging process for pure gypsum with different additives: a) polymer, b) aerogel, c) microspheres
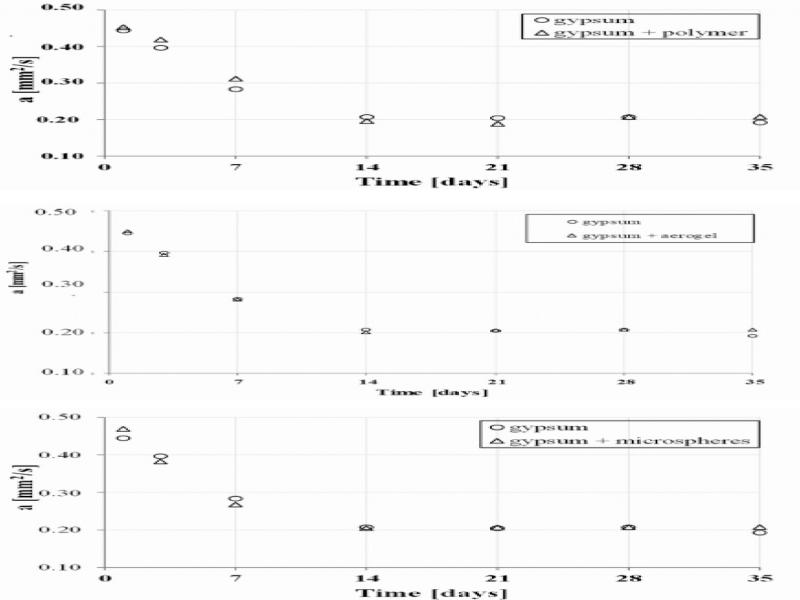
Figure 6.
Thermal diffusivity changes of gypsum specimens during aging process for pure gypsum with different additives: a) polymer, b) aerogel, c) microspheres
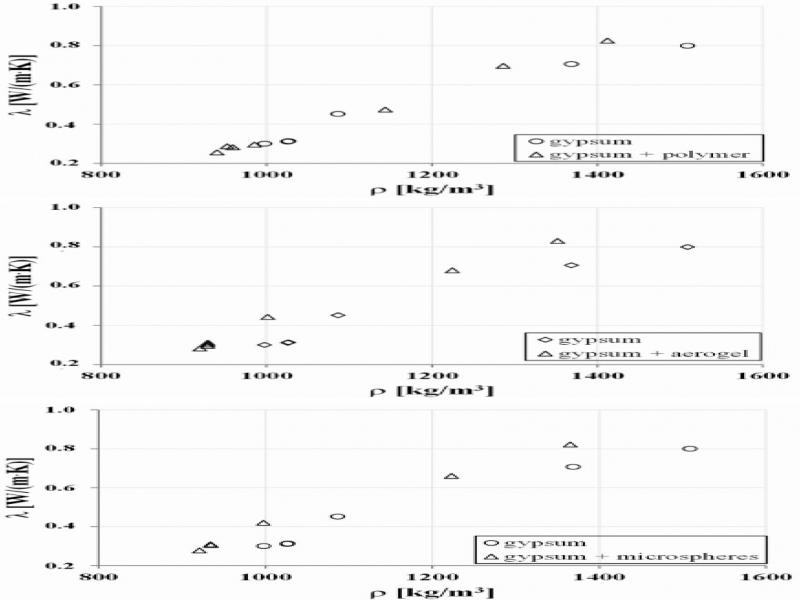
Figure 7.
Thermal conductivity coefficient versus bulk density of gypsum specimens with different moisture contents and different micro additives: a) polymer, b) aerogel, c) microspheres
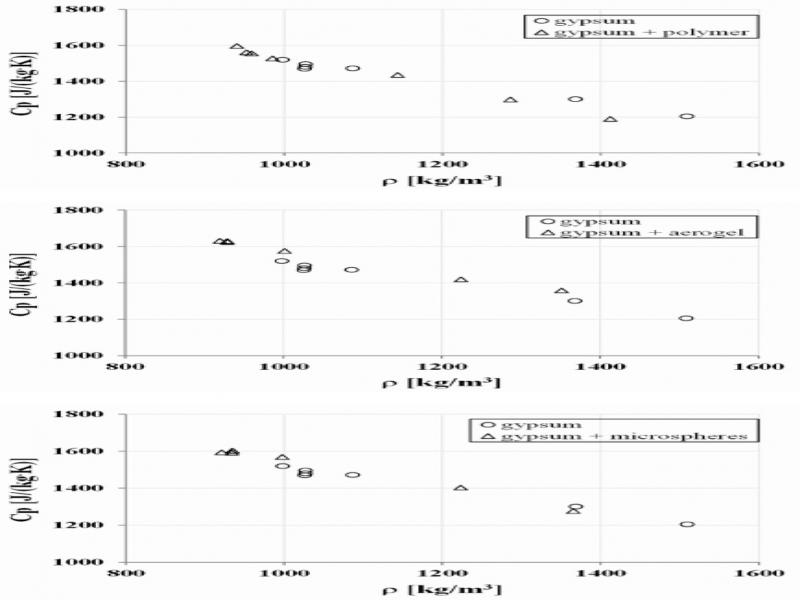
Figure 8.
Specific heat versus bulk density of gypsum specimens with different moisture contents and different micro additives: a) polymer, b) aerogel, c) microspheres
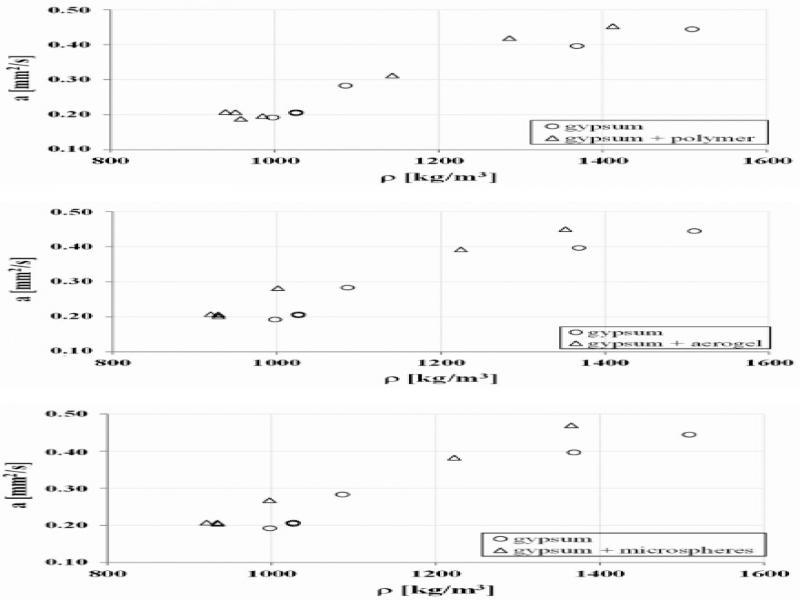
Figure 9.
Thermal diffusivity versus bulk density of gypsum specimens with different moisture contents and different micro additives: a) polymer, b) aerogel, c) microspheres
Table 3.
Constants A, B, C, D, E and F of equations (5–7)
| Building materials | Constants | ||||||||
| A | B | R2 | C | D | R2 | E | F | R2 | |
| Pure gypsum | 0.0010 | 0.7176 | 0.9782 | 0.5799 | 2.087 | 0.9871 | 0.0005 | 0.2984 | 0.9686 |
| Gypsum and polymer | 0.0012 | 0.8886 | 0.9943 | 0.6985 | 2.225 | 0.9689 | 0.0006 | 0.3622 | 0.9751 |
| Gypsum and microspheres | 0.0012 | 0.8090 | 0.9947 | 0.7230 | 2.275 | 0.9919 | 0.0006 | 0.3476 | 0.9936 |
| Gypsum and aerogel | 0.0013 | 0.8520 | 0.9918 | 0.6521 | 2.230 | 0.9965 | 0.0006 | 0.3290 | 0.9833 |
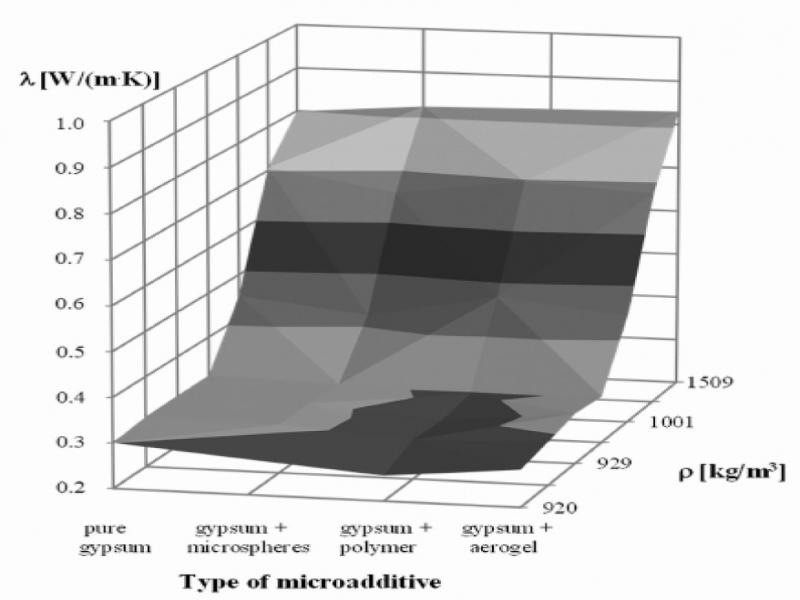
Figure 10.
Thermal conductivity coefficient versus bulk density for different type of micro additives content after 35 days of aging