
Table 1
Descriptive Statistics for the Analytic Sample.
| VARIABLE | UNWEIGHTED %(n = 1,972) | WEIGHTED %(n = 30,280) | WEIGHTED STANDARD ERROR | DESIGN EFFECT |
|---|---|---|---|---|
| Gender | ||||
| Female | 15.1% | 12.7% | (0.01) | 1.09 |
| Male | 84.9% | 87.3% | (0.01) | 1.09 |
| Pay grade | ||||
| Enlisted E1 to E3 | 5.8% | 8.4% | (0.01) | 1.52 |
| Enlisted E4 | 22.4% | 32.5% | (0.01) | 1.37 |
| Enlisted E5 | 18.2% | 18.2% | (0.01) | 1.12 |
| Enlisted E6 | 9.7% | 9.6% | (0.01) | 1.10 |
| Enlisted E7 to E9 | 16.7% | 14.2% | (0.01) | 1.05 |
| Warrant officer W1 to W5 | 1.4% | 1.0% | (0.00) | 0.82 |
| Officer O1 to O3 | 10.0% | 7.1% | (0.01) | 0.86 |
| Officer O4 to O7 | 15.7% | 9.1% | (0.01) | 0.83 |
| Race/ethnicity | ||||
| White non-Hispanic | 74.3% | 74.2% | (0.01) | 1.20 |
| Black non-Hispanic | 7.6% | 6.8% | (0.01) | 1.06 |
| Hispanic | 10.5% | 11.5% | (0.01) | 0.96 |
| Asian, HPI/other | 7.6% | 7.5% | (0.01) | 1.21 |
| Wave 6 highest education completed | ||||
| Less than a bachelor’s degree | 50.7% | 57.7% | (0.01) | 1.17 |
| Bachelor’s degree | 23.4% | 22.3% | (0.01) | 1.16 |
| More than a bachelor’s degree | 27.2% | 20.0% | (0.01) | 1.04 |
| Left job between Waves 6 and 7 | 11.5% | 12.2% | (0.01) | 1.25 |
| Neither dissatisfied with compensation nor underemployed | 54.9% | 53.9% | (0.01) | 1.21 |
| Only dissatisfied with compensation | 4.3% | 4.6% | (0.01) | 1.26 |
| Only underemployed | 31.0% | 31.2% | (0.01) | 1.21 |
| Both underemployed and dissatisfied with compensation | 9.8% | 10.3% | (0.01) | 1.24 |
[i] Note. Inclusion criteria are as follows: not on active duty and working in Waves 6 and 7.
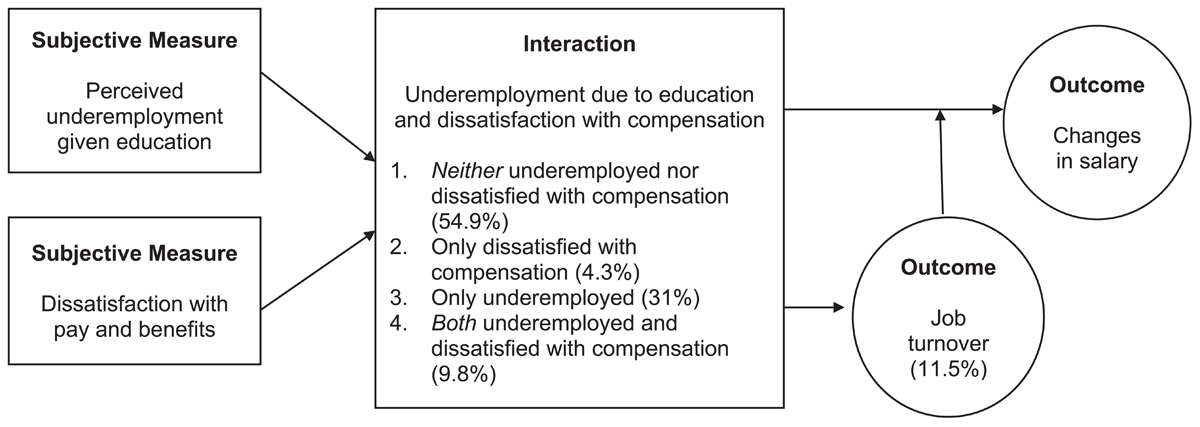
Figure 1
Conceptual Model.
Table 2
Likelihood of Leaving a Job Between Wave 6 and Wave 7 as a Function of Turnover, Underemployment, and Compensation Dissatisfaction.
| VARIABLE | ODDS RATIO | CI LOWER | CI UPPER | DESIGN EFFECTS | p |
|---|---|---|---|---|---|
| Male | 0.83 | 0.61 | 1.14 | 1.03 | 0.25 |
| Pay grade (reference group: Enlisted E4) | |||||
| Enlisted E1 to E3 | 0.80 | 0.50 | 1.29 | 1.54 | 0.36 |
| Enlisted E5 | 0.70 | 0.51 | 0.97 | 1.20 | 0.03 |
| Enlisted E6 | 0.50 | 0.32 | 0.76 | 1.14 | <0.001 |
| Enlisted E7 to E9 | 0.37 | 0.25 | 0.54 | 1.05 | <0.001 |
| Warrant officer W1 to W5 | 1.25 | 0.52 | 2.98 | 0.78 | 0.62 |
| Officer O1 to O3 | 0.61 | 0.38 | 1 | 1.00 | 0.05 |
| Officer O4 to O7 | 0.38 | 0.23 | 0.65 | 0.95 | <0.001 |
| Highest education completed (reference group: bachelor’s degree) | |||||
| Less than a bachelor’s degree | 1.32 | 0.96 | 1.8 | 1.23 | 0.09 |
| More than a bachelor’s degree | 1.00 | 0.67 | 1.48 | 1.11 | 0.99 |
| Neither dissatisfied with pay nor underemployed (reference group) | |||||
| Only dissatisfied with pay | 1.32 | 0.75 | 2.33 | 1.20 | 0.33 |
| Only underemployed | 1.90 | 1.46 | 2.47 | 1.24 | <0.001 |
| Both underemployed and dissatisfied with pay | 3.86 | 2.70 | 5.53 | 1.23 | <0.001 |
Table 3
Growth Curve Model Results: Salary Change Between Wave 6 and 7 among Demographics, Education, Underemployment, and Dissatisfaction with Pay.
| VARIABLE | EST. | SE | p |
|---|---|---|---|
| Intercept | 46.14 | 2.33 | <.0001 |
| Male | 11.10 | 1.65 | <.0001 |
| Pay grade (reference group: enlisted E4) | |||
| Enlisted E1 to E3 | –5.57 | 2.76 | 0.043 |
| Enlisted E5 | 6.50 | 1.86 | 0.001 |
| Enlisted E6 | 20.33 | 2.26 | <.0001 |
| Enlisted E7 to E9 | 31.60 | 1.95 | <.0001 |
| Warrant officer W1 to W5 | 44.94 | 5.13 | <.0001 |
| Officer O1 to O3 | 31.56 | 2.56 | <.0001 |
| Officer O4 to O7 | 58.55 | 2.53 | <.0001 |
| Wave 6 highest education completed (reference group: bachelor’s degree) | |||
| Less than a bachelor’s degree | –8.83 | 1.62 | <.0001 |
| More than a bachelor’s degree | 11.90 | 1.91 | <.0001 |
| Intercept Wave 6 (reference group: neither dissatisfied with pay nor underemployed) | |||
| Only dissatisfied with pay | –15.19 | 3.45 | <.0001 |
| Only underemployed | –10.96 | 1.53 | <.0001 |
| Both underemployed and dissatisfied with pay | –24.11 | 2.54 | <.0001 |
| Intercept: veterans with job turnover | –1.22 | 3.14 | 0.699 |
| Intercept: Wave 6 veterans with job turnover and neither dissatisfied with pay nor underemployed (reference group) | |||
| Veterans with job turnover and only dissatisfied with pay | 7.66 | 9.69 | 0.429 |
| Veterans with job turnover and only underemployed | –6.09 | 4.68 | 0.193 |
| Veterans with job turnover and both underemployed and dissatisfied with pay | 4.66 | 5.60 | 0.405 |
| Change in salary | 4.23 | 0.78 | <.0001 |
| Change in salary (reference group: neither dissatisfied with pay nor underemployed) | |||
| Only dissatisfied with pay | 9.46 | 3.19 | 0.003 |
| Only underemployed | 0.64 | 1.34 | 0.633 |
| Both underemployed and dissatisfied with pay | 6.03 | 2.33 | 0.010 |
| Change in salary for veterans with job turnover | 0.85 | 2.74 | 0.757 |
| Change in salary for veterans with job turnover (reference group: neither dissatisfied with pay nor underemployed) | |||
| Veterans with job turnover; only dissatisfied with pay | 6.29 | 9.21 | 0.495 |
| Veterans with job turnover; only underemployed | 10.81 | 4.15 | 0.009 |
| Veterans with job turnover; both underemployed and dissatisfied with pay | 7.84 | 5.02 | 0.119 |
[i] Note. Race/ethnicity was not a significant predictor of changes in salary and was removed from the current model.
Table 4
Salary Change as a Function of Turnover, Underemployment, and Compensation Dissatisfaction.
| VARIABLE | EST. | SE | p |
|---|---|---|---|
| Intercept Wave 6 (reference group: veterans with job turnover and neither*) | |||
| Job turnover and only dissatisfied with pay | 7.66 | 9.69 | 0.429 |
| Job turnover and only underemployed | –6.09 | 4.68 | 0.193 |
| Job turnover and both underemployed and dissatisfied with pay | 4.66 | 5.60 | 0.405 |
| Change in salary between Waves 6 and 7 (Question 2) Salary change (everyone goes up by $4,000) | 4.23 | 0.78 | <.0001 |
| Salary change (reference group: neither*) | |||
| Only dissatisfied with pay (make $13.69) | 9.46 | 3.19 | 0.003 |
| Only underemployed | 0.64 | 1.34 | 0.633 |
| Both underemployed and dissatisfied with pay | 6.03 | 2.33 | 0.010 |
| Salary change for veterans with job turnover | 0.85 | 2.74 | 0.757 |
| Salary change for veterans with job turnover (reference group: neither*) | |||
| Job turnover and only dissatisfied with pay | 6.29 | 9.21 | 0.495 |
| Job turnover and only underemployed | 10.81 | 4.15 | 0.009 |
| Job turnover and both underemployed and dissatisfied with pay | 7.84 | 5.02 | 0.119 |
[i] Note. Neither* in the table refers to neither dissatisfied with pay or underemployed. Race/ethnicity was not a significant predictor of changes in salary.
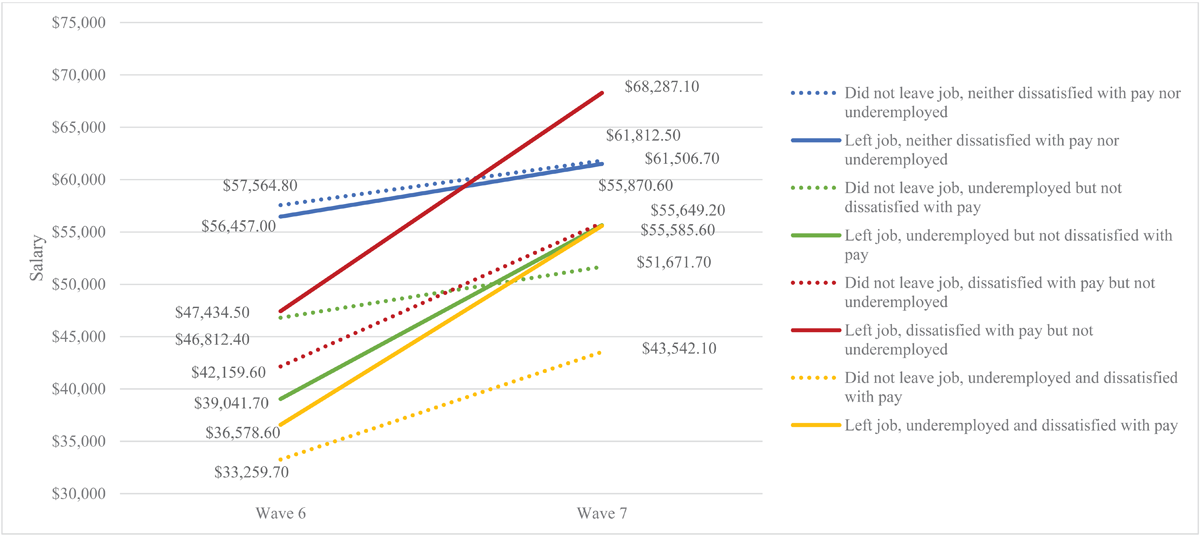
Figure 2
Interaction Between Underemployment, Dissatisfaction with Compensation, and Job Turnover on Salary Change.
Note. Estimates are for a male, E4 pay grade, with a bachelor’s degree.