
Table 1
Type I and Type II errors.
| Reality | |||
| Ho is true: no difference between ACJ and traditional peer sharing and feedback | Ho is false: there is a difference between ACJ and traditional peer sharing and feedback | ||
| Result of statistical test within an empirical study of a sample | Evidence to reject Ho | False positive Type I error Probability = α | Correct decision True positive Probability = 1 – β |
| No evidence to reject Ho | Correct decision True negative Probability = 1 – α | False negative Type II error Probability = β | |
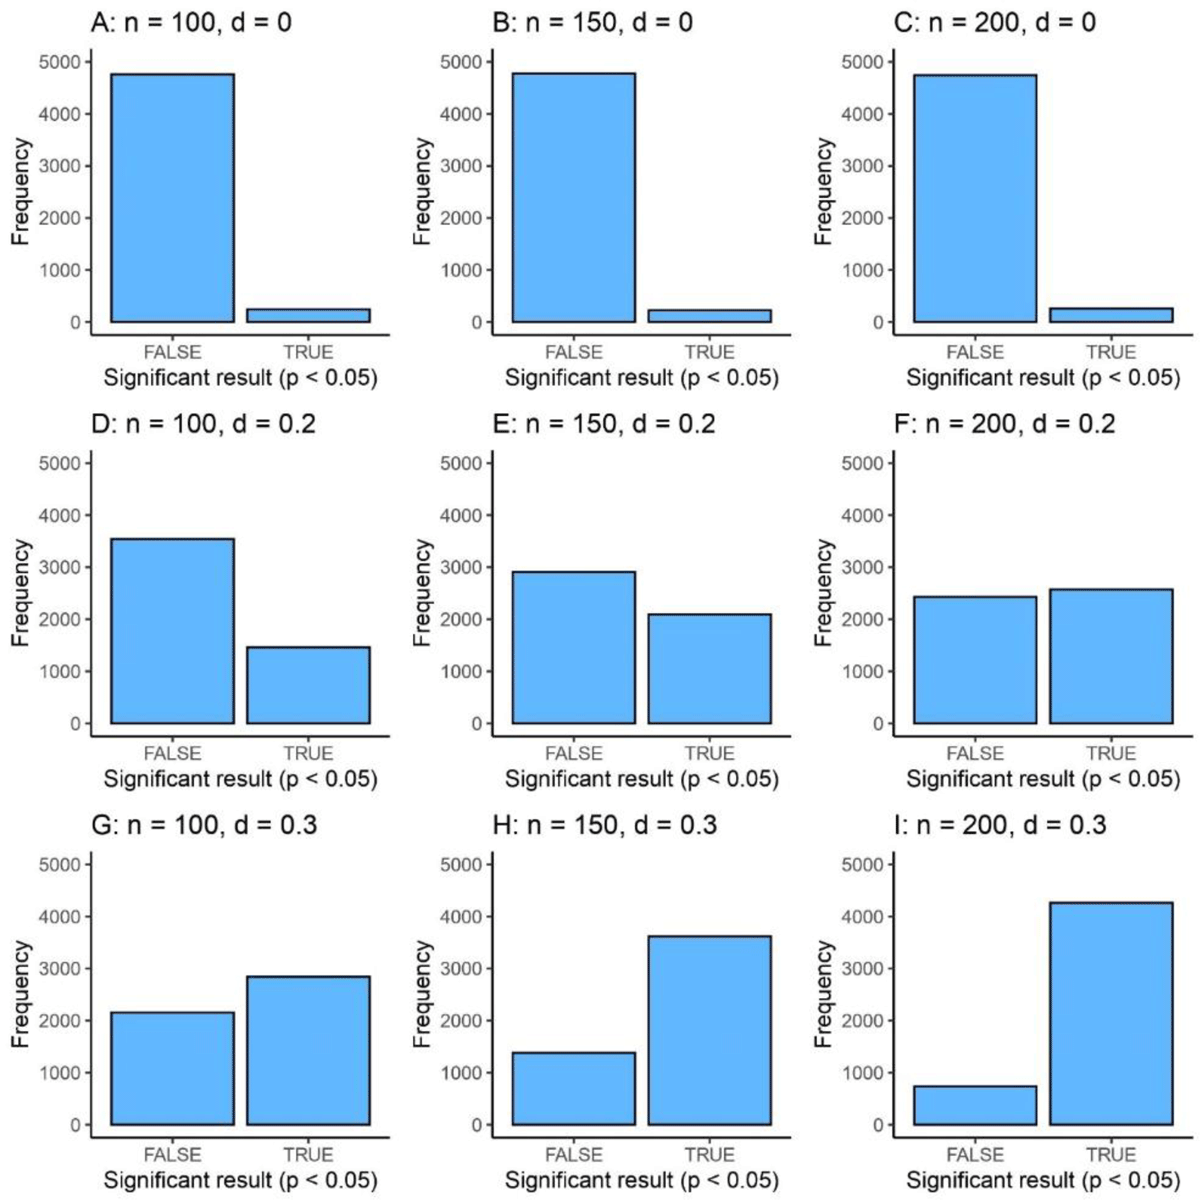
Figure 1
Results of power analysis for d = 0, 0.2, and 0.3 with n per group = 100, 150, and 200.
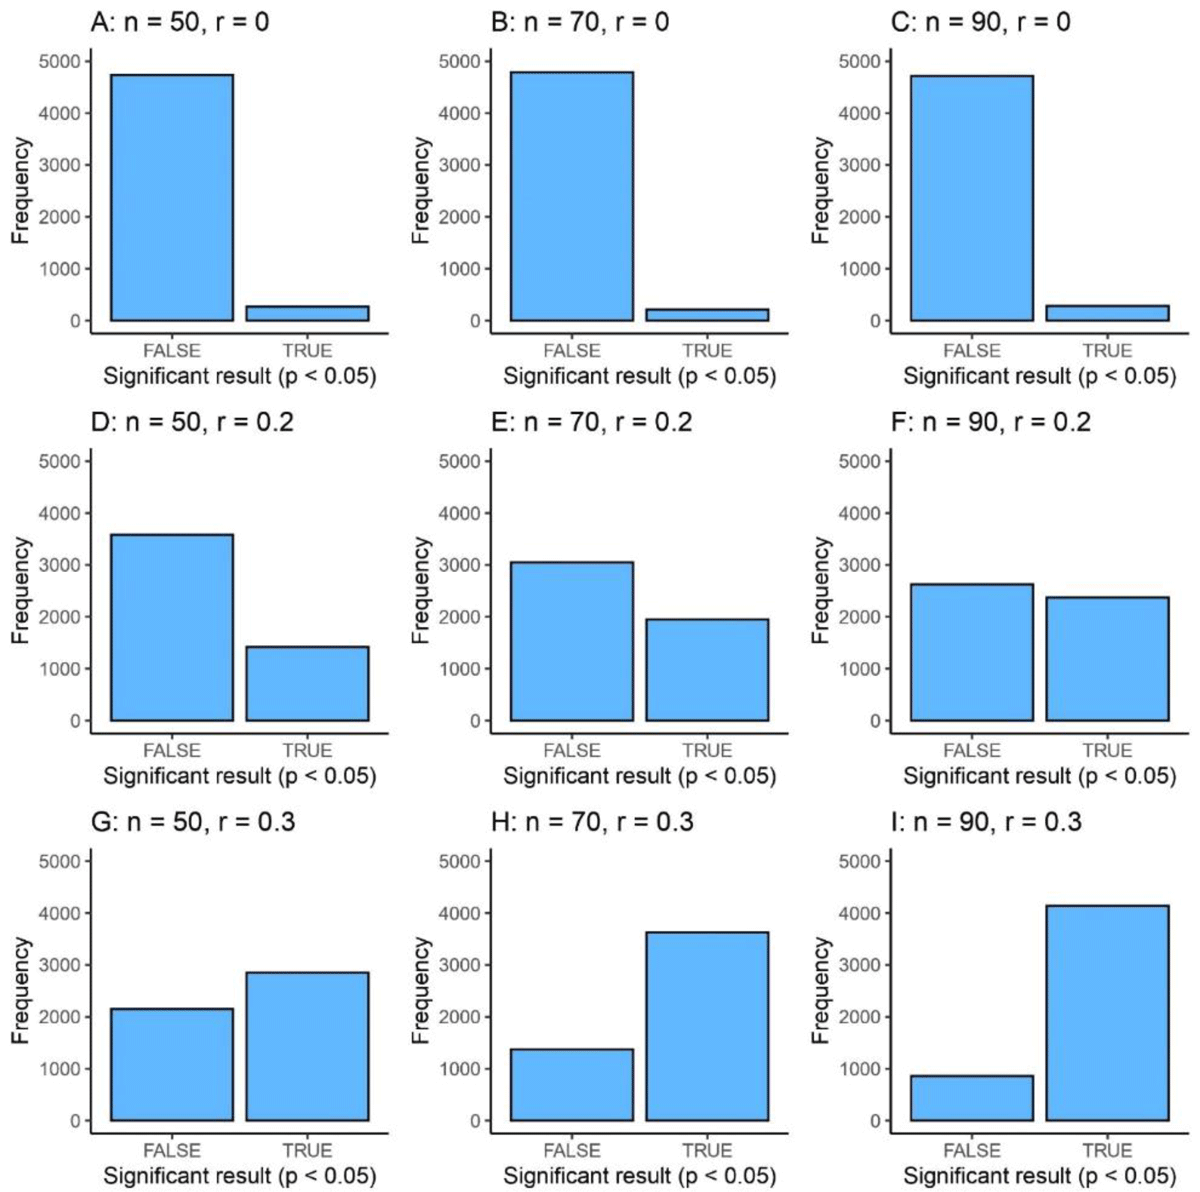
Figure 2
Results of power analysis for r = 0, 0.2, and 0.3 with n = 50, 70, and 90.
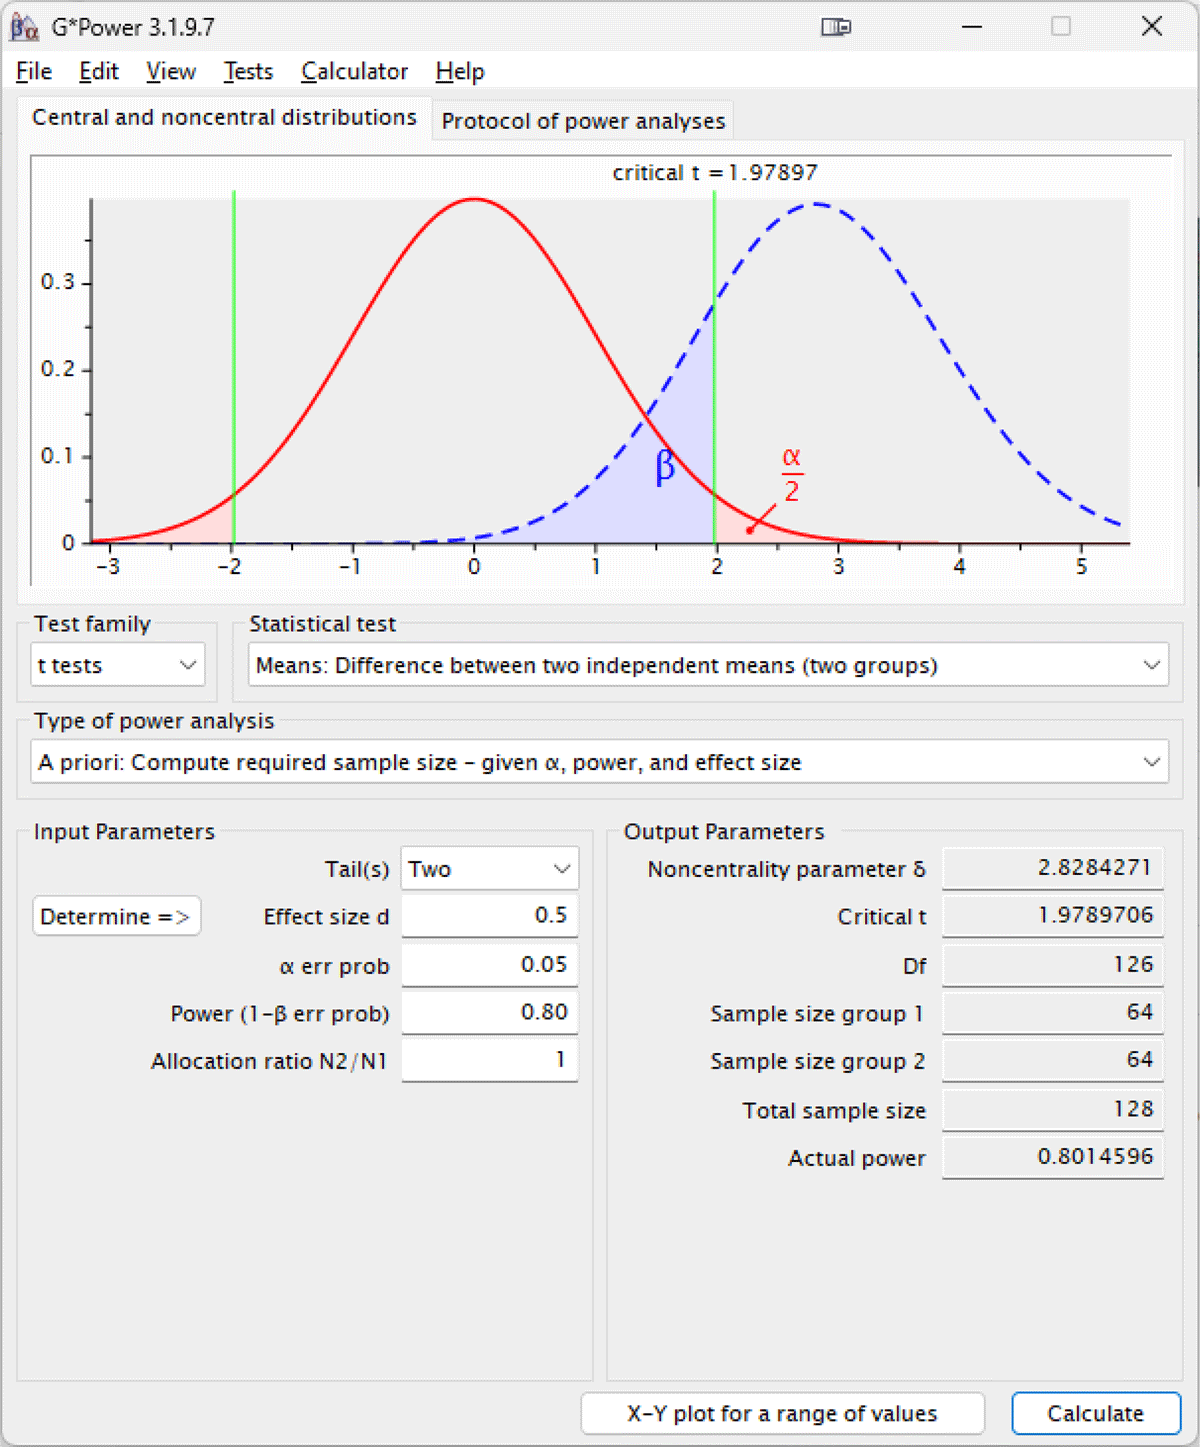
Figure 3
G*Power interface for conducting a power analysis for an independent samples t-test.
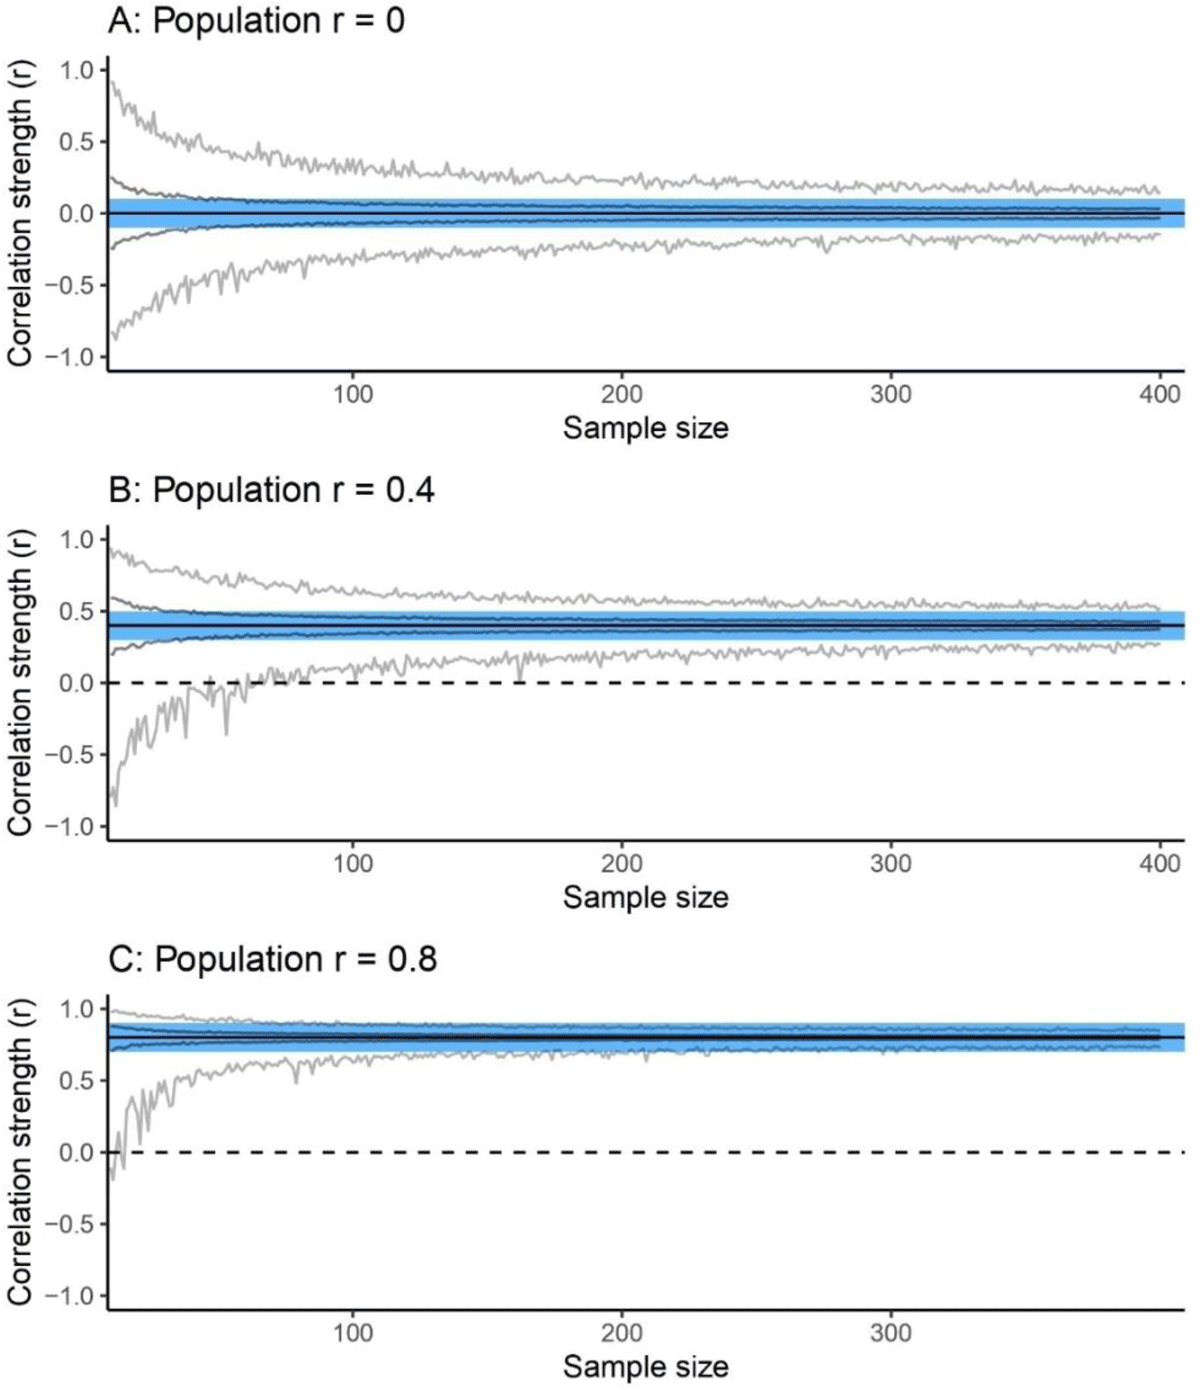
Figure 4
Sample size × effect size simulations.