
Table 1
World production of iron and the associated effective release of O2 to the atmosphere, totalled for each calendar year. While the most likely mix of iron-bearing minerals is 80% hematite and 20% magnetite (by mole), we include other (extreme) scenarios as a sensitivity study. Data from Tuck (2020a).
| YEAR | WORLD PRODUCTION OF REDUCED IRON (Pg) | ANNUALLY INTEGRATED O2 SOURCE (Tmol) ASSUMING 80% HEMATITE | ANNUALLY INTEGRATED O2 SOURCE (Tmol) ASSUMING 50% HEMATITE | ANNUALLY INTEGRATED O2 SOURCE (Tmol) ASSUMING 95% HEMATITE |
|---|---|---|---|---|
| 1990 | 0.54 | 7.09 | 6.85 | 7.21 |
| 1991 | 0.52 | 6.80 | 6.57 | 6.92 |
| 1992 | 0.50 | 6.52 | 6.30 | 6.64 |
| 1993 | 0.50 | 6.52 | 6.30 | 6.63 |
| 1994 | 0.51 | 6.76 | 6.53 | 6.88 |
| 1995 | 0.55 | 7.24 | 7.00 | 7.37 |
| 1996 | 0.55 | 7.18 | 6.94 | 7.30 |
| 1997 | 0.59 | 7.68 | 7.42 | 7.81 |
| 1998 | 0.57 | 7.53 | 7.27 | 7.66 |
| 1999 | 0.56 | 7.35 | 7.10 | 7.48 |
| 2000 | 0.60 | 7.93 | 7.66 | 8.07 |
| 2001 | 0.59 | 7.73 | 7.46 | 7.86 |
| 2002 | 0.61 | 8.07 | 7.80 | 8.21 |
| 2003 | 0.64 | 8.41 | 8.13 | 8.56 |
| 2004 | 0.75 | 9.87 | 9.54 | 10.04 |
| 2005 | 0.84 | 11.07 | 10.69 | 11.26 |
| 2006 | 0.96 | 12.66 | 12.23 | 12.87 |
| 2007 | 1.07 | 14.05 | 13.57 | 14.29 |
| 2008 | 1.13 | 14.84 | 14.33 | 15.09 |
| 2009 | 1.09 | 14.31 | 13.83 | 14.56 |
| 2010 | 1.17 | 15.36 | 14.84 | 15.63 |
| 2011 | 1.24 | 16.28 | 15.73 | 16.56 |
| 2012 | 1.26 | 16.55 | 15.98 | 16.83 |
| 2013 | 1.34 | 17.60 | 17.00 | 17.90 |
| 2014 | 1.45 | 19.04 | 18.39 | 19.37 |
| 2015 | 1.46 | 19.17 | 18.52 | 19.50 |
| 2016 | 1.47 | 19.30 | 18.65 | 19.63 |
| 2017 | 1.50 | 19.70 | 19.03 | 20.03 |
| 2018 | 1.52 | 19.96 | 19.28 | 20.30 |
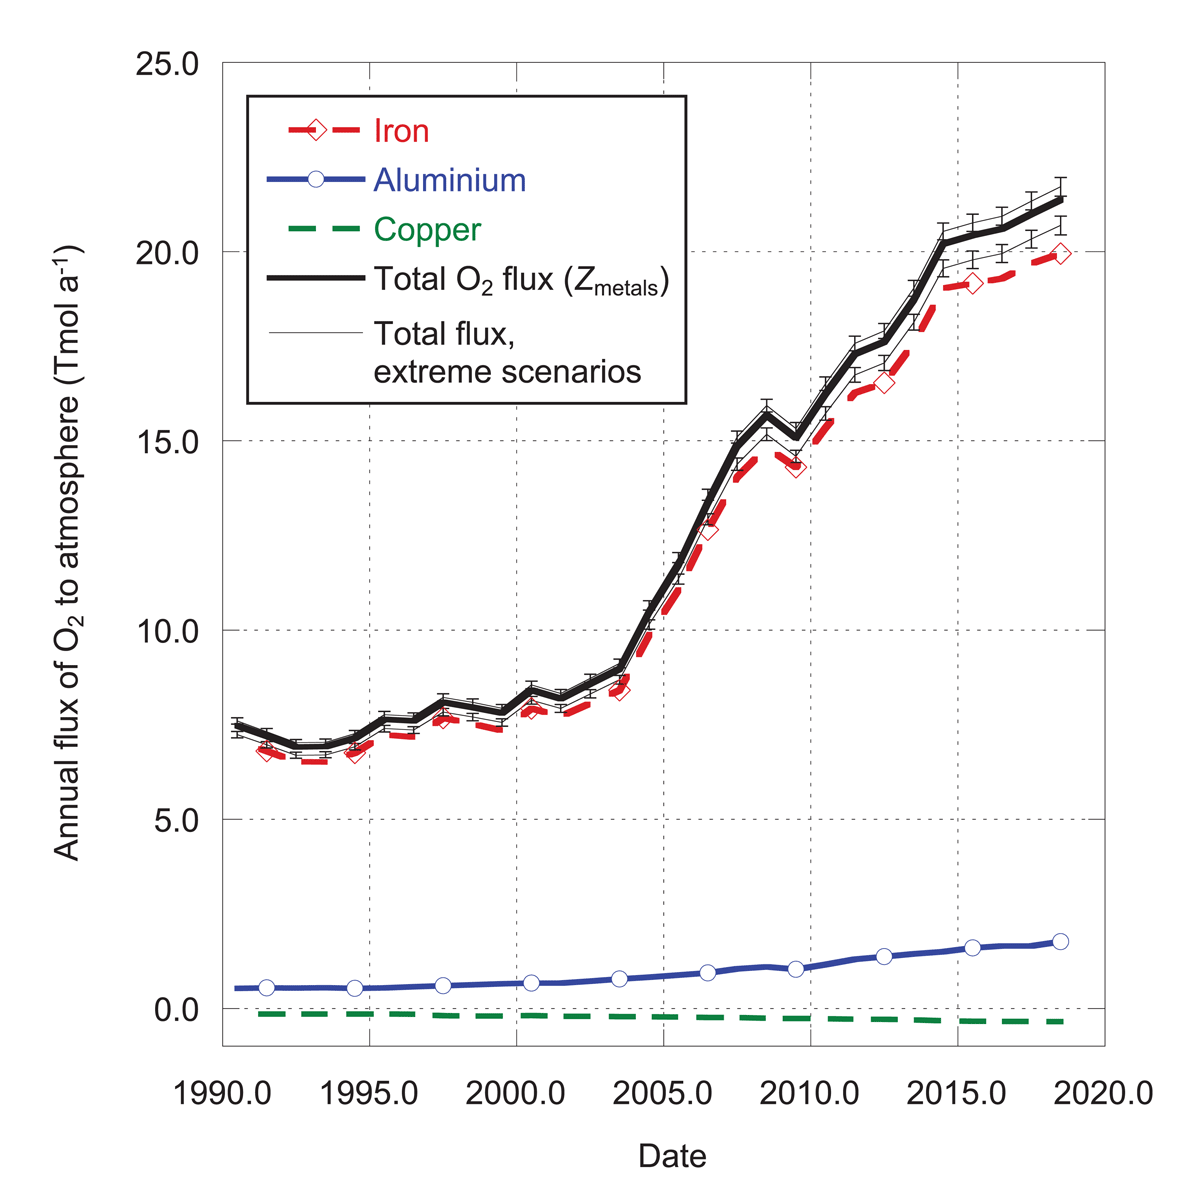
Figure 1
Effective fluxes of O2 to the atmosphere associated with production of various metals (1012 mol a–1). Negative values indicate a flux from the atmosphere. We assume iron is derived from 80% hematite and 20% magnetite (by mole). We assume copper is derived exclusively from sulfides. The heavy black line is the best estimate of total effective flux to the atmosphere from all sources (assuming an 80/20 mix of hematite and magnetite). The thin black lines show extreme cases (assuming 95% hematite and 50% hematite). Error bars on the extreme cases show the additional uncertainty (1σ) not originating from the unknown hematite/magnetite mix. Values are taken from Table 4, assigning the total annual value to the mid-year point and interpolating linearly.
Table 2
World production of aluminium and the associated effective release of O2 to the atmosphere, totalled for each calendar year. Data from Bray (2020a, b).
| YEAR | WORLD PRODUCTION OF REDUCED ALUMINIUM (Tg) | ANNUALLY INTEGRATED O2 SOURCE (Tmol) FROM REDUCTION OF ALUMINA |
|---|---|---|
| 1990 | 19.3 | 0.54 |
| 1991 | 19.7 | 0.55 |
| 1992 | 19.5 | 0.54 |
| 1993 | 19.8 | 0.55 |
| 1994 | 19.2 | 0.53 |
| 1995 | 19.7 | 0.55 |
| 1996 | 20.8 | 0.58 |
| 1997 | 21.7 | 0.60 |
| 1998 | 22.6 | 0.63 |
| 1999 | 23.6 | 0.66 |
| 2000 | 24.3 | 0.68 |
| 2001 | 24.3 | 0.68 |
| 2002 | 26.1 | 0.73 |
| 2003 | 28.0 | 0.78 |
| 2004 | 29.9 | 0.83 |
| 2005 | 31.9 | 0.89 |
| 2006 | 33.9 | 0.94 |
| 2007 | 37.9 | 1.05 |
| 2008 | 39.7 | 1.10 |
| 2009 | 37.2 | 1.03 |
| 2010 | 41.8 | 1.16 |
| 2011 | 46.8 | 1.30 |
| 2012 | 49.3 | 1.37 |
| 2013 | 52.1 | 1.45 |
| 2014 | 54.1 | 1.50 |
| 2015 | 57.8 | 1.61 |
| 2016 | 59.5 | 1.65 |
| 2017 | 59.5 | 1.65 |
| 2018 | 63.6 | 1.77 |
| 2019 | 63.2 | 1.76 |
Table 3
World production of copper and the associated removal of O2 from the atmosphere, totalled for each calendar year. We ignore copper produced from oxide minerals. We assume that 70% of the copper (by mole) comes from chalcopyrite, 15% from chalcocite and 10% from bornite (Sillitoe, 2021), with O2:Cu molar ratios of 29:8, 3:4 and 53:40, respectively. Production data from Flanagan (2021).
| YEAR | WORLD PRODUCTION OF REDUCED COPPER (Tg) | ANNUALLY INTEGRATED O2 SINK (Tmol) SULFIDES ONLY |
|---|---|---|
| 1990 | 8.62 | 0.15 |
| 1991 | 8.65 | 0.15 |
| 1992 | 8.73 | 0.15 |
| 1993 | 8.42 | 0.14 |
| 1994 | 8.43 | 0.14 |
| 1995 | 8.49 | 0.14 |
| 1996 | 9.05 | 0.15 |
| 1997 | 11.14 | 0.19 |
| 1998 | 11.40 | 0.19 |
| 1999 | 11.61 | 0.20 |
| 2000 | 11.02 | 0.19 |
| 2001 | 12.11 | 0.20 |
| 2002 | 12.19 | 0.21 |
| 2003 | 12.59 | 0.21 |
| 2004 | 12.81 | 0.22 |
| 2005 | 13.19 | 0.22 |
| 2006 | 13.73 | 0.23 |
| 2007 | 13.88 | 0.23 |
| 2008 | 15.03 | 0.25 |
| 2009 | 15.38 | 0.26 |
| 2010 | 15.85 | 0.27 |
| 2011 | 16.40 | 0.28 |
| 2012 | 16.88 | 0.29 |
| 2013 | 17.74 | 0.30 |
| 2014 | 19.20 | 0.32 |
| 2015 | 19.63 | 0.33 |
| 2016 | 19.96 | 0.34 |
| 2017 | 19.95 | 0.34 |
| 2018 | 20.27 | 0.34 |
Table 4
Net effective oxygen release to the atmosphere associated with all metals for each calendar year (i.e. the annually integrated value of Zmetals). Units are 1012 moles (Tmol). Upper and lower uncertainties are the quadrature sum of the variations arising from the hematite/magnetite scenarios and all other errors.
| YEAR | ANNUALLY INTEGRATED O2 SOURCE (Tmol) |
|---|---|
| 1990 | |
| 1991 | |
| 1992 | |
| 1993 | |
| 1994 | |
| 1995 | |
| 1996 | |
| 1997 | |
| 1998 | |
| 1999 | |
| 2000 | |
| 2001 | |
| 2002 | |
| 2003 | |
| 2004 | |
| 2005 | |
| 2006 | |
| 2007 | |
| 2008 | |
| 2009 | |
| 2010 | |
| 2011 | |
| 2012 | |
| 2013 | |
| 2014 | |
| 2015 | |
| 2016 | |
| 2017 | |
| 2018 |