
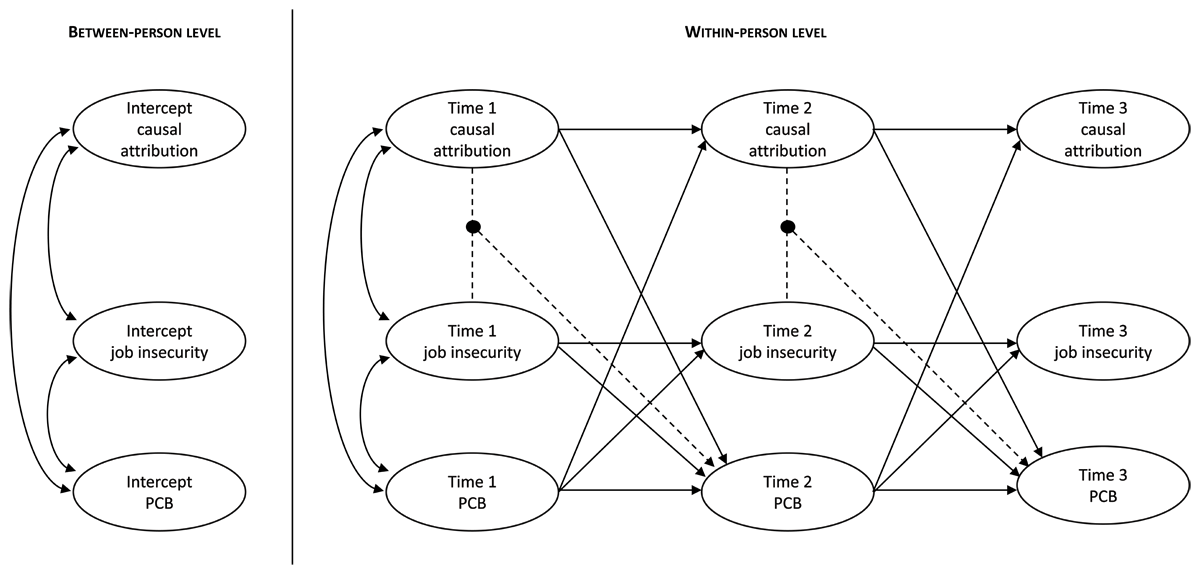
Figure 1
Random Intercept Cross-Lagged Panel Model with Latent Interactions between Job Insecurity and Causal Attribution in Relation to Future Psychological Contract Breach. PCB = Psychological Contract Breach.
Table 1
Means, Standard Deviations, and Correlation Matrix at the Between-Person Level (Below the Diagonal), as well as Correlation Matrix at the Within-Person Level (Above the Diagonal).
| VARIABLE | M | SD | 1 | 2 | 3 | 4 |
|---|---|---|---|---|---|---|
| 1. Job insecurity | 2.16 | 0.90 | – | .15*** | .16*** | .12*** |
| 2. Psychological contract breach | 2.60 | 0.82 | .28*** | – | .12*** | .04* |
| 3. Causal attribution to the organization | 2.79 | 1.21 | .39*** | .26*** | – | .25*** |
| 4. Causal attribution to external factors | 2.80 | 1.08 | .33*** | .15*** | .42*** | – |
[i] * p < .05; ** p < .01; *** p < .001.
Table 2
Results of the Final Baseline Random Intercept Cross-Lagged Panel Model.
| PATHS | UNSTANDARDIZED COEFFICIENT (B) | SE | 95% CI |
|---|---|---|---|
| Within-person level | |||
| Autoregressive paths | |||
| Job insecurity | 0.06 | .10 | [–0.12; 0.25] |
| Psychological contract breach | 0.26 | .09 | [0.08; 0.43] |
| Causal attribution to the organization | 0.08 | .07 | [–0.05; 0.23] |
| Causal attribution to external factors | 0.10 | .07 | [–0.04; 0.23] |
| Cross-lagged paths | |||
| Job insecurity → Psychological contract breach | 0.14 | .08 | [–0.02; 0.28] |
| Causal attribution to the organization → Psychological contract breach | –0.04 | .04 | [–0.12; 0.03] |
| Causal attribution to external factors → Psychological contract breach | –0.02 | .04 | [–0.10; 0.06] |
| Psychological contract breach → Job insecurity | 0.16 | .07 | [0.01; 0.29] |
| Psychological contract breach → Causal attribution to the organization | 0.09 | .12 | [–0.15; 0.31] |
| Psychological contract breach → Causal attribution to external factors | 0.01 | .10 | [–0.18; 0.21] |
| Between-person level | |||
| Covariances | |||
| Job insecurity – Psychological contract breach | 0.15 | .02 | [0.11; 0.20] |
| Job Insecurity – Causal attribution to the organization | 0.38 | .03 | [0.32; 0.43] |
| Job Insecurity – Causal attribution to external factors | 0.29 | .02 | [0.25; 0.34] |
| Psychological contract breach – Causal attribution to the organization | 0.21 | .03 | [0.15; 0.27] |
| Psychological contract breach – Causal attribution to external factors | 0.14 | .03 | [0.09; 0.19] |
| Causal attribution to the organization – Causal attribution to external factors | 0.40 | .03 | [0.34; 0.46] |
[i] Note: SE = Standard error. 95% CI = Bayesian 95% Credibility Interval. Equality constraints were introduced on the unstandardized regression coefficients, and not on the standardized coefficients. The standardized coefficients can differ even if the unstandardized paths are constrained to be equal. Therefore, the standardized coefficients are not presented to present results unambiguously.
Table 3
Summary Results of the Sequential Interaction Random Intercept Cross-Lagged Panel Models with an Increasing Number of Iterations.
| NUMBER OF ITERATIONS | PATH | MODERATOR | |||||||
|---|---|---|---|---|---|---|---|---|---|
| CAUSAL ATTRIBUTION TO THE ORGANIZATION | CAUSAL ATTRIBUTION TO EXTERNAL FACTORS | ||||||||
| LARGEST PSR VALUE FOR FINAL 100 ITERATIONS | UNSTANDARDIZEDCOEFFICIENT (B) | SE | 95% CI | LARGEST PSR VALUE FOR FINAL 100 ITERATIONS | UNSTANDARDIZEDCOEFFICIENT (B) | SE | 95% CI | ||
| 50,000 | job insecurity*moderator at T1 → PCB at T2 | 1.19 | –0.05 | .07 | [–0.17; 0.09] | 1.80 | 0.18 | .09 | [0.01; 0.38] |
| job insecurity*moderator at T2 → PCB at T3 | 0.22 | .12 | [0.002; 0.48] | 0.14 | .13 | [–0.13; 0.43] | |||
| 75,000 | job insecurity*moderator at T1 → PCB at T2 | 1.07 | –0.05 | .07 | [–0.18; 0.09] | 1.10 | 0.16 | .09 | [–0.01; 0.35] |
| job insecurity*moderator at T2 → PCB at T3 | 0.24 | .13 | [0.01; 0.50] | 0.12 | .13 | [–0.12; 0.39] | |||
| 100,000 | job insecurity*moderator at T1 → PCB at T2 | 1.02 | –0.05 | .07 | [–0.19; 0.08] | 1.06 | 0.17 | .08 | [0.01; 0.33] |
| job insecurity*moderator at T2 → PCB at T3 | 0.23 | .14 | [–0.01; 0.52] | 0.13 | .13 | [–0.11; 0.39] | |||
| 125,000 | job insecurity*moderator at T1 → PCB at T2 | 1.03 | –0.05 | .07 | [–0.19; 0.08] | 1.04 | 0.17 | .08 | [0.02; 0.33] |
| job insecurity*moderator at T2 → PCB at T3 | 0.24 | .14 | [–0.02; 0.53] | 0.13 | .13 | [–0.13; 0.39] | |||
[i] Note: PCB = Psychological contract breach. PSR = potential scale reduction. SE = Standard error. 95% CI = Bayesian 95% Credibility Interval.
Table 4
Results of the Final Interaction Random Intercept Cross-Lagged Panel Models with either Causal Attribution to the Organization or Causal Attribution to External Factors as the Moderator.
| PATH | MODERATOR | |||||
|---|---|---|---|---|---|---|
| CAUSAL ATTRIBUTION TO THE ORGANIZATION | CAUSAL ATTRIBUTION TO EXTERNAL FACTORS | |||||
| UNSTANDARDIZED COEFFICIENT (B) | SE | 95% CI | UNSTANDARDIZED COEFFICIENT (B) | SE | 95% CI | |
| Within-person level | ||||||
| Autoregressive paths | ||||||
| Job insecurity | 0.05 | .09 | [–0.11; 0.24] | 0.06 | .10 | [–0.11; 0.27] |
| Psychological contract breach | 0.26 | .09 | [0.07; 0.42] | 0.26 | .10 | [0.07; 0.44] |
| Moderator | 0.08 | .07 | [–0.06; 0.20] | 0.12 | .07 | [–0.03; 0.24] |
| Cross-lagged paths | ||||||
| Job insecurity → PCB | 0.10 | .07 | [–0.03; 0.23] | 0.14 | .08 | [–0.02; 0.28] |
| Moderator → PCB | –0.04 | .03 | [–0.10; 0.03] | 0.00 | .04 | [–0.08; 0.08] |
| Job insecurity * moderator at T1 → PCB at T2 | –0.05 | .07 | [–0.19; 0.08] | 0.17 | .08 | [0.01; 0.33] |
| Job insecurity * moderator at T2 → PCB at T3 | 0.23 | .14 | [–0.01; 0.52] | 0.13 | .13 | [–0.11; 0.39] |
| PCB → Job insecurity | 0.15 | .06 | [0.03; 0.26] | 0.18 | .07 | [0.05; 0.31] |
| PCB → Moderator | 0.12 | .11 | [–0.08; 0.38] | 0.09 | .09 | [–0.10; 0.25] |
| Between-person level | ||||||
| Covariances | ||||||
| Job insecurity – PCB | 0.15 | .02 | [0.11; 0.19] | 0.15 | .02 | [0.10; 0.19] |
| Job Insecurity – Moderator | 0.37 | .03 | [0.32; 0.42] | 0.29 | .03 | [0.24; 0.34] |
| PCB – Moderator | 0.20 | .03 | [0.14; 0.26] | 0.12 | .03 | [0.06; 0.17] |
[i] Note: PCB = Psychological contract breach. SE = Standard error. 95% CI = Bayesian 95% Credibility Interval. Equality constraints were introduced on the unstandardized coefficients of all cross-lagged paths (with an exception for the interaction terms), and not on the standardized coefficients. The standardized coefficients can differ even if the unstandardized paths are constrained to be equal. Therefore, the standardized coefficients are not presented to present results unambiguously.
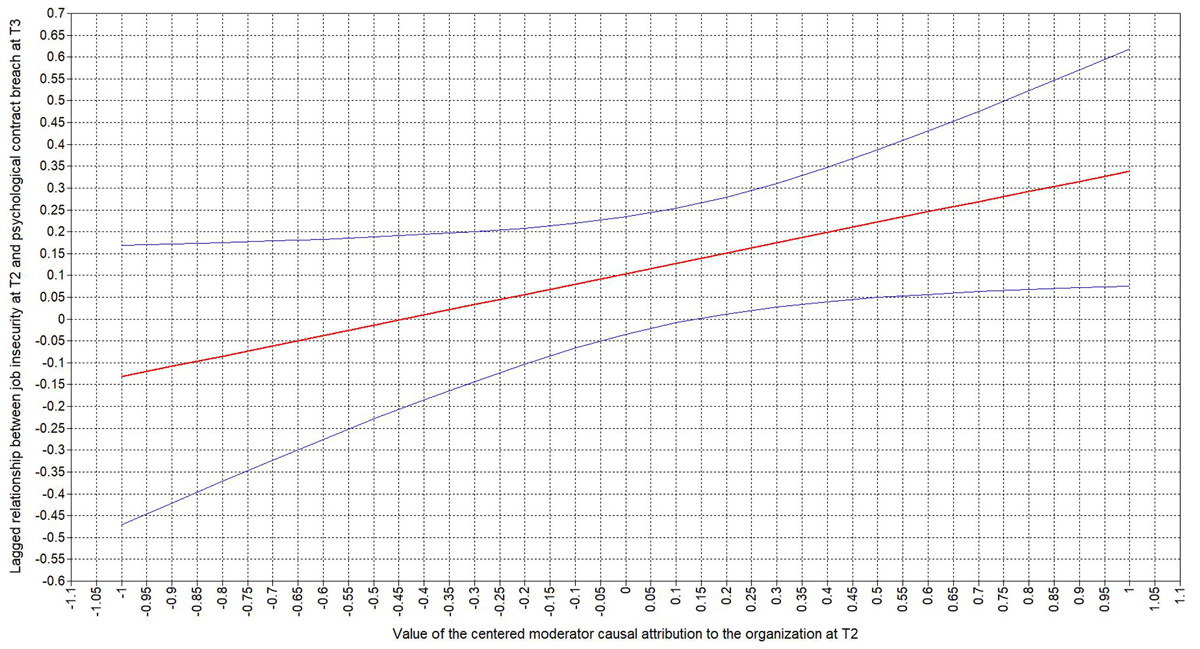
Figure 2
Loop Plot Displaying the Lagged Relationship between Job Insecurity at Time 2 and Psychological Contract Breach at Time 3 for Different Values of the Centered Moderator Causal Attribution to the Organization at Time 2, as well as the Credibility Bands of this Relationship.
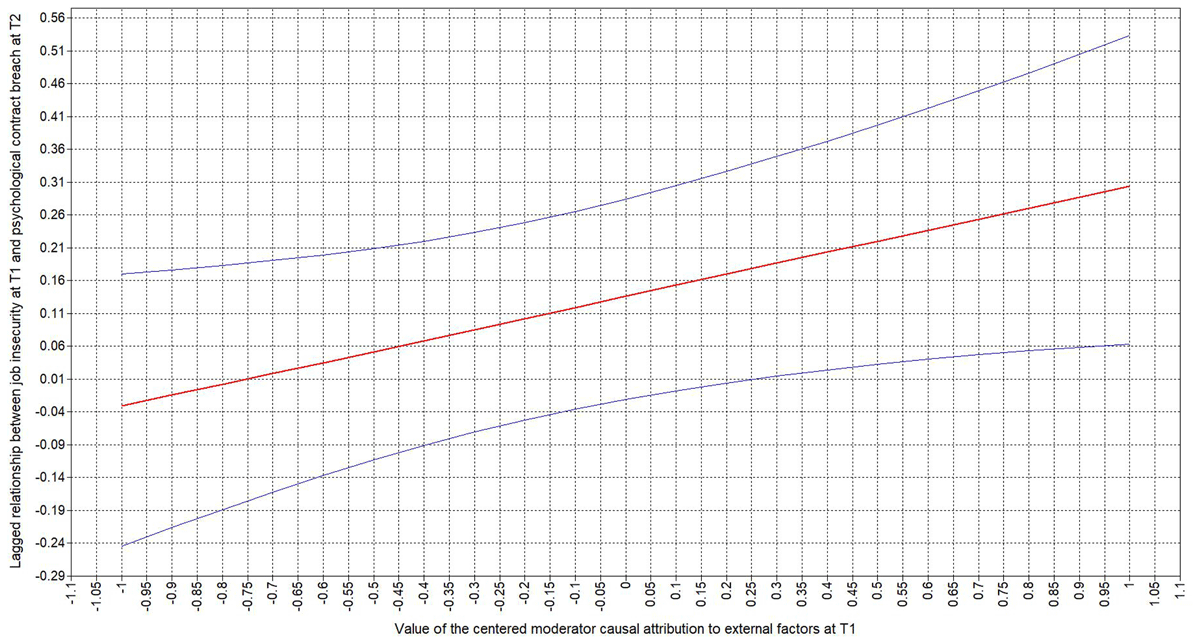
Figure 3
Loop Plot Displaying the Lagged Relationship between Job Insecurity at Time 1 and Psychological Contract Breach at Time 2 for Different Values of the Centered Moderator Causal Attribution to External Factors at Time 1, as well as the 95% Credibility Bands of this Relationship.