
Table 1
Framework for analysing the quantitative literacy demands of higher education (Frith and Prince, 2009: 89).
| Competence | Examples/Elaboration | |
|---|---|---|
| 1 Knowing the conventions | 1.1 Understanding verbal representations of quantitative concepts | This involves knowing the meanings of quantitative terms and phrases, and the mathematical and statistical concepts that these words refer to; it also includes knowledge of systems of units of measurement. |
| 1.2 Understanding symbolic representations of quantitative concepts | This involves knowing the conventions for the symbolic representation of numbers, measurements, variables and operations, for example:
| |
| 1.3 Understanding visual representations of quantitative concepts | This involves knowing the conventions for the representation of data in tables, charts, graphs and diagrams (such as tree diagrams, scale and perspective drawings, and other visual representations of spatial or conceptual entities), for example:
| |
| 2 Identifying and distinguishing | 2.1 Identifying connections and distinctions between different representations of quantitative concepts | This involves locating the relevant connections between different representations, for example:
|
| 2.2 Identifying the mathematics to be done and strategies to do it | This involves identifying which mathematical concepts or methods are relevant in a context, for example:
| |
| 2.3 Identifying relevant and irrelevant information in representations | This involves identifying which information provided is relevant in a particular context, for example:
| |
| 3 Deriving meaning | 3.1 Making meaning from representations | This includes understanding a verbal description of a quantitative concept, situation or process. It also involves deriving meaning from representations of contextualized data by, for example:
|
Finally, it includes deriving meaning from graphical representations of relationships, for example:
| ||
| 4 Doing mathematics | 4.1 Using mathematical methods | This involves using mathematical methods to solve a problem or clarify understanding, for example:
|
| 5 Higher order thinking | 5.1 Synthesising | This involves synthesizing information or ideas from more than one source, for example, reading information from a chart and from a table and using them to understand a situation. |
| 5.2 Logical Reasoning | This involves identifying whether a claim is supported by the available evidence, formulating conclusions that can be made given specific evidence, and identifying the evidence necessary to support a claim. | |
| 5.3 Conjecturing | This involves formulating appropriate questions and conjectures, in order to make sense of quantitative information, and recognizing the tentativeness of conjectures based on insufficient evidence. | |
| 5.4 Interpreting and reflecting or evaluating | This involves interpreting quantitative information in terms of the context in which it is embedded by, for example, interpreting the results of the calculations in the original context. | |
| 6 Expressing quantitative concepts | 6.1 Representing quantitative information using appropriate representational conventions | This includes choosing appropriate representations of quantitative information, and expressing quantitative information in a context: verbally, symbolically, graphically, diagrammatically or in tabular form. |
| 6.2 Describing quantitative ideas and relationships using appropriate language | This involves: identifying appropriate/correct descriptions of quantitative ideas, patterns, comparisons, trends, relationships; describing quantitative ideas, patterns, and comparisons between quantities, trends and relationships; and explaining reasoning (by linking evidence and claims). |
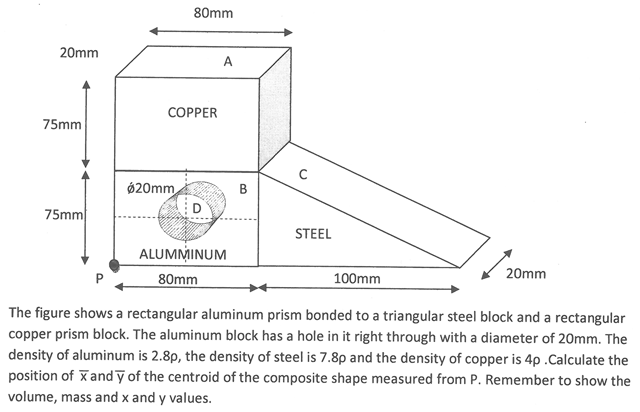
Figure 1
Applied mechanics test question on centroid of a composite object.
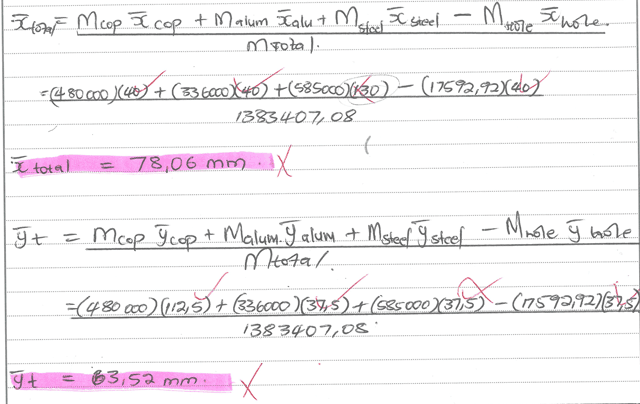
Figure 2
Extract of a student answer to applied mechanics test question on centroid of a composite object.
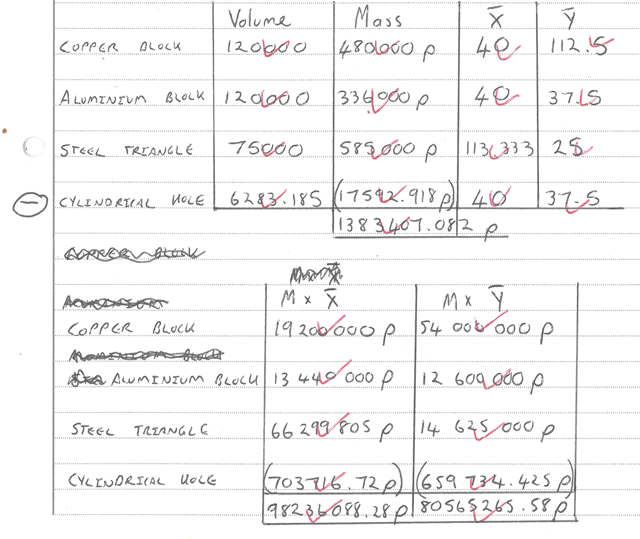
Figure 3
Extract of a second student’s answer to applied mechanics test question on centroid of a composite object.
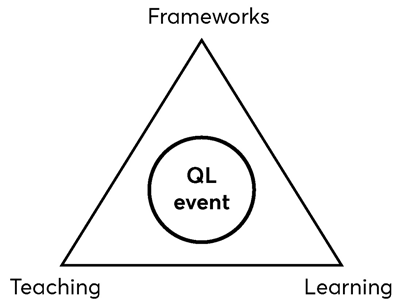
Figure 4
A meta-frame for analysing quantitative literacy events.