
Table 1
Overview of numbers of participants, grades, schools, teachers and science subjects.
| School | Number of students (n) | Grade | Teachers involved | Subject and period | |
|---|---|---|---|---|---|
| Trial (2015) | School 1 | N = 60 | 8th | 2 | Microbiology 6 weeks |
| Trial (2016) | School 2 | N = 27 | 7th | 1 | Photosynthesis and respiration 6 weeks |
| Trial (2016) | School 2 | N = 26 | 7th | 1 (same as second trial) | Photosynthesis and respiration 6 weeks |
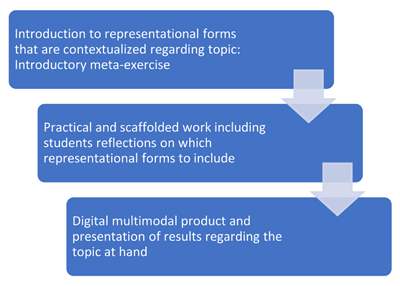
Figure 1
Design principles.
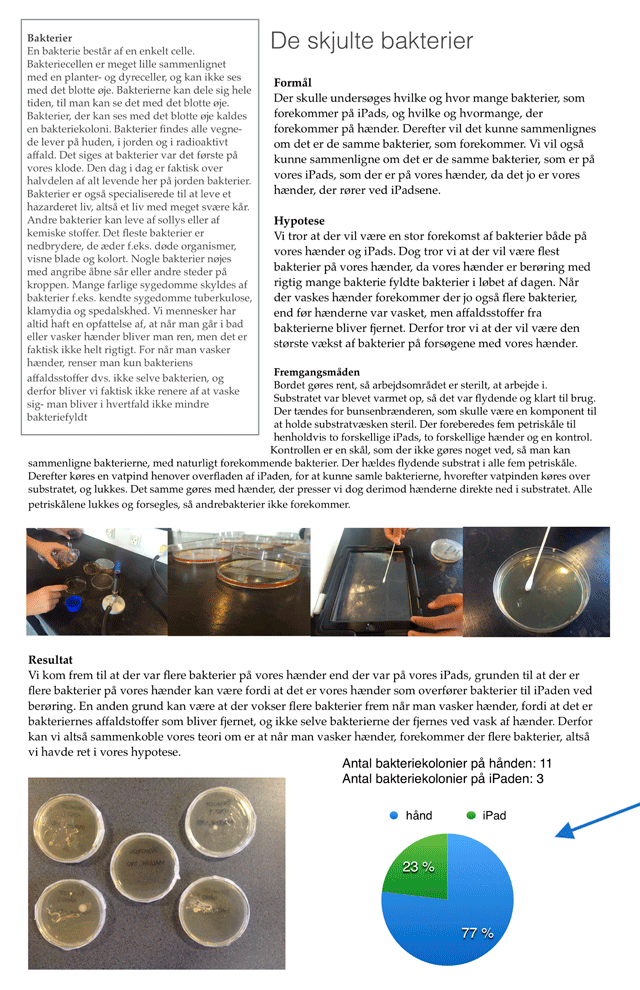
Figure 2
Students’ multimodal digital product from the first iteration, which employed various modes, including a pie chart to illustrate the distribution of bacteria on a hand and on the surface of an iPad.
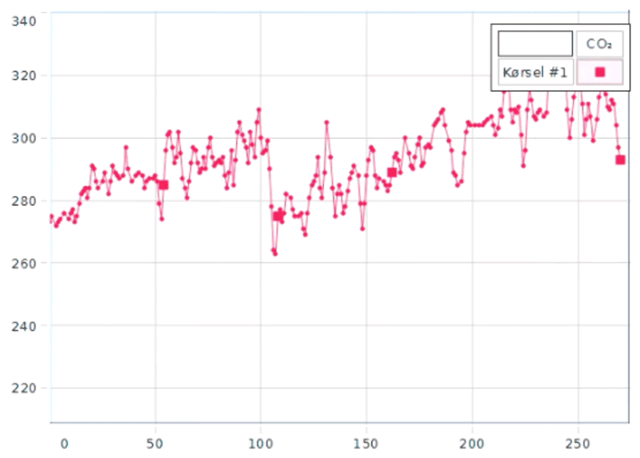
Figure 3
Graph from one of the multimodal digital products generated by students during the second iteration and illustrating the CO2 concentrations over time in a closed container containing a plant exposed to varying light intensities.
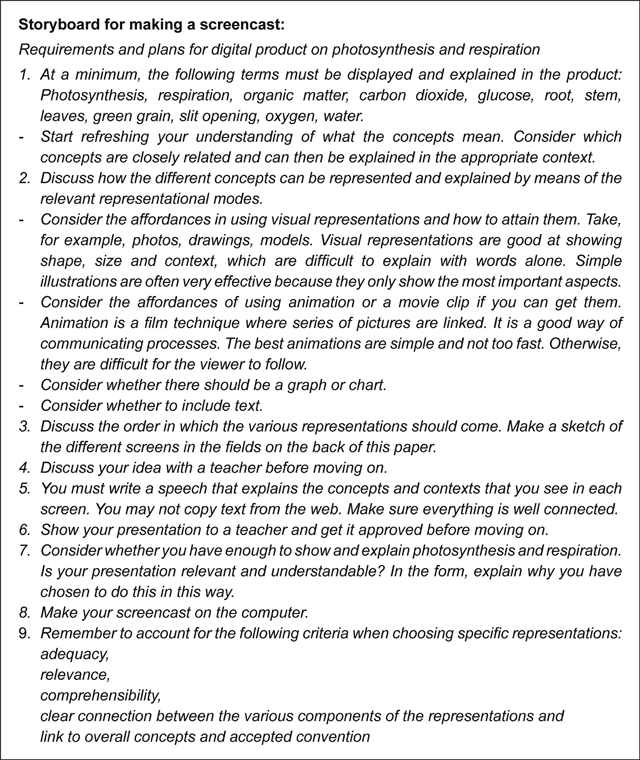
Figure 4
Storyboard provided to the students to increase scaffolding in their process of making a digital multimodal representation.
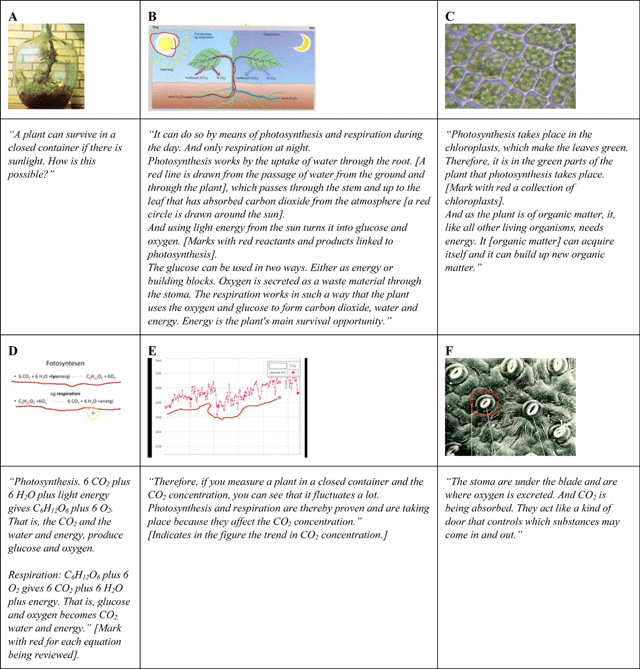
Figure 5
An example of a student screencast about photosynthesis and respiration. Here reproduced with screen dumps and transcriptions of the associated speech.