Figure 1.
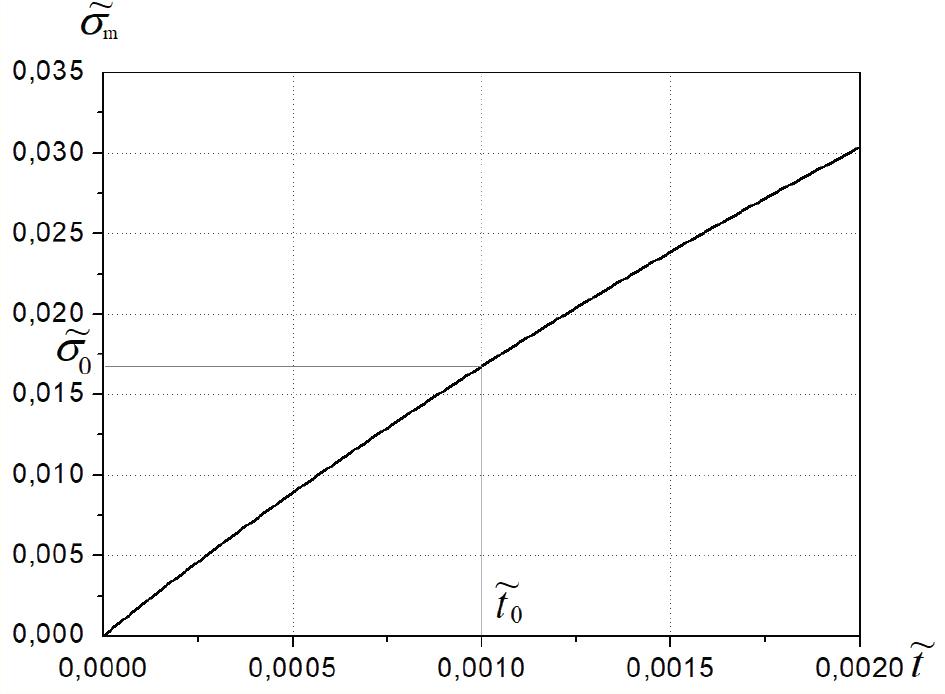
Figure 2.
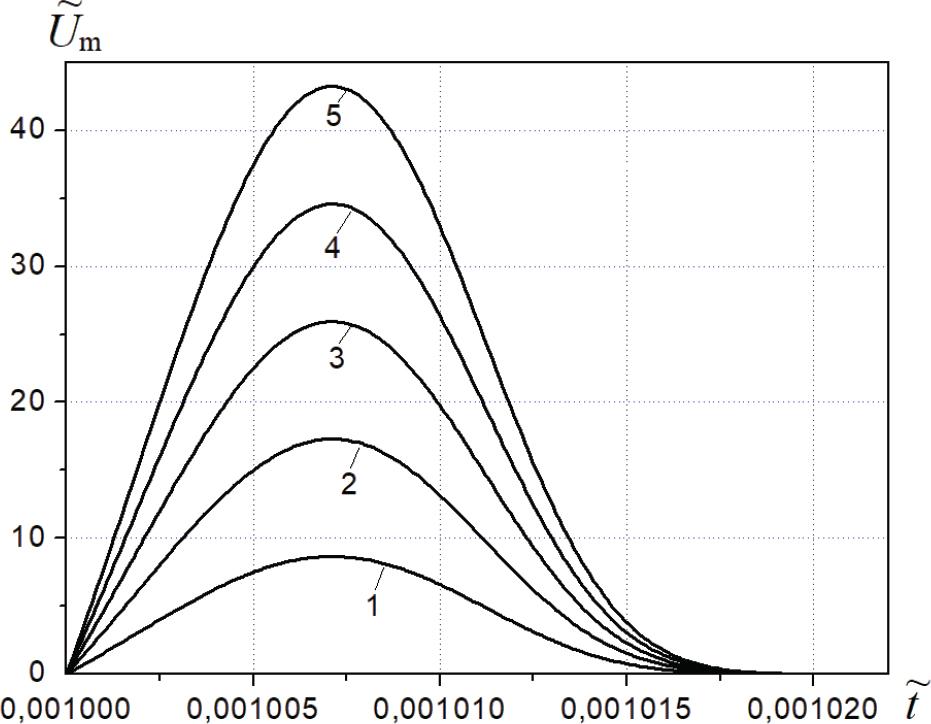
Figure 3.
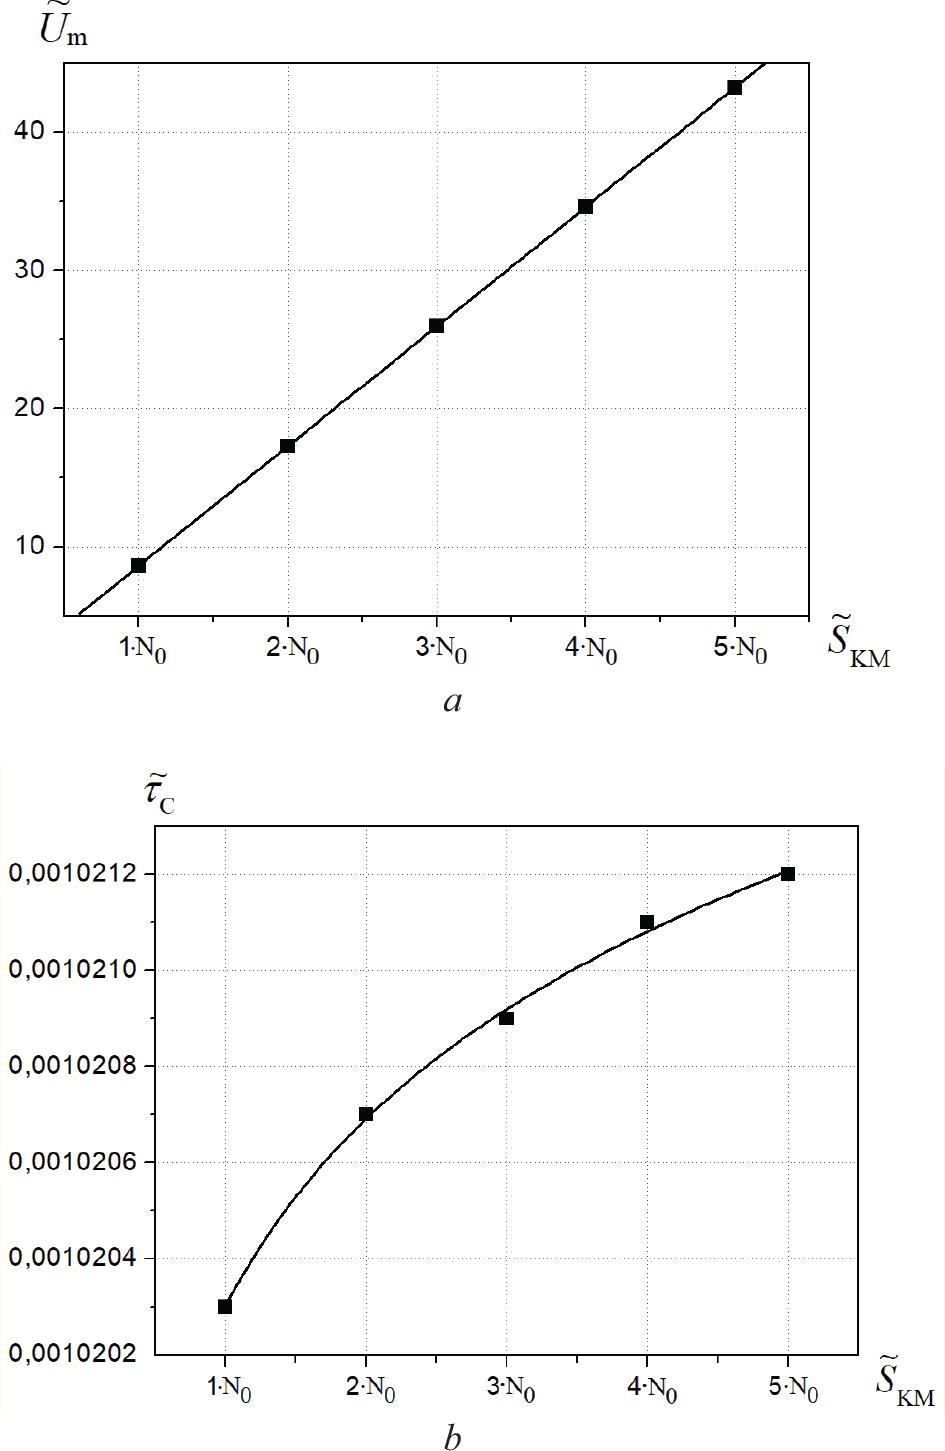
Figure 4.
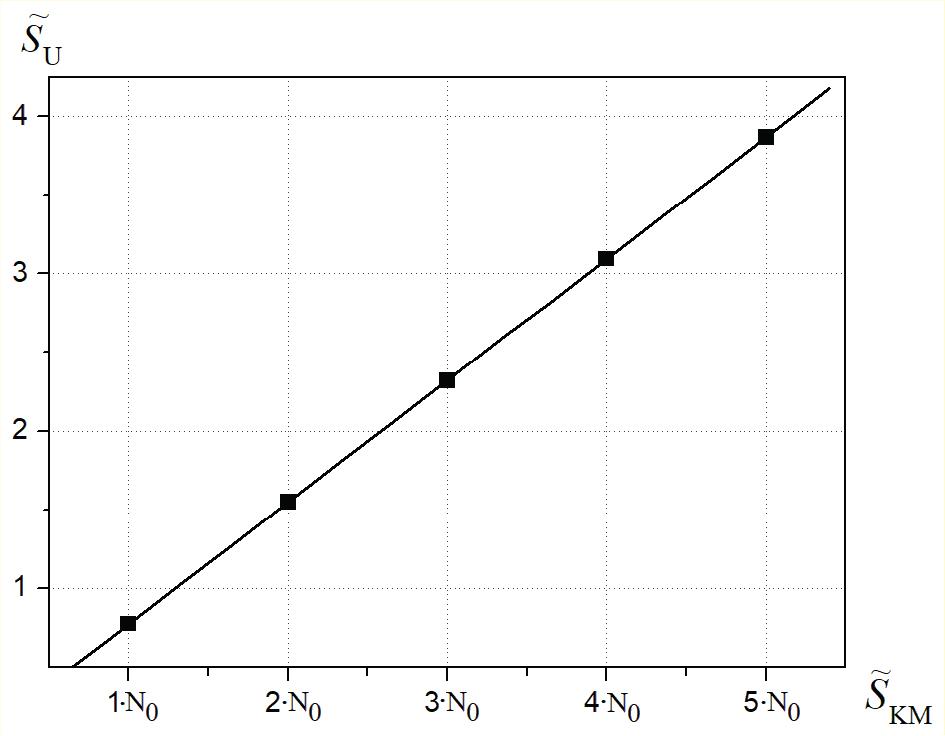
Figure 5.

© 2025 Sergii Filonenko, Anzhelika Stakhova, published by Łukasiewicz Research Network – Industrial Research Institute for Automation and Measurements PIAP
This work is licensed under the Creative Commons Attribution-NonCommercial-NoDerivatives 4.0 License.