

Composite materials (CM) are widely used in various industries due to their desirable physical and mechanical properties, temperature resistance, and durability [1–5]. Despite these advantages, composite materials are susceptible to damage at the micro level under static and dynamic loads, which can lead to rapid failure processes that propagate in an avalanchelike manner. Understanding and predicting these failure mechanisms has driven extensive theoretical and experimental research, with the aim of developing reliable criteria to assess CM conditions and prevent failure [6–9].
Among the various methods for studying material failure, the acoustic emission (AE) technique has proven particularly effective in monitoring the deformation and fracture processes in composite materials [10–12]. AE provides valuable information across multiple scales–from sub-micro to macro–about the internal structural changes during loading. However, the complexity of the failure processes in composite materials introduces challenges in interpreting AE data, making it difficult to accurately identify the underlying damage mechanisms.
Existing AE models, such as the fiber bundle model (FBM) [13,14], have been instrumental in simulating composite material failure under uniaxial tension and transverse forces. These models, while insightful, often focus on the statistical representation of AE signals without fully addressing signal formation during the failure of individual CM elements. For instance, AE signals are commonly represented as stochastic decaying signals, and their cumulative energy distribution is analyzed as failure approaches [15–17]. However, further research is needed to clarify how specific factors, such as the extent of the damage area, influence AE signal parameters during composite material failure.
This study addresses this gap by analyzing the changes in amplitude-time parameters of AE signals as the damage area in composite materials increases, using the Mises criterion and the FBM model. The study’s findings aim to enhance the accuracy of AE signal interpretation, providing a stronger foundation for developing methods to monitor, diagnose, and predict the failure of composite materials.
The analysis of failure processes in composite materials includes both theoretical [18,19] and experimental [20–22] studies. These investigations aim to predict the stages of deformation and failure in CM. Typically, two main approaches are used for assessing damage in composites: the application of various failure criteria based on stress analysis and the use of damage mechanics methods, which examine the evolution of damage (initiation and progression of failures) [23]. In modeling, the finite element method is used to calculate changes in stresses – stress waves that are treated as AE waves [24].
At the same time, various models are used to analyze failure processes in composite materials: the discrete damage model [25], the smeared damage model [26], and others. The model of CM as a bundle of fibers is also widely used for studying failure processes [27,28]. These studies are conducted under conditions of uniaxial tension and transverse force.
The fundamental aspects of the FBM model are discussed in works [27,29]. In the FBM model, CM is represented as a discrete set of elements or fibers that fail sequentially in a brittle manner upon reaching their strength limit. The load at which failure occurs is a random variable with a certain probability density. When a single element fails, the load is redistributed either uniformly across all remaining elements, or to neighboring elements. Typically, analysis includes studying the distribution of failure avalanches (by size) and, accordingly, the distribution of AE energy (A), with an analysis of the time approaching complete failure [30–32].
Studies on the failure process of composite materials using the FBM model are conducted under various conditions. In [33], the authors consider the case of random displacement of fibers with identical equilibrium lengths, caused by random spatial configuration rather than by variability in failure thresholds. The analysis of the fiber failure process demonstrates the presence of two distinct power-law distributions of avalanche size.
In [34], the FBM model with fibers oriented randomly is considered, introducing the amplitude of interaction between the fibers and the CM matrix. A single parameter quantitatively defining all interactions between fibers and the matrix is analyzed. The study examines changes in the density of undamaged fibers depending on the applied forces; the amplitude of interactions between fibers and the matrix; and the system’s size.
It is shown that the failure process exhibits two sequential periods separated by a delay duration, leading to increased fiber elongation time.
In [35], a multi-scale model of a fiber bundle, represented as a hierarchical tree, is investigated. During fiber failure, the load is transferred from upper to lower elements within the hierarchy, with uniform redistribution across all hierarchical levels. The study explores the rate of failure development in CM across different hierarchy levels, showing that increasing the number of hierarchical levels reduces material strength. The analysis of the failure process in CM with the introduction of elastic-plastic behavior of fibers into the FBM model is presented in [36]. This work examines changes in the distribution of failure avalanches and demonstrates that variations in the exponent of the avalanche size distribution indicate a transition from brittle to plastic failure in CM.
In [37],a model of nano-column arrays, with random failure thresholds based on the FBM model, is explored.
The study analyzes the impact of coordination number and the number of hierarchical levels on system strength, the size of catastrophic avalanches, and the probability of failure. It is shown that the average critical load decreases as the system size increases, and the probability of failure follows a normal distribution.
In [38], the FBM model is used as a basis for studying seismic activity development before catastrophic failure in heterogeneous materials, with the goal of preventing destruction. The study reveals that the pattern of load redistribution affects the macroscopic type of failure, from plastic failure without stress concentration (global load distribution) to brittle failure with localized load distribution; it also shows changes in the avalanche size distribution law. The study determines that avalanches and the associated emitted elastic energy are not strictly equivalent, particularly in cases characterized by localized load distribution and brittle failure. Moreover, the increase in the number of avalanches is more pronounced and occurs earlier than the increase in global emitted elastic energy prior to the complete failure of the fiber bundle.
Studies on the failure process of composite materials using the FBM model under transverse force are conducted in [29,39], and relationships describing the changes in equivalent stresses using the OR criterion and the Mises criterion are derived. Expressions for the number of remaining elements during the failure process of CM have been determined, and the study analyzes the patterns of changes in the number of remaining elements, as well as the distribution of failure avalanches. Acoustic emission is also considered, although not in terms of signal formation, but rather in terms ofAE energy release. The time period approaching the complete failure of CM is also analyzed.
In [40,41], the results of studies on the failure process of granular materials under transverse force using the FBM model are presented. The analysis focuses on the rate of energy release during the failure of CM elements. The relationship between stress jumps and AE events during the failure ofCM elements is determined. These studies do not address the signal formation process of AE, but rather analyze the AE energy release process.
Expressions for the number of remaining elements in composite materials under transverse force, based on the FBM model and using the “OR” criteria and the kinetics of failure process development, are discussed in [42]. The study shows that with an increasing loading rate, the rate of failure development also increases. This is accompanied by an increase in the amplitude of the generated AE signal and a decrease in its duration; these correspond to an increase in the rate of the failure process in the CM.
In [43, 44], studies on the failure process of CM under transverse force – using the FBM model, failure kinetics, and the Mises criterion – were conducted.
These studies examined expressions for the number of remaining CM elements, as well as the AE signals generated, during CM element failure. It was shown that as the failure process develops, the number of remaining CM elements decreases continuously over time until complete failure occurs. This is accompanied by the generation of a continuous sequence of AE pulses. It was demonstrated that an increase in the loading rate increases the amplitude and lowers the duration of the AE signal.
The influence of CM properties on the energy parameters of the generated AE signals was also considered. It was shown that as the parameter characterizing CM properties increases, the amplitude, energy, and duration of the AE signal all decrease. In [45], the effect of the changing rate of the CM failure process on the shape of the AE signal was examined, and it was found that increasing or decreasing the rate of failure development leads to the appearance of spikes and a drop in amplitude at the trailing edge of the AE signal.
At the same time, there is interest in understanding how the damaged area of CM affects the change patterns in the parameters of the generated AE signals during CM failure under transverse force according to the Mises criterion.
This study employs a modeling method to analyze the parameters of acoustic emissions (AE) that occur during the failure of composite materials (CM) under transverse loading according to the Mises criterion. The primary objective is to investigate the influence of the number of composite material elements – which determines the damage area – on the amplitude-time characteristics of AE signals.
The modeling is based on the analysis of changes in the equivalent stress in CM elements during their failure. A mathematical model was created to describe the formation ofAE signals as a combination of individual impulses generated during the failure of each composite element. The initial parameters for the simulation include the strain rate, threshold stresses for failure initiation, and the physical properties of the composite material.
The key results of the modeling focus on the relationship between the number of CM elements (damage area) and the AE signal parameters, such as maximum amplitude, signal duration, and the area under the signal curve. Analysis of these relationships provides insights into the sensitivity of AE signals to changes in the structure of composite materials, which is crucial for developing monitoring and diagnostic methods for failure processes.
The studies of acoustic emission under varying loading rates and properties of compositional materials in [43–45] were conducted by modeling AE signals according to the following expressions:
The change in equivalent stress on CM elements over time, according to the Mises criterion [30], is described by the following expression:
The threshold stress corresponding to the time t0 when CM failure begins is described by the following expressions:
The main principles of generating a single disturbance impulse during the failure of a single CM element are discussed in [42]. According to these principles, the maximum possible displacement U0 in expression (1) is directly proportional to the number of elements N0 in the CM, U0 ∼ N0. When modeling the AE signal according to expression (1), we will increase the number of CM elements by factors of 2, 3, and 5, relative to the initial number of elements N0. The modeling will be conducted in relative units.
The following parameter values will be used in relative units. The deformation rate α will be set to
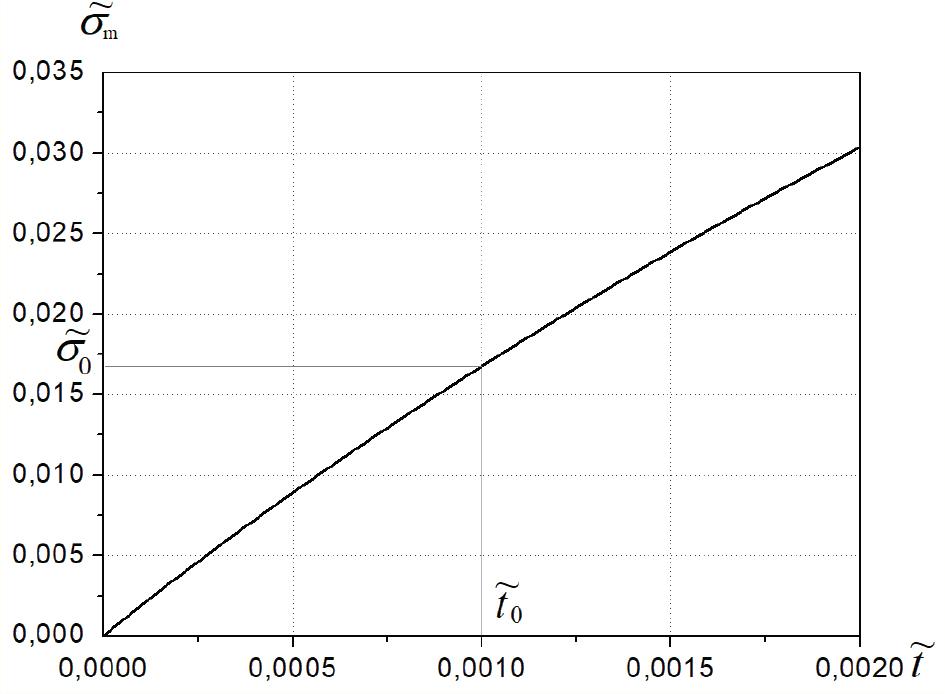
Dependence in the variation of equivalent stress over time, according to expression (1), during the failure of CM based on the Mises criterion. The deformation rate is set to
The dependence exhibits nonlinear behavior. To calculate the initial failure stress or critical stress σ0 = σ(0), the failure time, t0, is set to
The results of the simulation, as a function of AE signal amplitude over time with an increasing number of CM elements, are presented in Figure 2. The results indicate that with an increase in the area ofCM destruction, both the amplitude and the duration of the AE signal increase.
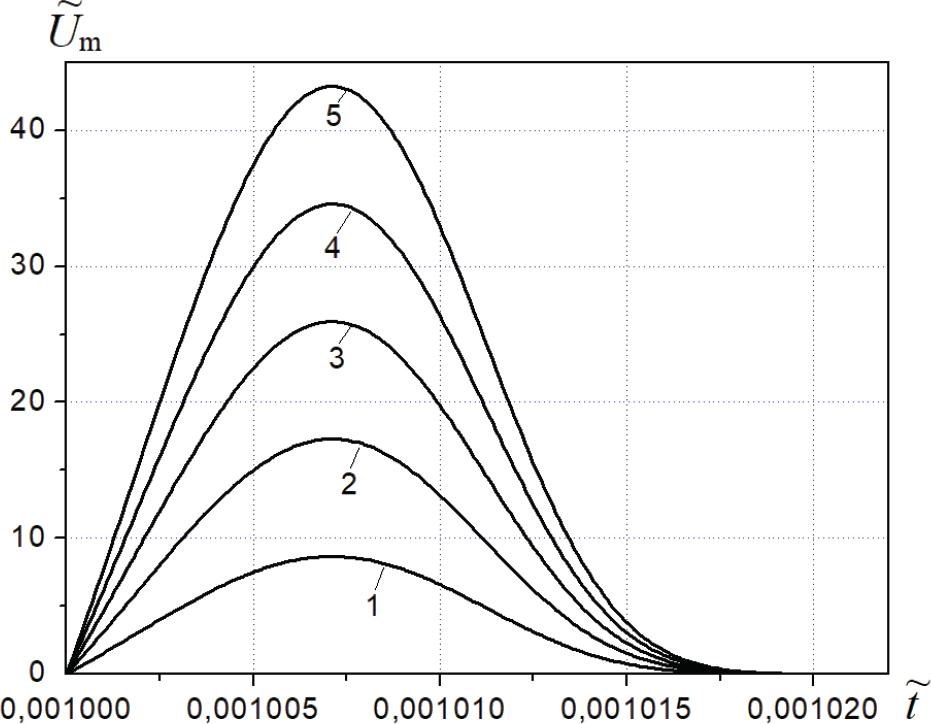
Graphs of the variation in AE signal amplitudes over time in relative units during the failure of CM under transverse force, based on the Mises criterion, with varying numbers of CM elements. Simulation parameter values:
Figure 3 presents an analysis of the maximum amplitude and duration of the AE signal with increasing area of CM destruction. It is evident from Figure 3 that the change in maximum amplitude of the AE signal with increasing CM destruction area follows a linear trend. Change in duration of the AE signal with increasing CM destruction area, on the other hand, shows a nonlinear trend.
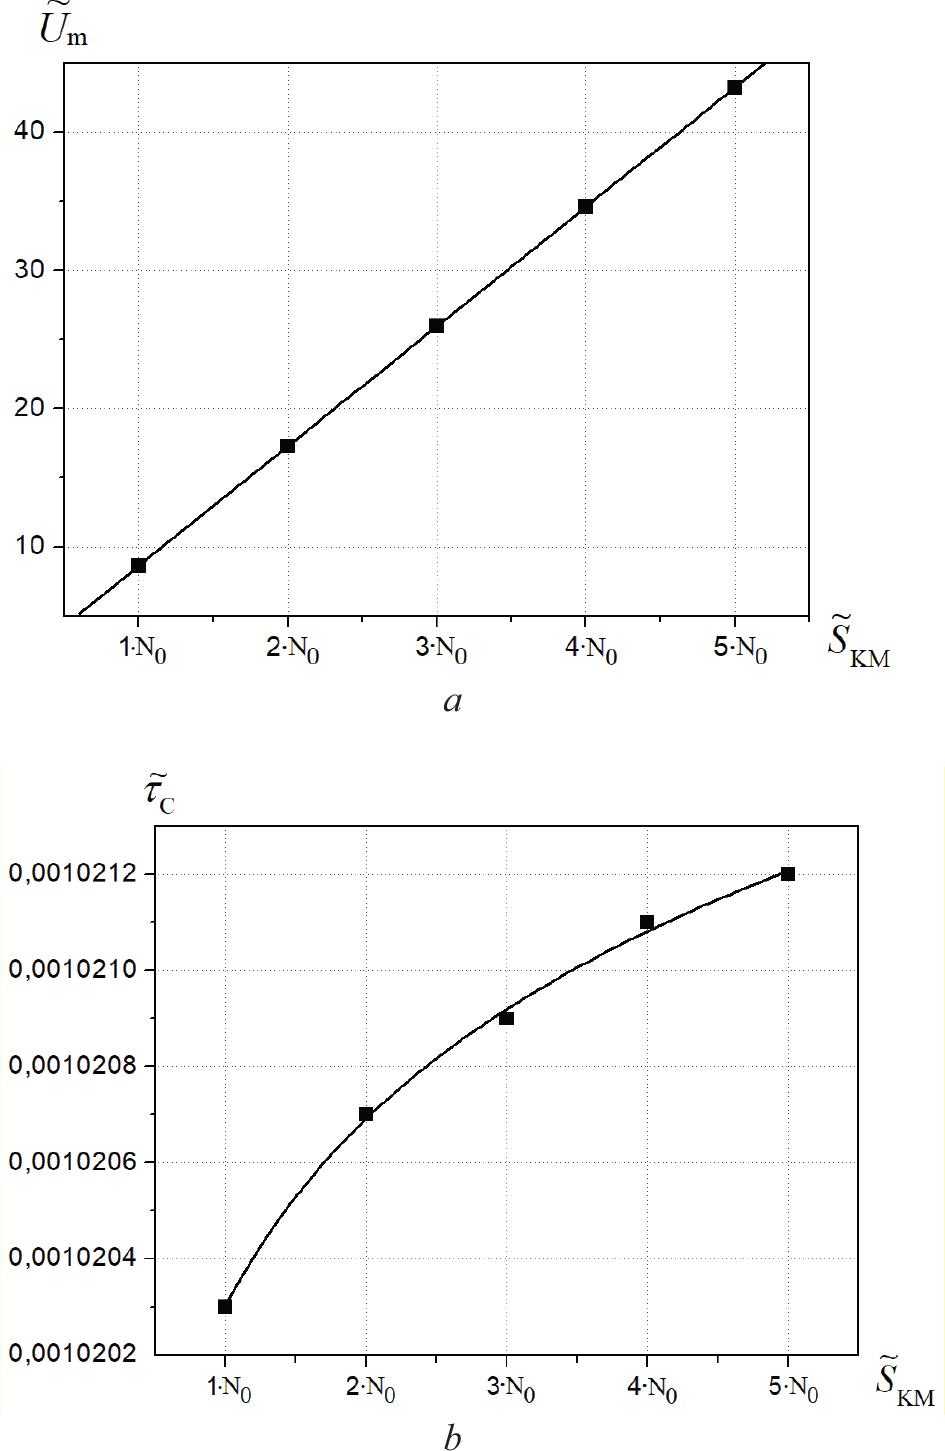
Dependencies of the maximum amplitude of the AE signal (a) and the duration of the AE signal (b) on the increasing damage area (number of elements) in CM under transverse force, based on the Mises criterion
Analysis of the data with approximations for the dependencies shown in Figure 3 reveals the following. The dependency of the maximum amplitude of the AE signal with increasing CM destruction area (Figure 3a) is well described by the following linear function:
For describing the dependency shown in Fig. 3a using expression (4), the correlation coefficient R is 1, and the residual standard deviation is SD = 2.58199.10−5.
The dependence of the duration of the acoustic emission signal on the increase in the destruction area of the composite material (Fig. 3b) is well described by the power function
Expression (5) describes the dependency shown in Fig. 3b; the coefficient of determination is R2 = 0.99834, and the residual variance SD2 = 2.8395.10−16.
We will calculate the area under the AE signal curve in relative units using the expression
The results of the calculations – showing the dependence of the area under the AE signal curve on the increasing damage area (number of elements) in CM under transverse force, based on the Mises criterion – are presented in Figure 4.
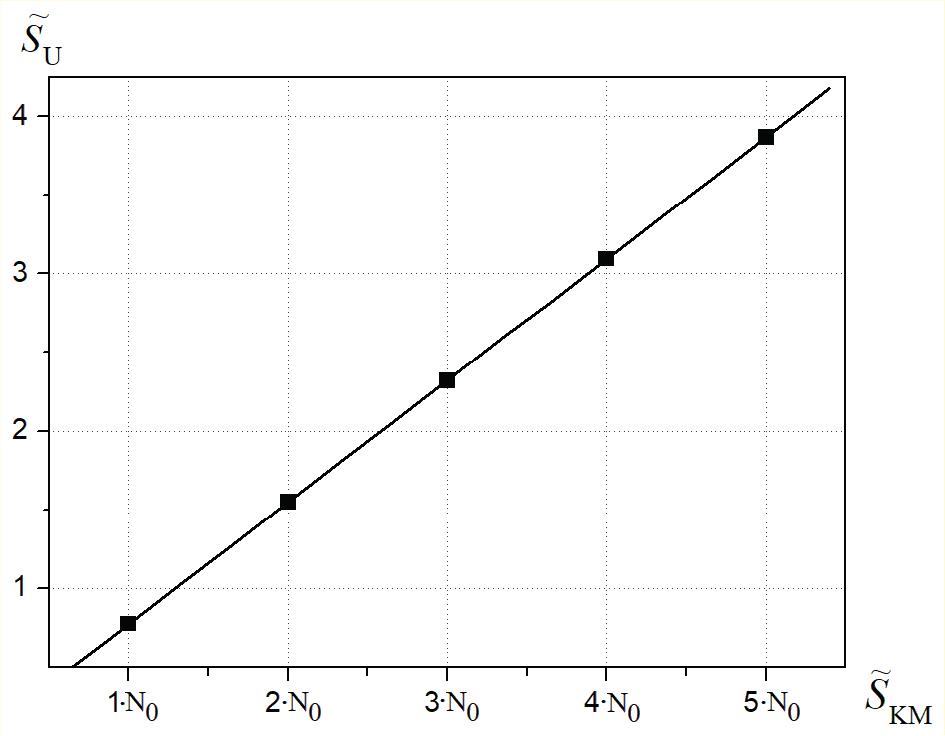
Dependence of the area under the AE signal curve on increasing damage area (number of elements) in CM under transverse force based on the Mises criterion
The dependence of the change in the area under the AE signal curve on the increase in the area of damage to the composite material (Fig. 4) is well described by a linear function of the form
In describing the dependency shown in Figure 4, the correlation coefficient for expression (7) is R = 1, and residual standard deviation SD = 2.45133.10−7.
To determine the sensitivity of the acoustic emission signal parameters to changes in the number of CM elements, we performed calculations of the percentage increase in maximum amplitude, duration, and area under the AE signal curve with the increase in the number of elements of the CM(i.e., the damage area). The results of these calculations are shown in Figure 5, where
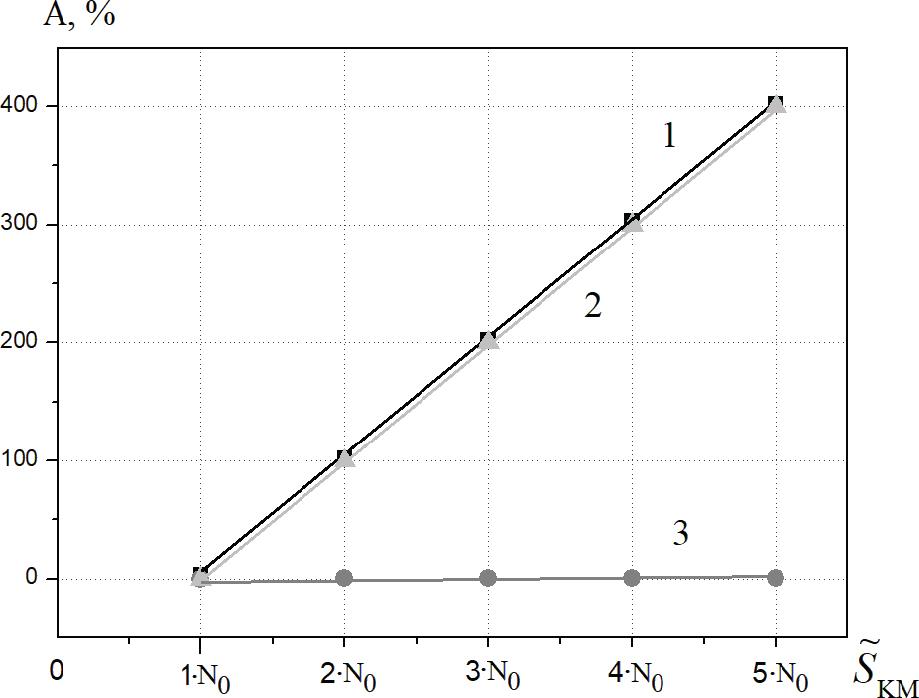
Dependencies of the percentage increase in maximum amplitude (1), area under the signal curve (2), and duration (3) of the AE signal on the increasing number of elements (damage area) in CM
Figure 5 indicates that the percentage increase in maximum amplitude and the area under the AE signal curve are quite similar, whereas the percentage increases in the duration of the AE signal changes only slightly.
Research on acoustic emission during the deformation and failure of compositional materials is aimed at identifying patterns and criteria for monitoring and assessing the condition of CM [10–12]. However, the high sensitivity of the method to processes occurring within the material structure – including the CM itself – combined with the large volumes of information generated and the influence of various factors leads to challenges in interpreting and ensuring the reliability of AE data [46].
In previous studies [42–44], the influence of various factors on the parameters of AE signals during the deformation and failure of CM was investigated based on OR and Mises criteria, and for both [42,43], it was demonstrated that an increase in the deformation rate of CM leads to an increase in the maximum amplitude of AE signals, as well as a decrease in their duration.
The relationship between the change in amplitude and the AE signals shows a linear increase, while the change in signal duration exhibits a nonlinear decrease [43]. The data also indicate that the increase in the maximum amplitude ofAE signals precedes the decrease in signal duration. It was further shown in [44] that as the parameters characterizing CM properties increase, there is a decrease in maximum amplitude, maximum energy, and total acoustic emission energy. These parameters exhibit a nonlinear decrease. Notably, a reduction in total AE energy precedes the decrease in maximum amplitude and maximum energy of AE signals.
One of the factors affecting the parameters of AE signals, according to expression (1), is the number of CM elements or damage area of CM. According to [42], this is directly proportional to the maximum possible displacement upon the instantaneous failure of all CM elements. This study investigates how the number of CM elements affects the amplitude-time parameters of AE signals and evaluates their sensitivity to this factor.
The results of simulating AE signals generated during the failure of CM under transverse force, based on the Mises criterion, indicate that an increase in the number of CM elements (damage area) results in a higher maximum signal amplitude and an increase in its duration (see Figure 2). While the relationship between the maximum amplitude of the signal and the number of CM elements shows a linear increase, the relationship between the duration of the AE signal and the number of CM elements exhibits a nonlinear increase (see Figure 3).
Statistical analysis of the simulation results, with data approximation, shows that the dependence of maximum signal amplitude on the number of CM elements (Figure 3a) is well described by a linear function, while the dependence of AE signal duration on the number of CM elements (Figure 3b) is welldescribed by a power function. The approximating expressions were selected based on their minimization of residual standard deviation and residual standard variance.
Calculations of the area under the AE signal curve, according to expression (5), show that the dependence of the area under the AE signal curve on the number of CM elements exhibits a linear increase (see Figure 4). This dependence is well described by a linear function. The approximating expression for describing the change in the area under the AE signal curve with the increase in the number of CM elements was selected based on its minimization of residual standard deviation.
To compare the sensitivity ofAE signal amplitudetime parameters to changes in the number of CM elements, the increase in maximum amplitude, area under the signal curve, and signal duration were analyzed relative to their values at the initial number of CM elements, N0.
The results of the calculations (Figure 5) show that, with an increase in the number of CM elements, the increases in maximum amplitude and the area under the AE signal curve outpace the increase in signal duration. Additionally, the increases in maximum amplitude and the area under the AE signal curve are nearly identical.
Data analysis reveals that when the number of CM elements is doubled, the maximum amplitude of the AE signal and the area under the AE signal curve increase by 100% and 99.9%, respectively, while the signal duration increases by only 0.039%. When the number of CM elements is quadrupled, the maximum amplitude and area under the AE signal curve increase by 300% and 299.9%, respectively, with the signal duration increasing by 0.079%. When the number of CM elements is increased fivefold, the maximum amplitude and area under the AE signal curve increase by 399.9% and 399.9%, respectively, while the signal duration rises by 0.088%. Such changes in AE signal parameters with the onset of initial damage are likely attributed to the kinetics (self-acceleration) of the damage process.
The results of the conducted research show that under the given modeling conditions, the maximum amplitude and the area under the AE signal curve are the most sensitive parameters to changes in the number of composite material elements. These parameters significantly precede the increase in the duration of AE signals. The identified patterns of change in the maximum amplitude and the area under the AE signal curve as they relate to the varying numbers of CM elements may be useful for developing methods for monitoring, diagnosing, and predicting the failure of CM based on AE signal registration.
At the same time, it is known that the most informative parameter of AE signals is their energy. Analyzing the impact on the energy parameters ofAE signals of the number of composite material elements during their failure under transverse force according to the Mises criterion – as well as identifying the patterns of their changes – will help determine their sensitivity and improve the reliability of the methods for monitoring, diagnosing, and predicting CM failure based on AE signal registration that have been developed.
This study investigated the influence of the number of composite material (CM) elements – representing the area of damage – on the amplitude-time parameters of acoustic emission (AE) signals during CM failure under transverse force, based on the Mises criterion. The results demonstrated that as the number of CM elements increases, there is a proportional rise in the maximum amplitude, the area under the AE signal curve, and the signal duration. The relationship between the number of CM elements and the maximum amplitude, as well as the area under the signal curve, followed a linear trend, while the change in signal duration exhibited a nonlinear growth pattern.
Sensitivity analysis revealed that the increase in maximum amplitude and signal area preceded the increase in signal duration, with significant differences observed as the number of CM elements increased. Specifically, when the number of CM elements doubled, the maximum amplitude of the AE signal and the area under the signal curve increased by 100% and 99.9%, respectively, while the duration of the AE signal increased by 0.039%. When the number of CM elements increased fivefold, the maximum amplitude and the area under the AE signal curve increased by 399.9% and 399.9%, respectively, and the duration of the AE signal increased by 0.088%. The results of the study indicate that the most sensitive amplitude-time parameters of AE to changes in the number of CM elements (the area of destruction) are the maximum amplitude of the AE signal and the area under the AE signal curve.
While the findings provide valuable insights into the behavior of AE signals during CM failure, this study is limited by the specific simulation conditions and assumptions used in the modeling process. The focus was primarily on amplitude-time parameters. Thus, further research is needed to explore how other AE characteristics – particularly energy parameters – are influenced by changes in the number of CM elements under transverse force according to the Mises criterion in order to determine the patterns of their changes and their sensitivity to influencing factors.