
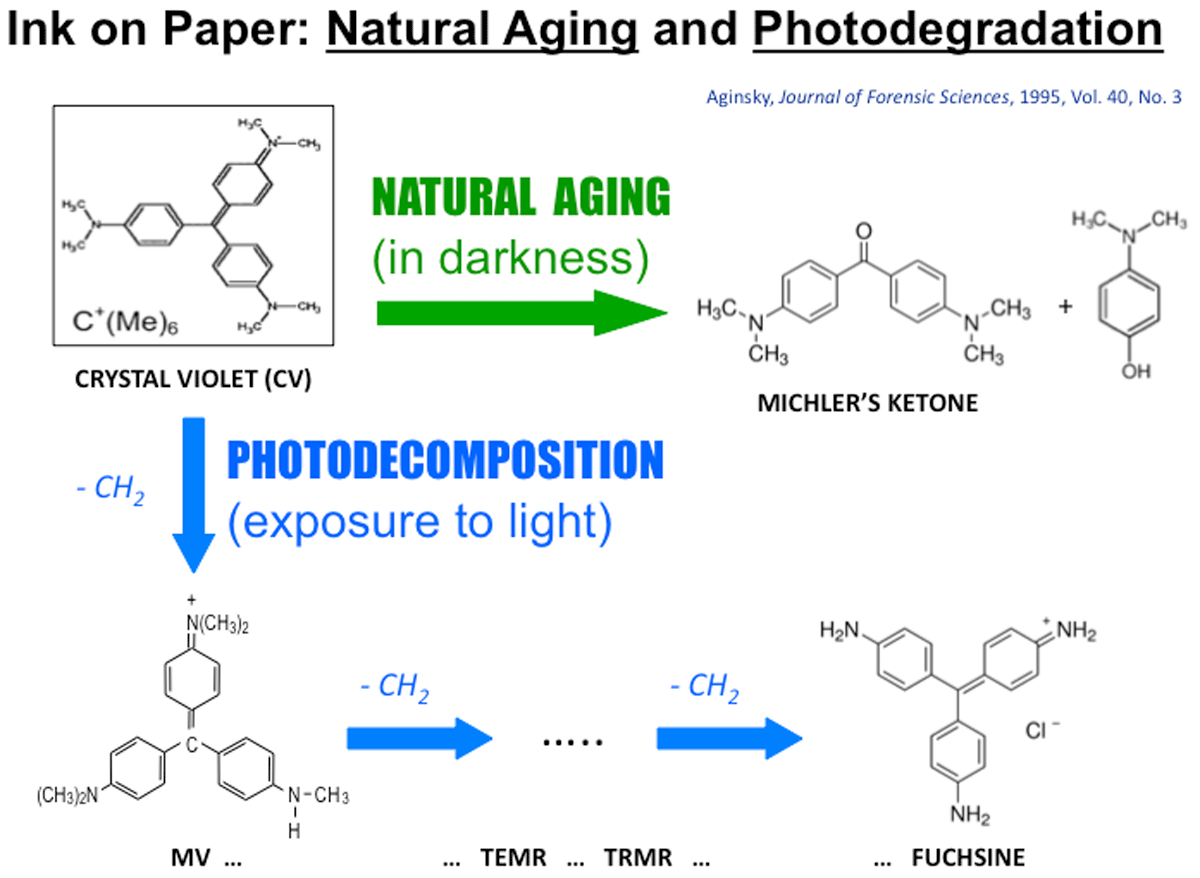
Figure 1
Two different mechanisms of the degradation of the dye CV (crystal violet) in inks on documents (2, 3, 4, 5, 47): (1) Natural Aging (when the document is kept in darkness) – the discoloration of CV due to the breakdown (oxidative cleavage in the presence of atmospheric oxygen) of CV into two compounds, Michler’s ketone and N,N-dimethyl-4-aminophenol;8 (2) Photodecomposition (when the document is exposed to light) – the decomposition of CV with the formation of up to six N-demethylation products – from Methyl Violet to fuchsine.
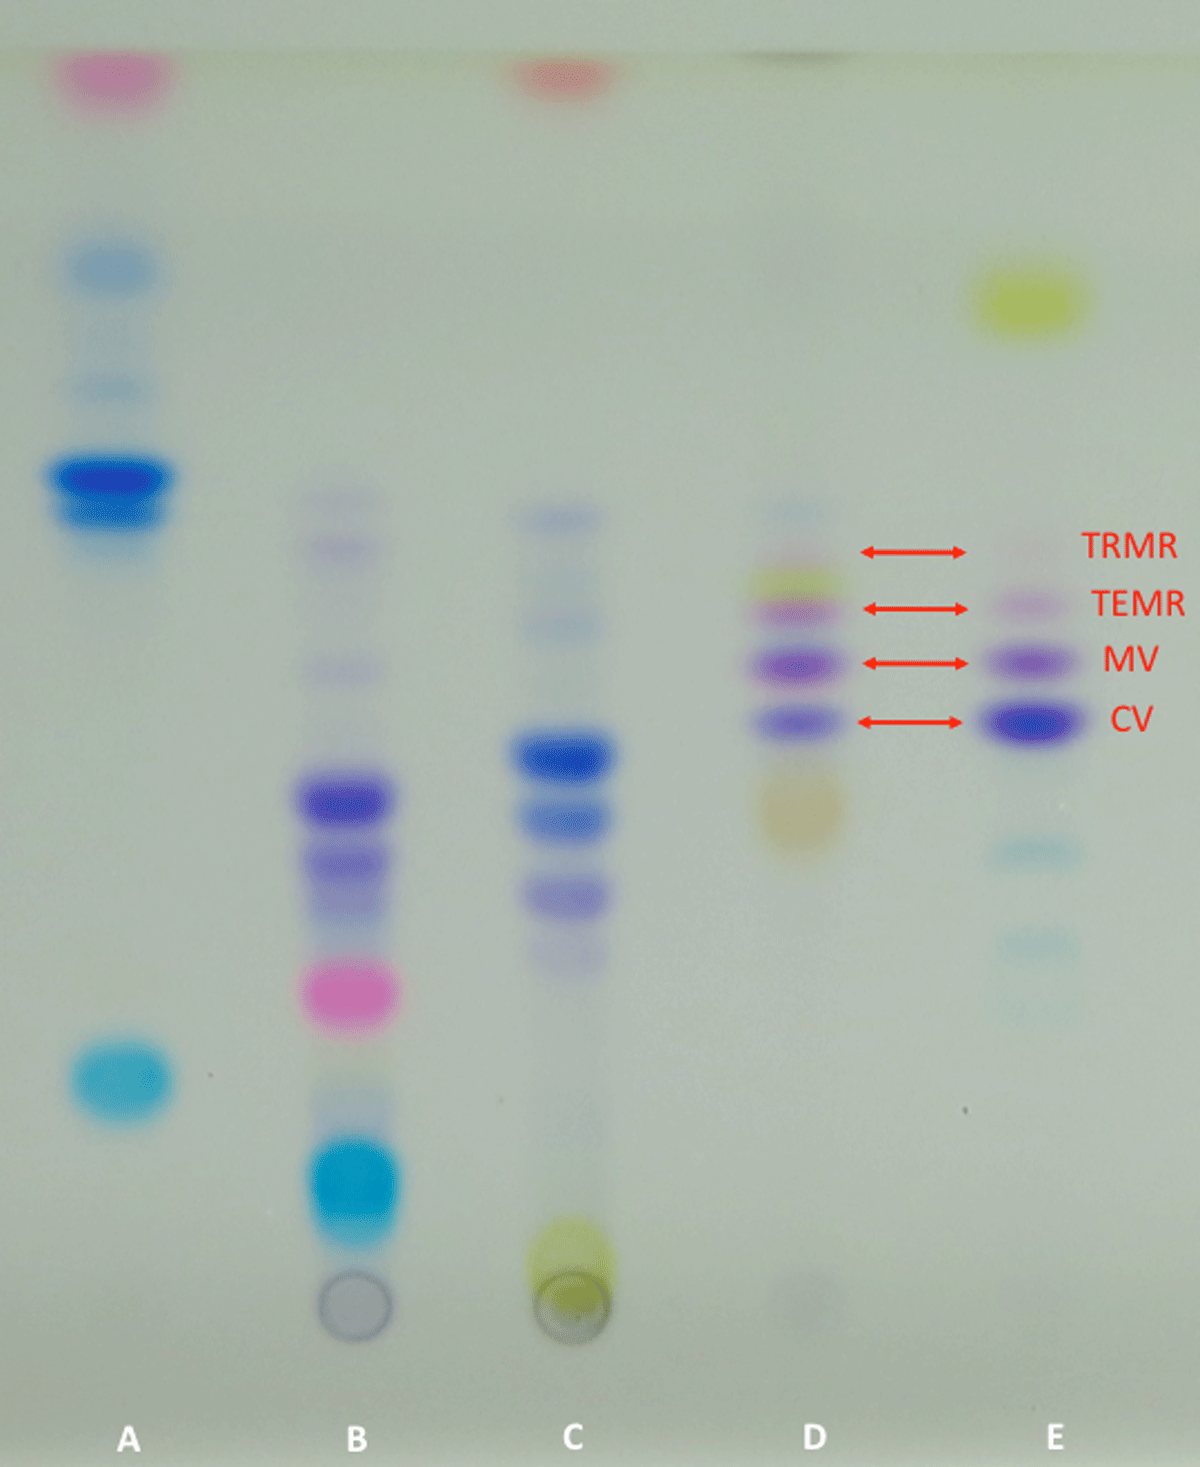
Figure 2
Five thin-layer chromatograms obtained for Inks A through E using the developing solvent ethyl acetate–isopropanol–water–acetic acid = 30:15:10:1 (photographed under daylight). The right two lanes are the chromatograms obtained for ink samples taken from the 12- and 18-year old entries written with Ink D (OfficeMax® black ballpoint ink) and Ink E (Bic® Soft Feel Jumbo black ballpoint ink, respectively).10 Both Ink D and Ink E contain the above four violet homologues (upwards: CV, MV, TEMR, and TRMR).11
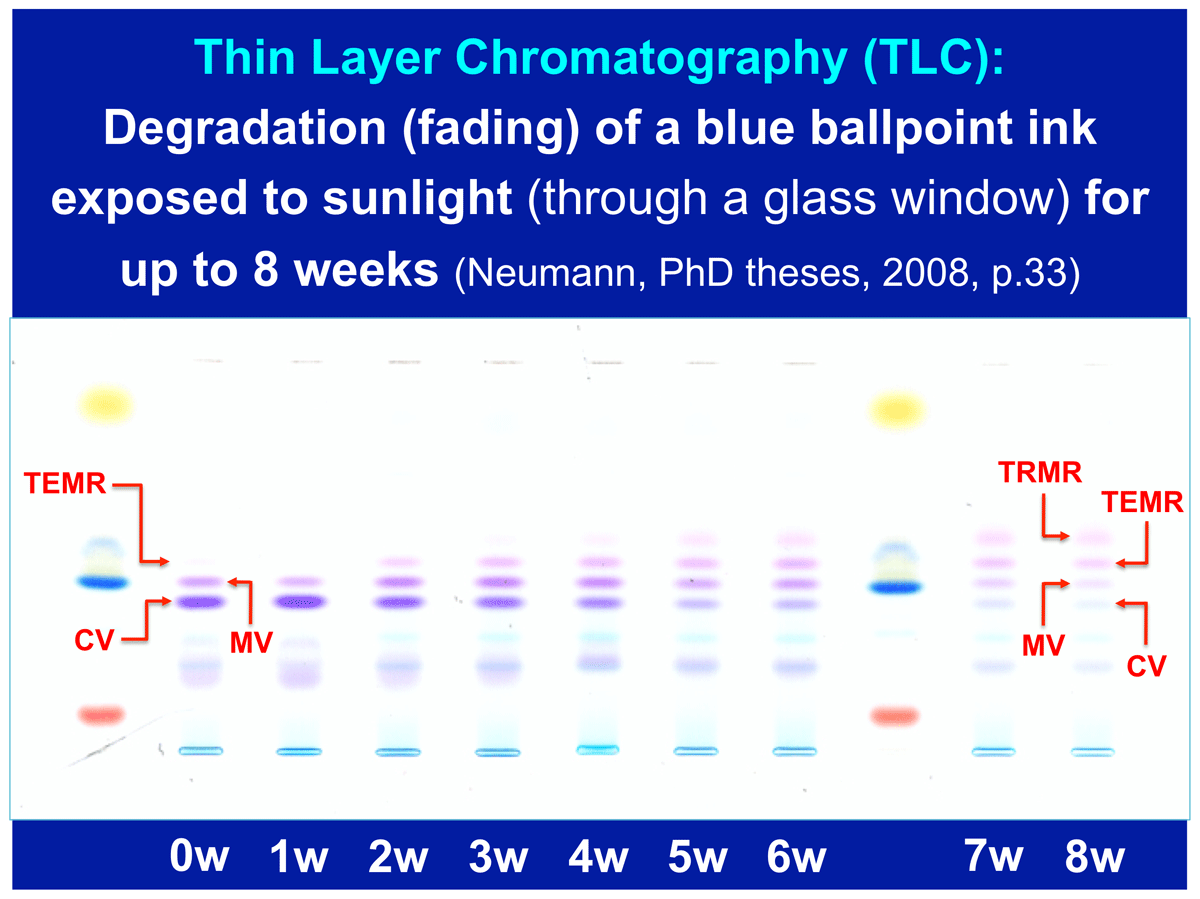
Figure 3
TLC analysis of ink samples taken from the same blue ballpoint ink on paper that had been exposed to sunlight through the window for up to 8 weeks [see ref. (12)].
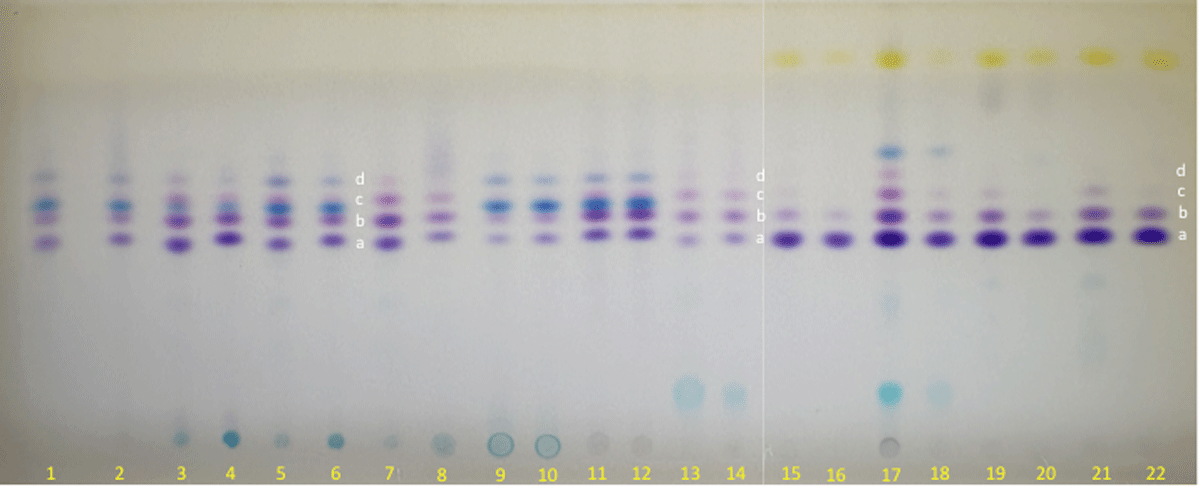
Figure 4
The TLC separation of the dye components of 11 pairs of blue and black ballpoint inks on paper of various compositions and ages (each pair includes ‘old’ and ‘fresh’ entries written with the same pen; see Table 1). The developing solvent was ethyl acetate–isopropanol–water–acetic acid = 30:15:10:1 (photographed under daylight). The ink’s four violet triarylmethane components separated by the TLC are as follows: (a) CV, (b) MV, (c) TEMR, and (d) TRMR.
Table 1
Blue and black ballpoint inks examined by TLC (see lanes 1–22 in Figure 4).
| LANE # | DESCRIPTION (PERTINENT INFORMATION ON CARTRIDGE, BARREL OF THE PEN, ETC.) | AGE OF INK ON PAPER |
|---|---|---|
| 1 | BIC blue ink (N-E-32) | 31 years |
| 2 | The same pen as in item 1 (see column ‘Lane #’) | 1 day |
| 3 | STAEDTLER blue ink (Stick 430 M DIN 16554 J1) | 31 years |
| 4 | The same pen as in item 3 | 1 day |
| 5 | SCHWAN-STABILINER blue ink (808 Medium Malaysia) | 31 years |
| 6 | The same pen as in item 5 | 1 day |
| 7 | GARANTIE-MINE blue ink (DIN 165544 ‘Senator’ West Germany) | 34 years |
| 8 | The same pen as in item 7 | 1 day |
| 9 | AT CROSS blue ink (refill, Fine, 09 00, USA) | 24 years |
| 10 | The same pen as in item 9 | 1 day |
| 11 | Blue ink (‘ROMANIA’ Italy) | 18 years |
| 12 | The same pen as in item 11 | 1 day |
| 13 | FORMULABS black ink (‘Black 923 cc, Lot 1192 3/79’) | 31 years |
| 14 | The same pen as in item 13 | 1 day |
| 15 | AT CROSS black ink (refill, 1 A36 Fine 711 Ireland) | 19 years |
| 16 | The same pen as in item 15 | 1 day |
| 17 | FISHER black ink (refill, pressurized, made in USA) | 17 years |
| 18 | The same pen as in item 17 | 1 day |
| 19 | TOMBOW black ink (refill, Fine, Japan 07.02) | 17 years |
| 20 | The same pen as in item 19 | 1 day |
| 21 | BIC black ink (four-color pen, Med. Pt., made in France) | 17 years |
| 22 | The same pen as in item 21 | 1 day |
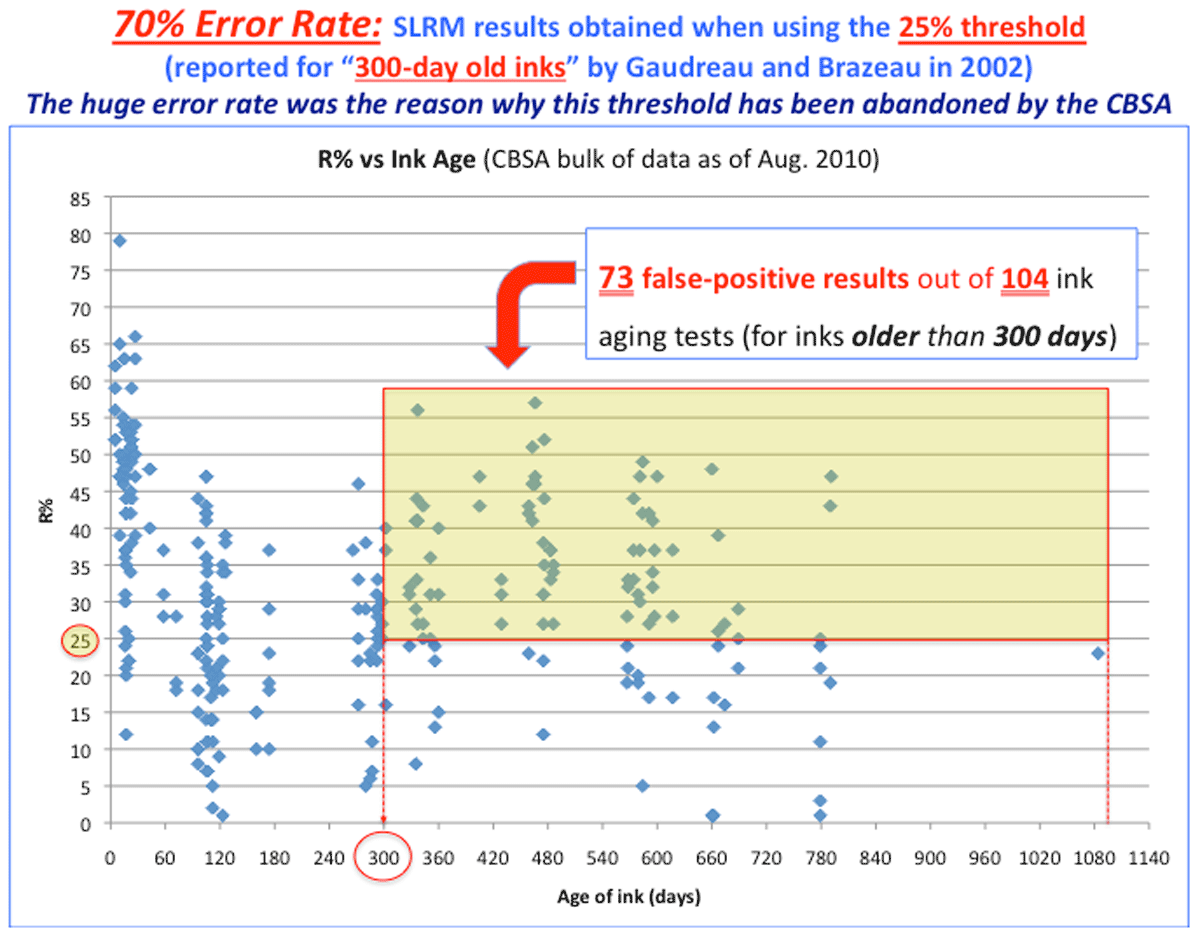
Figure 5
When using the R = 25% ‘threshold,’ the SLRM showed the error rate of 70% (73 false–positive results out of 104) for the inks older than 300 days, the error rate of 41% (9 false–positive results out of 22) for the inks older than 22 months, and the error rate of 30% (3 false–positive results out of 10) for the inks older than 2 years.
Table 2
Peer-reviewed articles and published (in conference proceedings) papers that report experimental data obtained and discuss the scope of applicability of the ink aging methods which measure the gradual disappearance (‘solvent loss’) of the solvent 2-PE from ballpoint ink on paper (listed in chronological succession).
| YEAR | AUTHOR(S) (REFERENCE) | METHOD | THE SCOPE (LIMIT, RANGE) OF APPLICABILITY OF THE METHOD CONFIRMED BY PUBLISHED EXPERIMENTAL (NUMERICAL) DATA |
|---|---|---|---|
| 1993 | Aginsky (57) | Solvent loss with time (natural aging) | <2 months |
| 1996 | Aginsky (20) | SLRM | 3 months |
| 2002 | Gaudreau and Brazeau (23) | SLRM | 10 months* |
| 2005 | Wang et al. (66) | Solvent loss with time | 3 months |
| 2006 | Bügler et al. (34) | Thermal desorption and GC-MS (mass independent SLRM) | 3–4 months |
| 2007 | Brazeau and Gaudreau (67) | Solvent loss with time | < 6 months |
| 2007 | Weyermann et al. (68) | Solvent loss with time | ca. 2 weeks (the aging of blue Parker ballpoint ink was studied) |
| 2008 | Bügler et al. (36) | Mass independent SLRM: TD-GC/MS20 | Several months (300 different ballpoint inks were tested) |
| 2010 | Ezcurra et al. (69) | Solvent loss with time | <2 months (the aging of blue Bic ballpoint inks was studied) |
| 2011 | Weyermann et al. (53) | Outside proficiency testing using ‘blind’ ink samples are necessary to test the validity of current ink aging methods | This article reviews the state of the art in the area of ink aging analysis and stresses as follows:
|
| 2012 | Kirsch et al. (70) | Solvent loss with time | <3.5 months (161 different ballpoint inks were tested) |
| 2012 | Bügler (37) | Mass independent SLRM: TD-GC/MS | ca. 4 months (80 different ballpoint inks were tested) |
| 2012 | Koenig and Weyermann (71) | SLRM | <2 months (the study of the aging of fast, medium and slow aging inks) |
| 2014 | Aginsky (25) | SLRM | <3 months22 (14 different ballpoint inks were tested: Bic, Zebra, Pilot, Pentel, Avery, Lamy, Parker, etc.) |
| 2015 | Koenig et al. (72) | SLRM23 | <100 days (the study of the aging of fast, medium and slow aging inks) |
| 2018 | Koenig and Weyermann (32) | SLRM and TD-GC/MS | ‘few months’ 25 blue and black ballpoint inks24 of different brands (Bic, Papermate, Pilot, National Ink, Dokumental, Sanford, Formulabs, Waterman, Staedler, Lamy, Pelikan, Pentel, etc.) that represent fast, medium, and slow aging inks. |
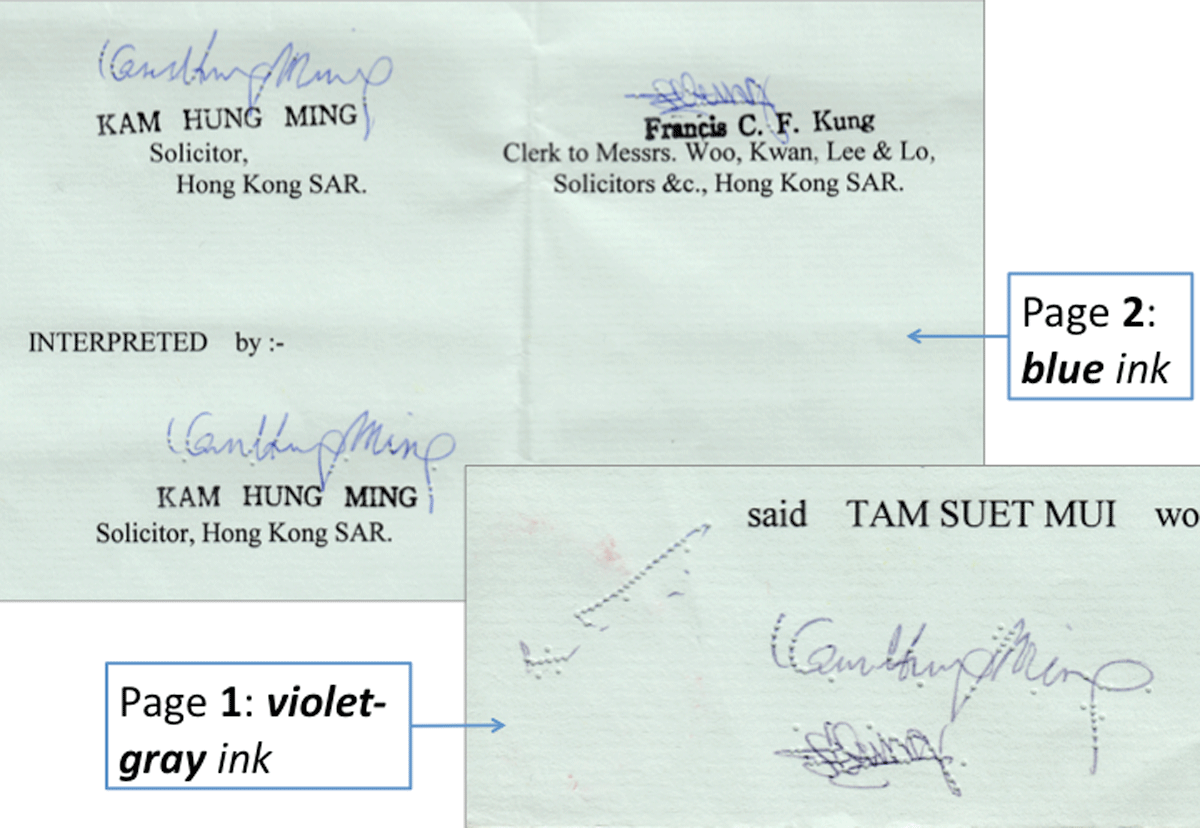
Figure 6
Fragments of pages 1 and 2 of the 1999 Will (numerous hole punches in the lines of the signatures indicate that the inks of the signatures have been subjected to a chemical analysis).
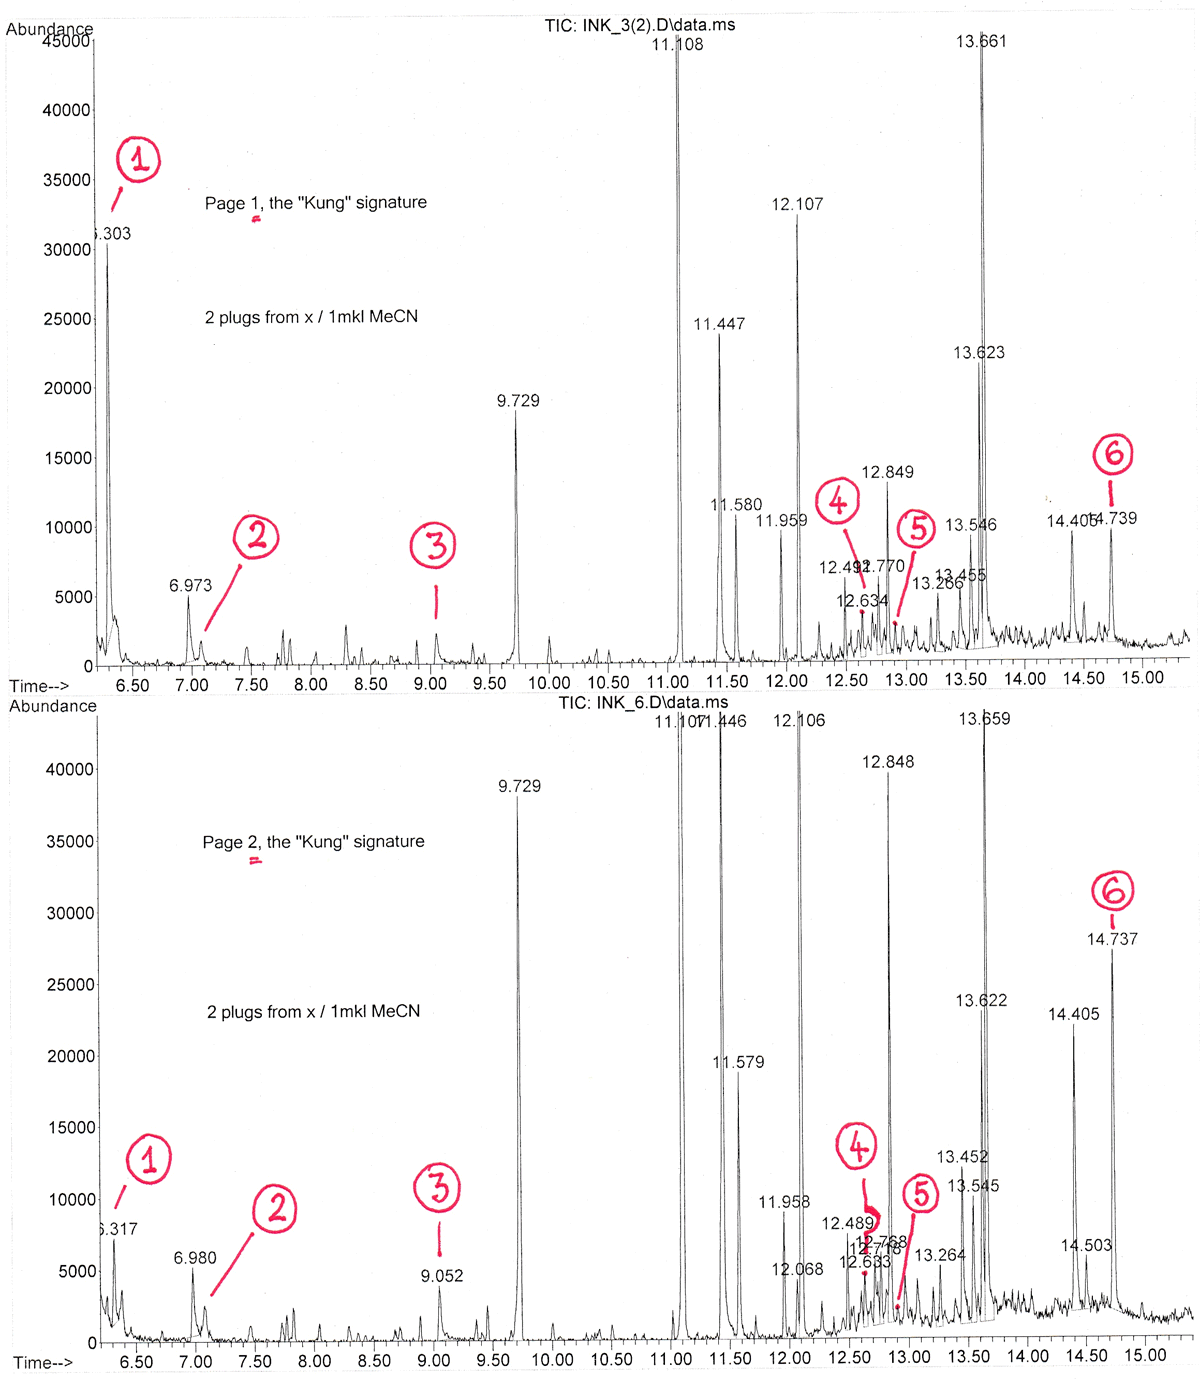
Figure 7
Comparison of the GC-MS chromatograms of ink samples taken from the signatures written in the name of ‘Kung’ on pages 1 (upper chromatogram) and 2 (lower chromatogram) of the 1999 Will. The six components of the ink, indicated by the red lines and circled numbers, are as follows: #1 – benzaldehyde; #2 – benzyl alcohol; #3 – phenoxyethanol; #4 – an unidentified micro component of the ink (five largest peaks in the component’s mass spectrum, m/z: 195 [base peak], 210, 180, 165, and 179); #5 – an unidentified micro component of the ink (five largest peaks in the component’s mass spectrum, m/z: 119 [base peak], 196, 105, 77, and 91); #6 – 1-(phenylmethoxy)-naphthalene.
Note: The other multiple peaks (other than those indicated by the red lines) appearing on the two GC-MS chromatograms are the peaks that represent the components of the paper. This was established as a result of the comparison of the GC-MS chromatograms obtained for the ink-on-paper samples and for the paper blank samples taken from the paper of the 1999 Will.
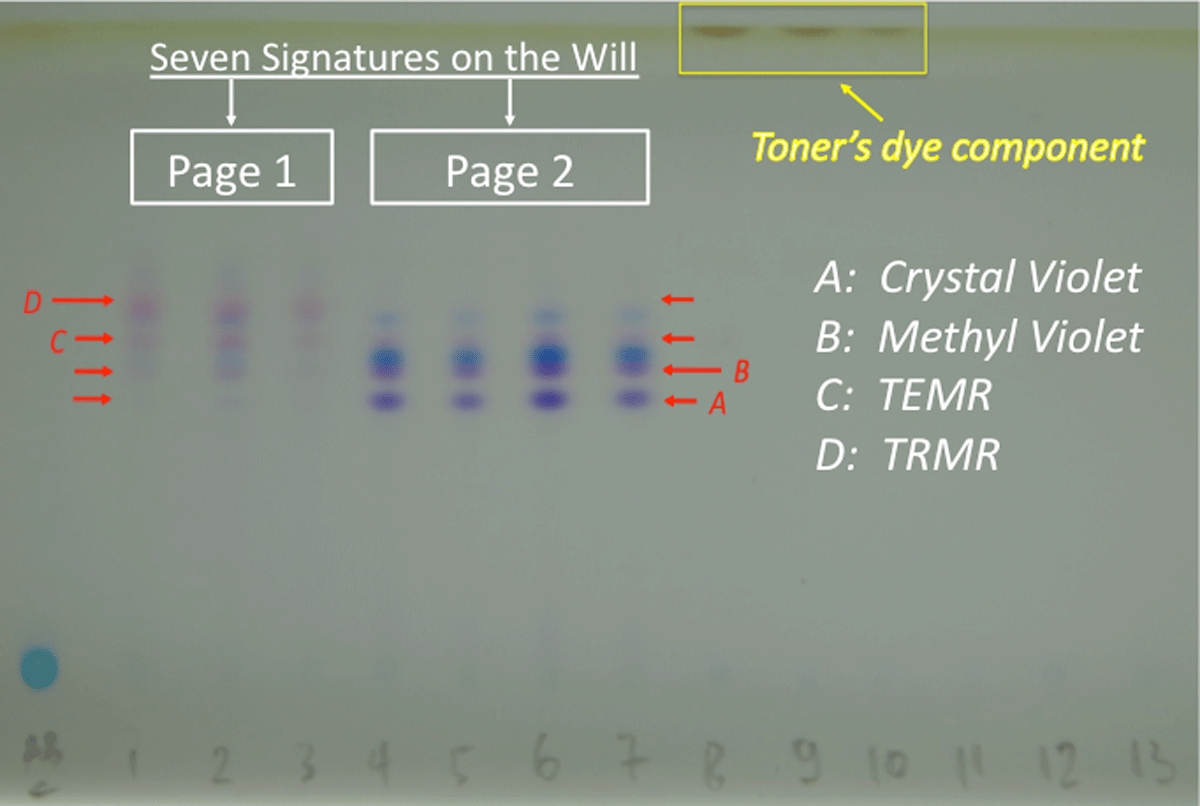
Figure 8
The effect of long-term exposure to light on certain dye components of the blue ballpoint ink on page 1 of the 1999 Will: two violet dye components ‘A’ and ‘B’ and both blue dye components of the ink have significantly decomposed (almost vanished). The thin-layer chromatograms (photographed under daylight) obtained for the following ink, toner, and paper samples taken from pages 1–3 of the 1999 Will: the ink samples taken from each of the three pale violet–gray signatures on page 1 (lanes 1–3); the ink samples taken from each of the four bright blue signatures on page 2 (lanes 4–7); the black toner samples taken from the printed entries on pages 1, 2, and 3 (lanes 8, 9, and 10, respectively); and the green paper blank samples taken from pages 1, 2, and 3 (lanes 11, 12, and 13, respectively).
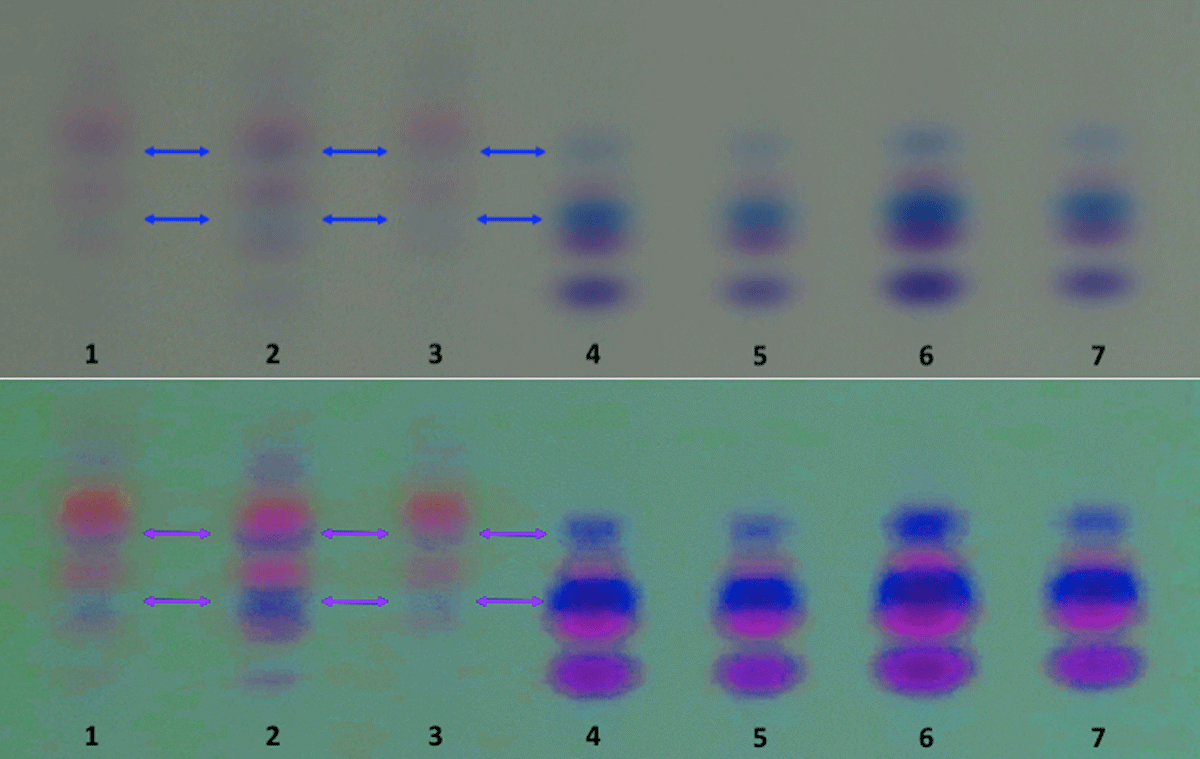
Figure 9
Both blue dye components of the ink on page 1 of the 1999 Will have significantly decomposed (almost vanished) after a long exposure of page 1 to light. Upper Image: a fragment of Figure 8 that shows the results of the TLC separation of the violet and blue dye components of the ink of each of the three signatures located on page 1 (see lanes 1–3) and each of the four signatures located on page 2 of the 1999 Will (see lanes 4–7). Lower Image: the upper image ‘observed’ through a ‘green filter’ that changes the color of the background of the TLC plate (from light-gray to light-green) and the colors of all chromatographic zones of the violet dye components (from dark-violet to bright-violet and from red–violet to bright red–orange) and the blue dye components (from greenish-blue to bright dark-blue). The ‘green filter’ was applied to the upper image using the ‘Adjust Hue/Saturation’ command in Photoshop. Specifically, the following Hue/Saturation parameters were used to obtain the lower image: Hue = +30 and Saturation = +80.
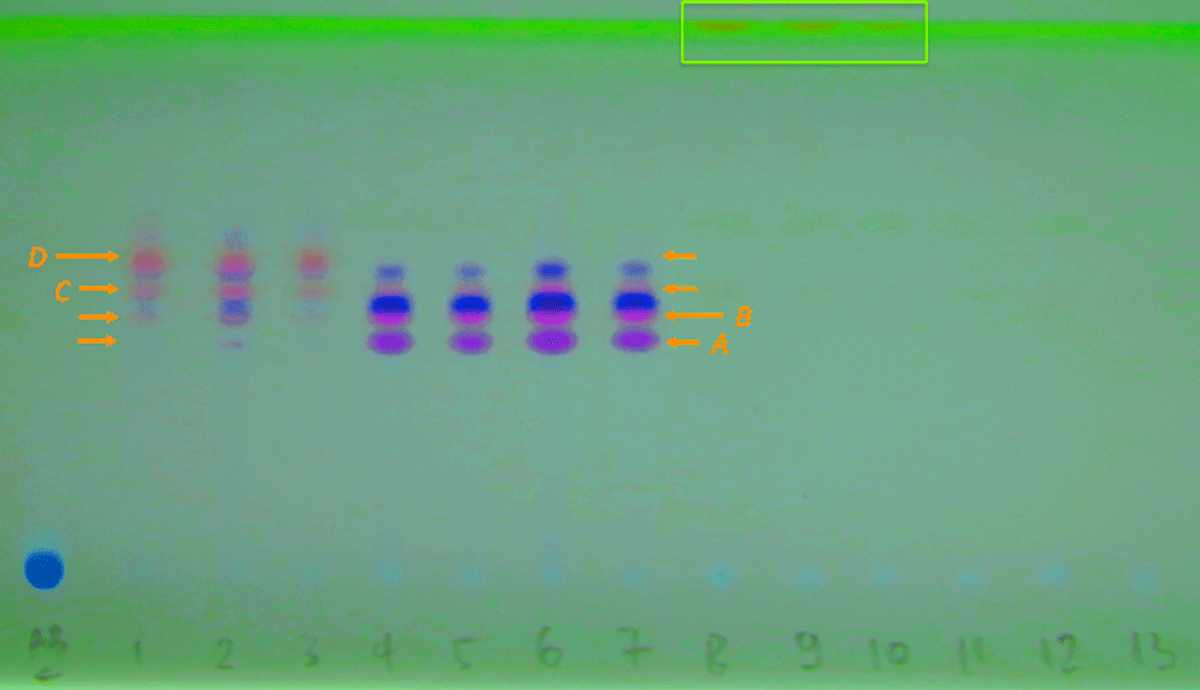
Figure 10
The image shown in Figure 8 modified using the ‘green filter’ (Hue = +30; Saturation = +80) described in Figure 9.
Note: The visual evaluation (‘semi-quantitative’ analysis33) of the resulting TLC chromatograms in Figures 9 and 10 (as well as in Figure 8) shows that the sizes and color intensities of the chromatographic zones (the spots with the same Rf value) of the violet and blue dye components somewhat vary both within lanes 1–3 (three signatures on page 1 of the 1999 Will) and within lanes 4–7 (four signatures on page 2 of the Will). Such variations are logical (typical) and explained by the fact that the ink samples (0.5-mm microplugs of ink on paper taken from each signature for the TLC analysis in this case) varied in the masses of the ink. It is a well-established fact that variations in the masses of ink in samples taken from handwritten entries are caused by at least two factors: (1) different writers (in this case, apparently three different people signed the 1999 Will) typically apply different pen pressures when writing/signing (the larger the pen pressure, the more ink is deposited on paper), and (2) even within one and the same signature, there are always significant variations in thickness and ink line morphology along the signature’s lines.
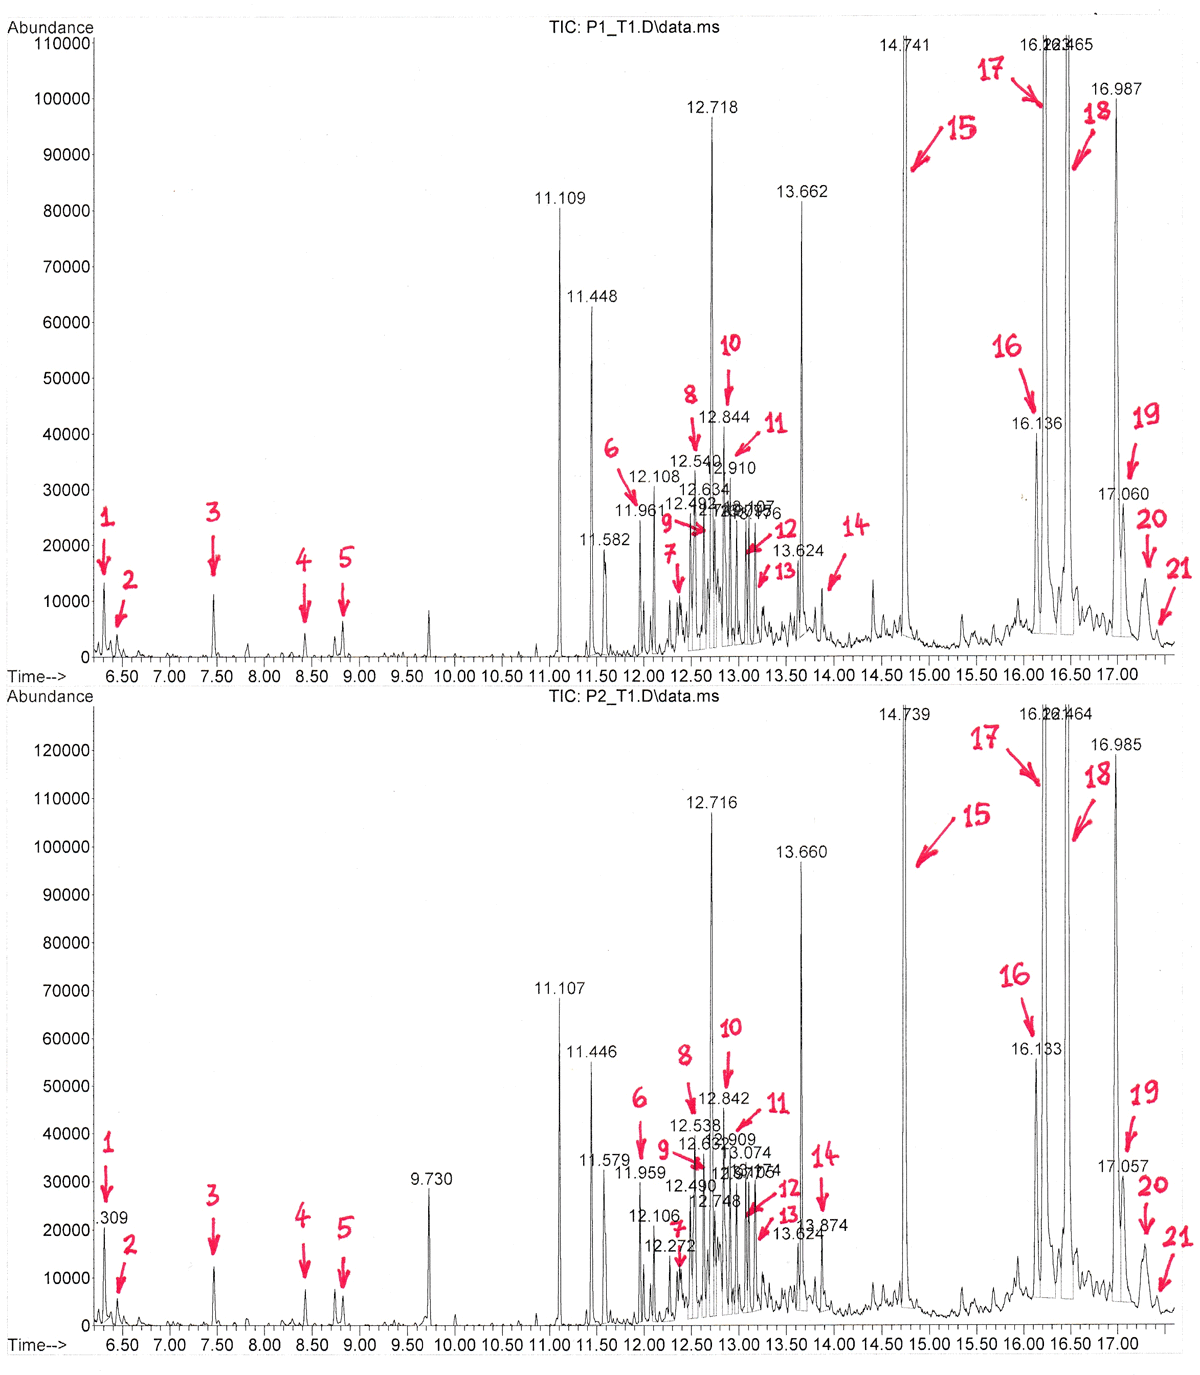
Figure 11
Comparison of the GC-MS chromatograms of toner-on-paper samples taken from entries printed on pages 1 (upper chromatogram) and 2 (lower chromatogram) of the 1999 Will. The 21 components of the toner are indicated by the red arrows. The other multiple peaks (other than those indicated by the red arrows) appearing on the two GC-MS chromatograms are the peaks that represent the components of the paper.