
Introduction
While the objective elements of a handwriting examination can be overlooked when discussing the reliability of handwriting conclusions, it is the subjective side of the process that has long been debated and drawn much criticism. The reliability and validity of this practice has been called into question, and furthermore, whether handwriting examinations and expert opinions derived from such examinations have a scientific basis [1, 2]. The evaluation of the significance of handwriting features has been the target for criticism by lawyers and judges alike mainly due to the lack of empirical data that is generated during the analysis [3]. Research into the development of technologies that provide numerical, objective data is constantly being carried out to assist with alleviating these concerns [4, 5, 6, 7, 8]. In accordance with this current mindset in the forensic handwriting examination community, this paper seeks to convey the exploitation of the data generated by the Write-On™ 2.0 (Write-On™) program.
Write-On™ is a computer program based on user input that collates, dissects and manages the handwriting on all manner of documents. It was designed to assist the forensic document examiner with the comparison of handwriting, especially in the case of large quantities of documents but is equally useful in smaller cases. The program allows users to record and catalogue the transcribed characters in the questioned and specimen documents, search and display the appropriate handwriting features and report their findings in a format suitable for presentation in judicial proceedings. It is noted that Write-On™ is subject to user error in transcription; examiners have a choice of partial or full transcription and it relies on the accurate transcription of upper- and lower-case letters. Write-On™ does not have any automated comparison capabilities as it does not seek to replace the examiner, only aid them during the handwriting examination and reporting. A useful aspect of the program is that it generates a database which contains an index of the words present in the questioned and specimen documents, a count of all the segments (letters and numerals) and a record of the handwriting characteristics that were searched for during the examination. The aim of this paper is to illustrate, with examples, how to exploit this data statistically which can contribute to providing a handwriting examination with an improved scientific basis and outlook that better meets the requirements of the judicial system. It should be noted that this paper is not a guide on how to use Write-On™.
Method
The extraction of raw data from Write-On™ 2.0
As previously mentioned, following manual transcription of the documents, Write-On™ lists the words on the questioned and specimen documents, provides a count of each letter and number (segment) and the searches performed, in a database. In version 2.0, while the data is displayed in the program, it is not readily accessible for evaluating using statistical techniques. In order to obtain this data the Write-On™ executable file (wrn2) needs to be converted to a database file (mdb). This is simply done by creating a copy of the existing wrn2 file and renaming the copy from a wrn2 file extension to a mdb file extension i.e. in our example the wrn2 file, “216xxxWriteon. wrn2” is changed to a mdb file, “216xxxWriteOn.mdb”. This new file can then be opened in Microsoft Access (Figure 1).
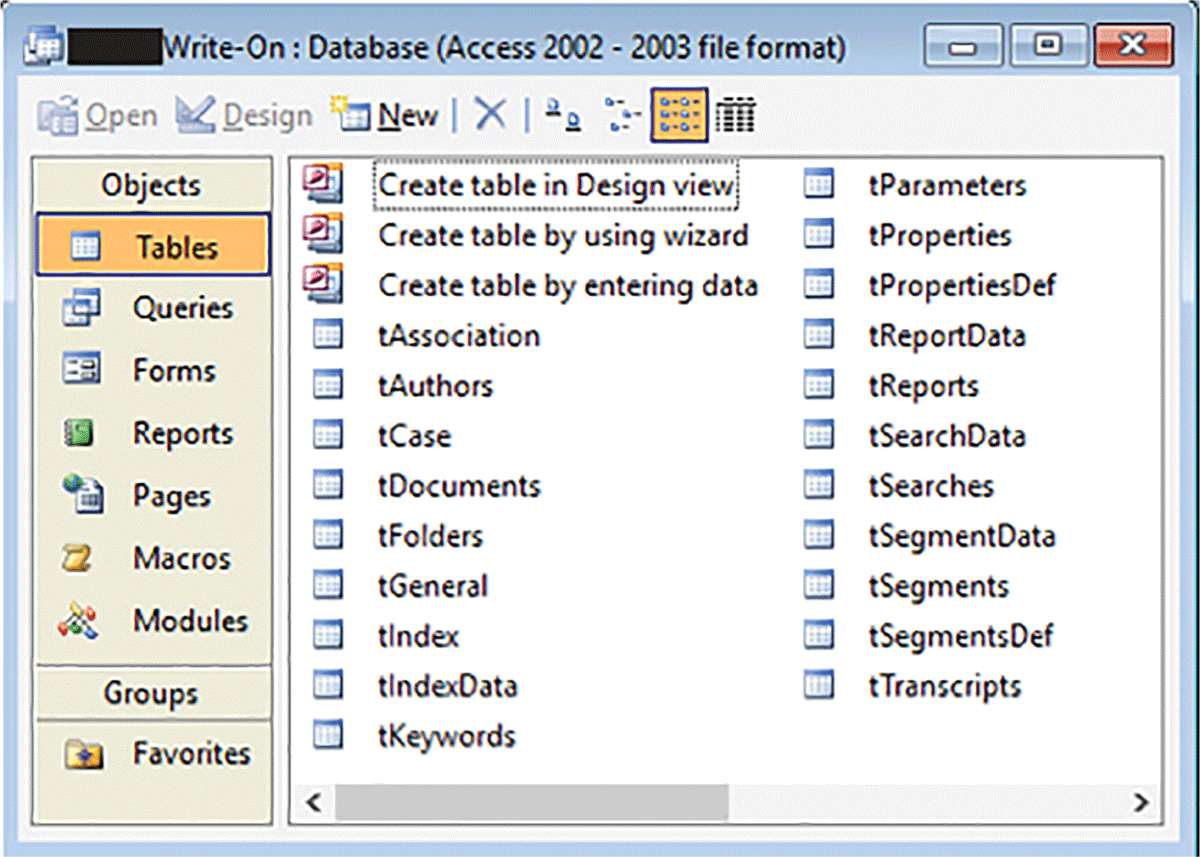
Figure 1
Screenshot of the Tables Index from the database of the converted mdb file.
The mdb database stores information in the form of tables for a number of different functions of the program. The tables of interest in this study are the tIndesx, tSegments and tSearches. The tIndesx table provides a table of all the words that form part of the examination; the tSegments table lists the individual letters and numerals; the tSearches table details searches undertaken. Figure 2 displays part of the tIndex table opened in Microsoft Access. This table can be exported into Excel. The other tables of concern can also be exported to Excel in the same manner for further analysis.
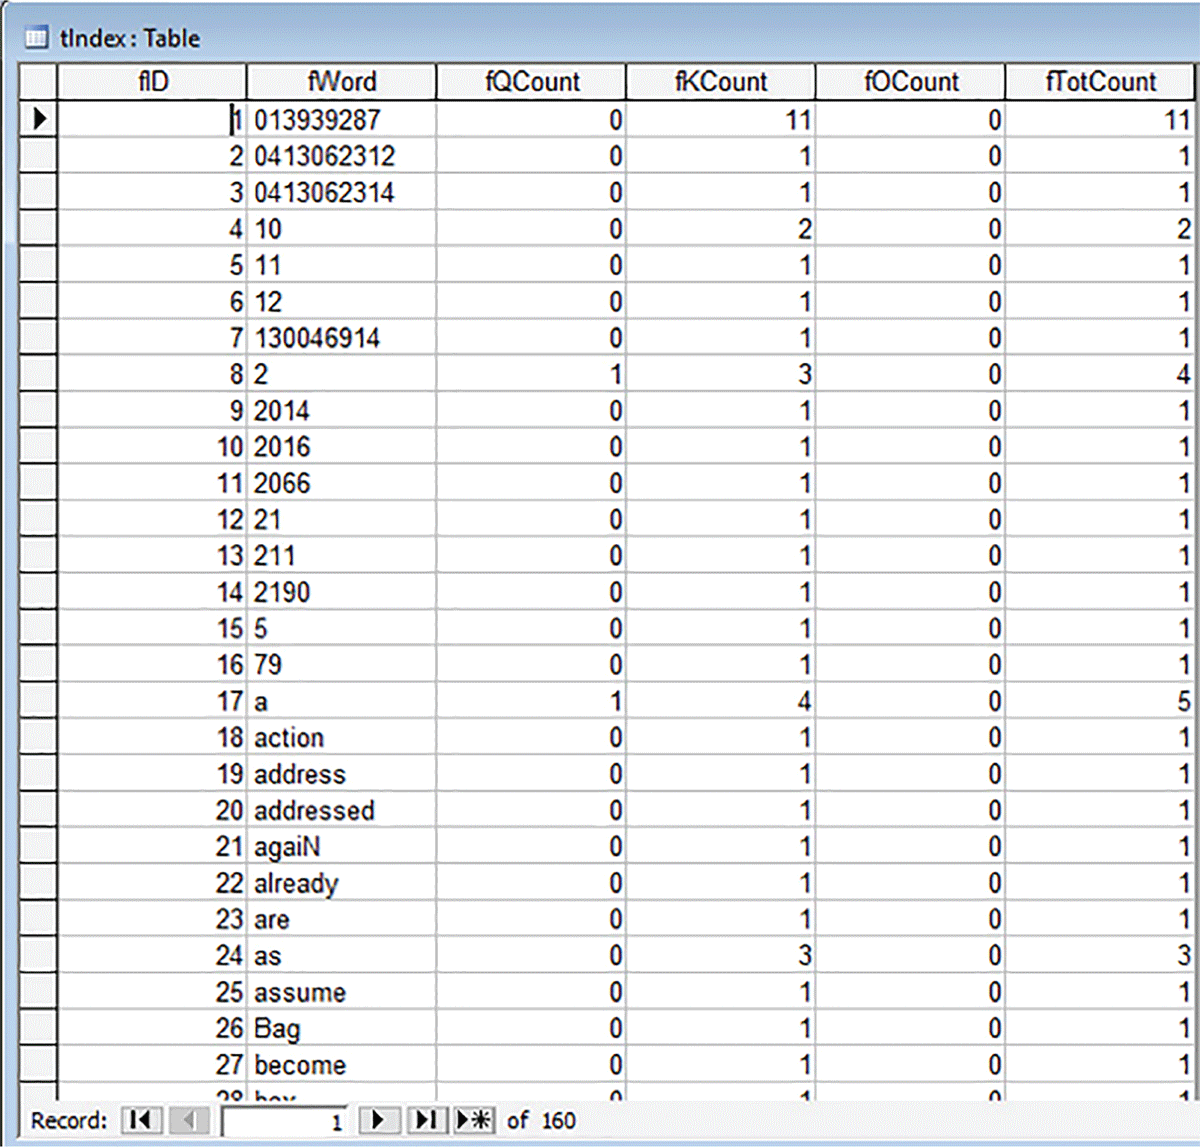
Figure 2
Part of the table displayed in Microsoft Access.
Statistical analysis of tIndex data
The table provides a list of words and is made up of six columns: fID, fWord, fQCount, fKCount and fTotCount where the Q refers to Questioned, K refers to Known, O refers to Other and Tot represents the Total of the Q, K, and if present, O words. It is rare that there will be data in the fOCount column, and therefore this column is routinely deleted.
The tIndesx table affords an opportunity to compute the number of words in the questioned and known documents. This can be achieved in two-ways. First, using the Sum function in Excel, where the total number of Questioned words, the total number of Known words and the combined Total of the Questioned and Known words can be determined.
A further refinement is to determine the number of different words in the examination. This is achieved by using the COUNTIF function in Excel where the number of actual words is ignored and a count is made only if a word exists. Excel is instructed to only count cells which have a value greater than zero, i.e. a word exists.
When the counts for the Questioned and Known columns are totalled they may not equal the count for the Total column. This occurs because the same word may occur in both the Questioned and Known columns and therefore gets counted twice. Subtracting the count of the Total from the total counts of the Questioned and Known columns gives the number of instances where the Same Word occurs in both the Questioned and Known columns. Figure 3 displays, in an example, the Sum and the Counts of words.
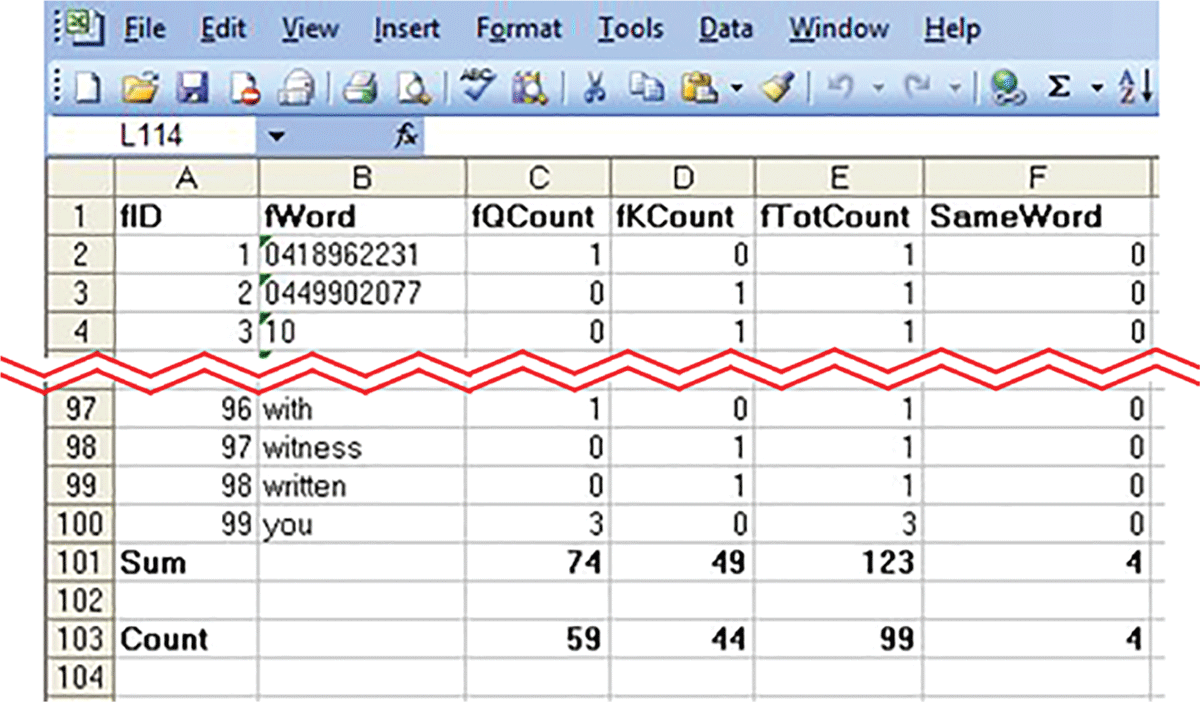
Figure 3
Example of the Sum and the Counts of words generated from the tIndex table.
If there were 59 different words in the Questioned column (fQCount) and 44 in the Known column, added together there are 103 different words. However, the actual count of different words in the Total column is 99. The difference of 4 words (103–99=4) signifies there are 4 words that occur in both the Questioned and Known columns.
Same Word
While the number of Same Words can be quickly calculated, it can be useful to compare the Same Words in conducting Searches. Therefore, knowing what the Same Words are becomes important. When there are only a few words, this can be achieved by simply looking at the table of words. However, when there are a large number of words this can be a more difficult task. By creating a separate column of 1’s and 0’s where the 1’s signify the Same Word and the 0’s signify that there is only a word in either the Questioned or Known columns, this can be easily achieved.
To determine whether the Same Word occurs in the Questioned and Known columns, a new column is created; which is titled Same Word. Excel is programmed using a nested IF and AND statement for each cell in which the syntax is written in the form:
IF(AND (condition1, condition2), valueiftrue, valueiffalse)
This function expressed as a phrase states:
“IF condition1 is met AND condition2 is met, THEN assign true, ELSE assign false”
Using the example in Figure 4 below for the first row, the actual syntax is:
IF(AND(C2>0,D2>0), 1,0)
Simply, the syntax for the first row (Figure 4 below) reads:
IF the numerals 013939287 occur in the QCount cell AND in the KCount cell THEN assign 1, ELSE assign 0
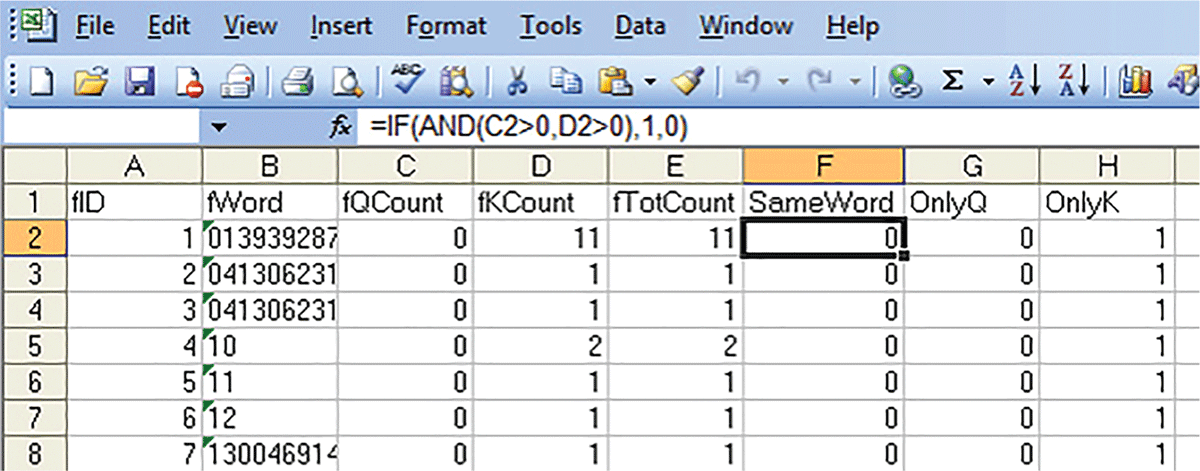
Figure 4
Example of syntax used to indicate the Same Words occurring in both the Known and Questioned writings.
Once this has been done for each numeral or word, using the Sum function the total of all of the 1’s is calculated to give the total number of Same Words between the Questioned and Known writing. Using the Filter function in Excel on the Same Word column the 1’s can be selected to reveal all the instances of the Same Word.
Only Q
In some instances, it can also be useful to calculate only the Questioned or Known words.
To do this, use the Filter function to display them. Using the IF and AND statements in the example, the following syntax is used for the Questioned words.
IF(AND(C2>0,D2>0), 1,0)
The 1’s are then added together to give the number of different words, only on the questioned document. Using the Filter function on the Only Q column, the 1’s can be selected which reveals all the instances of the Questioned words. Figure 5 displays this syntax using the same example in an Excel spreadsheet.
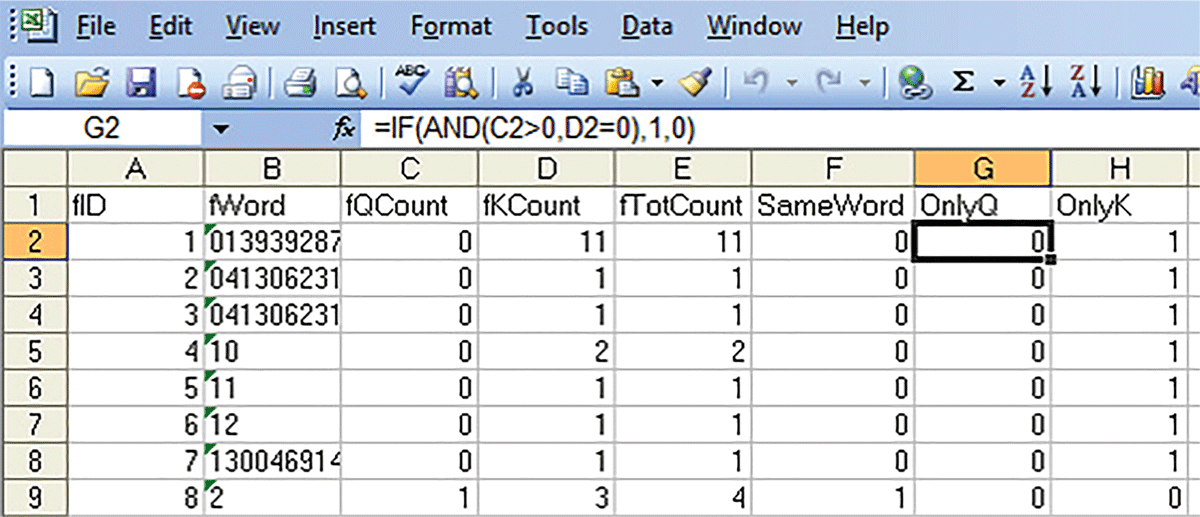
Figure 5
Example of syntax used to indicate words only occurring in the Questioned document.
Only K
Similarly, in the example to display only the Known words the following syntax is used:
IF(AND(C2>0,D2>0), 1,0)
The 1’s in this column are then totalled to determine the number of Known words and then, using the Filter function and selecting the 1’s in Excel on this column it will list only the Known words.
Statistical analysis of Segment data
The tSegments table provides a count of all the upper and lower-case letters present in the questioned (fQCount) and known (fKCount) handwriting and the total of the letters (fTotCount). Figure 6 depicts a tSegments table before separate tables have been created for upper-case and lower-case letters.
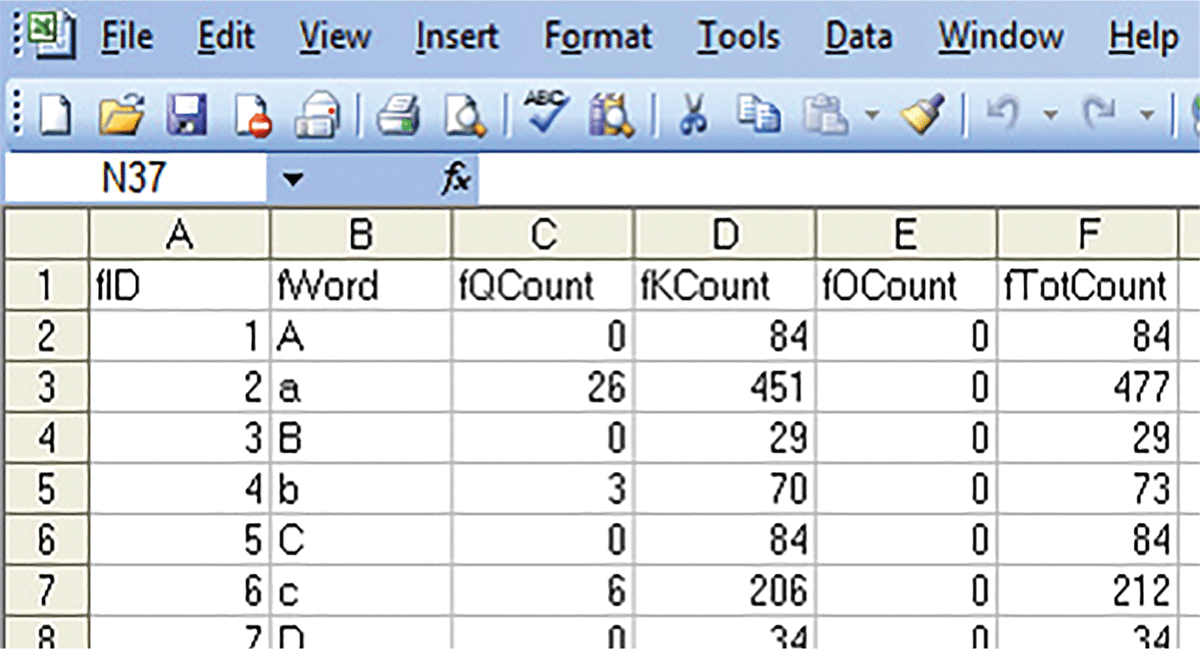
Figure 6
tSegments table containing the counts of upper- and lower-case letters.
A bar chart of these counts can be produced in Excel. However, it is more beneficial to use a % frequency of occurance bar chart as this resolves any issue when the counts between the Questioned and Known letters are significantly different. Without converting the counts to % frequency, one group (Questioned or Known) will dominate the other and no useful information can be viewed in the plot. Converting these counts into % frequency, a % frequency of occurance plot can be produced where both groups of data are displayed on the same scale. This allows the % frequency data of the Questioned and Known writing for the lower-case and upper-case letters to be compared to determine if there is a sufficient spread of data to conduct a worthwhile comparison. Figure 7 is a % frequency of occurance plot of lower-case letters from the example. In this instance, the spread of data between the Questioned and Known writing is reasonably similar. Every Questioned letter formation can be compared with an equivalent Known letter formation, signifying that a worthwhile examination can be undertaken. It is also easy to see from the plot that the Known letter formations b, k, m, v, x and y are not present in the Questioned letter formations.
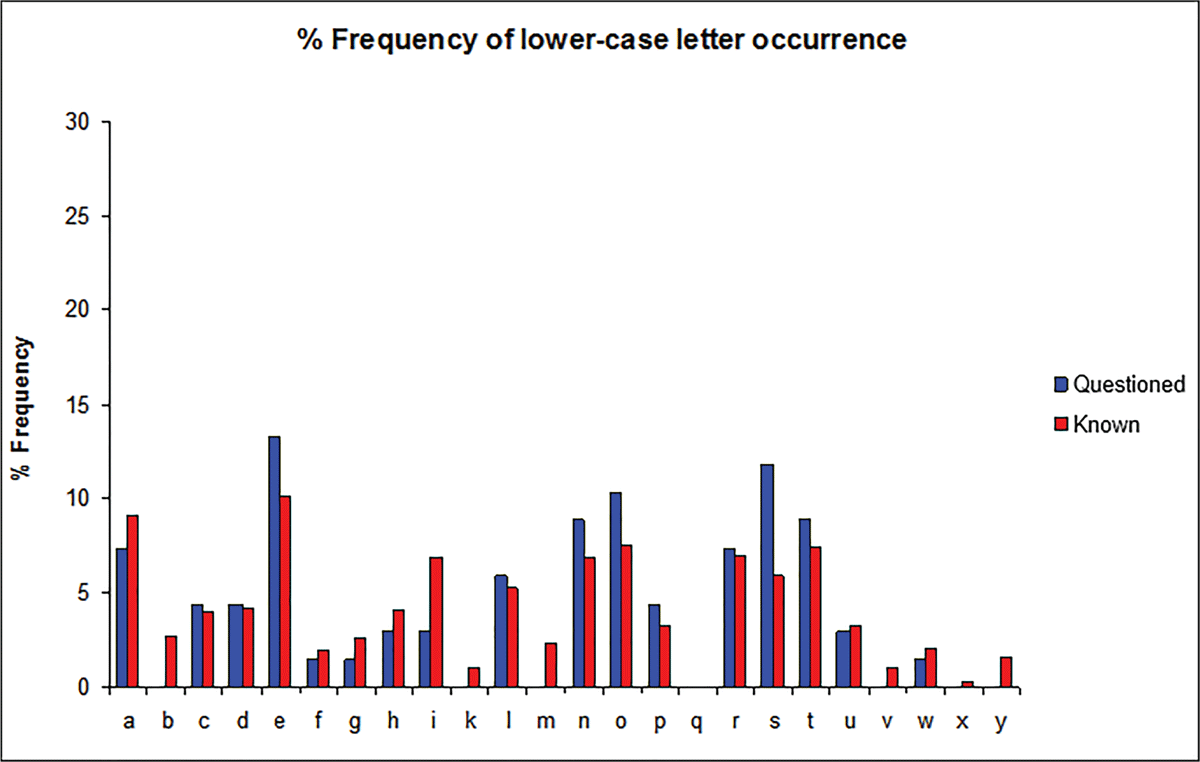
Figure 7
Example of % frequency of occurance plot of the upper-case letters in the Questioned and Known writings.
In order to obtain this information, the tSegments table is split into upper-case and lower-case letters. Note, the Write-On™ default produces a tSegments table combining the upper-case and lower-case letter counts. To obtain the counts separately for upper-case and lower-case letters in Write-On™ go to Options>User Preferences and make sure the preference “#14 Index caps” row is set to “Respect caps”.
Once the “Respect caps” has been selected, Write-On™ will produce a tSegments table with the counts for both the upper and lower-case letters. This table is then divided into two tables: one for upper-case letters and the other for lower-case letters. Now it is easy to use the Sum function in Excel to determine the total number of letters for fQCount, fKCount, and fTotCount. The % frequency of occurance is then calculated for each lower-case and upper-case letter in the Questioned and Known writing using formula, where i is an event, ni is the number of times the event occurred and N is the total number of events.
% frequency of occurrence (ni/N)× 100 (1)
Figure 8 above displays the syntax used to calculate the % frequency of occurance in Excel. Statistical analysis of the tSearches data
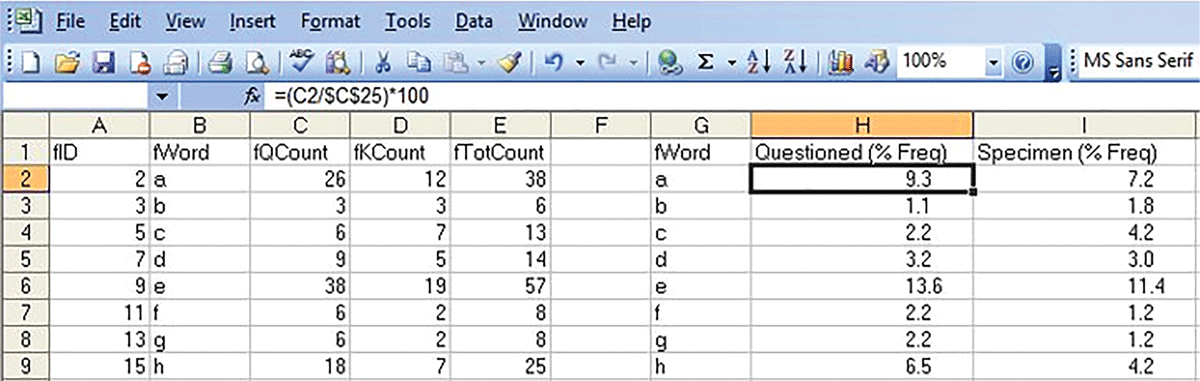
Figure 8
Syntax used to calculate % frequency of occurance in the Questioned and Known writings.
The tSearches table (Figure 9) displays all of the characters or strings (fString) that were searched in the Questioned and Known handwriting and their total count.
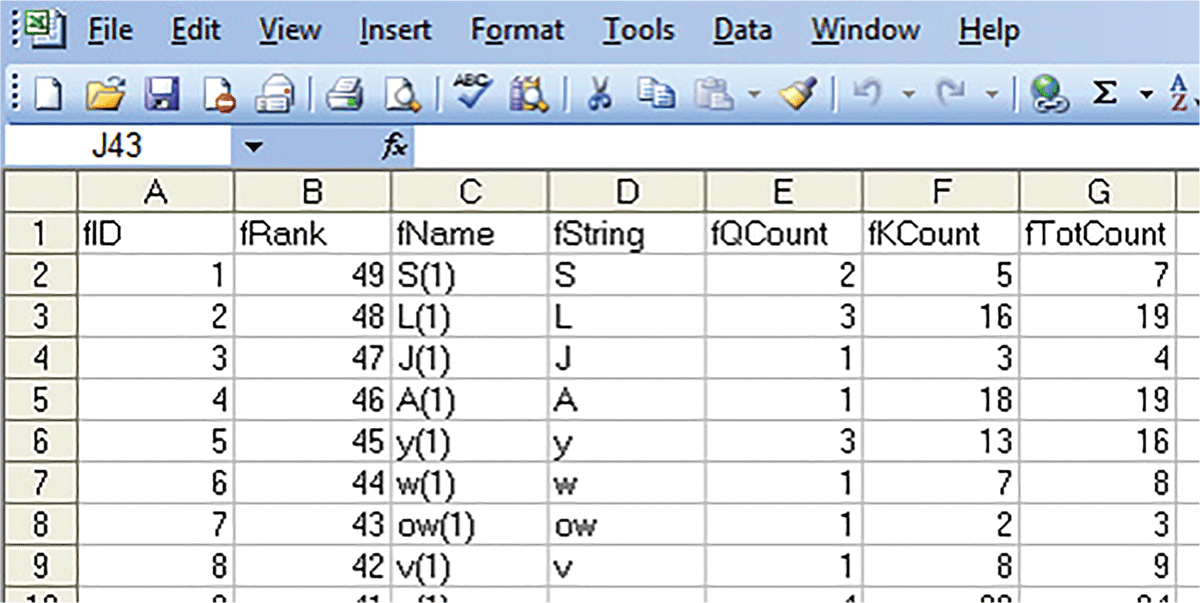
Figure 9
tSearches Table containing the results of all the characters and strings searched.
In order to ensure a thorough search is carried out of all of the characters in the questioned document, the search is done alphabetically for lower- and upper-case letters, then the numerals, 0 to 9, and if necessary, any symbols. In the instance where a search returns a large count for that particular letter, searches are performed on specific letter combinations that occur in the questioned writing. For example, if the letter being searched is “a”, which occurs in the words “case” and “original” in the questioned document, the letter combinations “as” and “all” are searched. Note, the letter to the right of the letter of interest is used to maintain strict chronological order. This significantly reduces the number of results returned from this new, refined search, but also provides a better representation of how the writer forms an “a” in combination with particular letters. This list of searches can be included in the results section of a report together with a printout of the handwriting comparison chart, which further demonstrates that the handwriting examination was carried out having sufficient quality and quantity of material for comparison.
Conclusion
Utilizing the data generated by Write-On™ and following the basic steps outlined in this paper, allows the FDE to understand the comparability or lack thereof, between the questioned and known writing and therefore, better present the results and conclusions of a handwriting examination. However, this is a mere introduction to realizing different ways in which the data generated by Write-On™ can provide further advancement in obtaining objective and empirical data from handwriting comparisons.