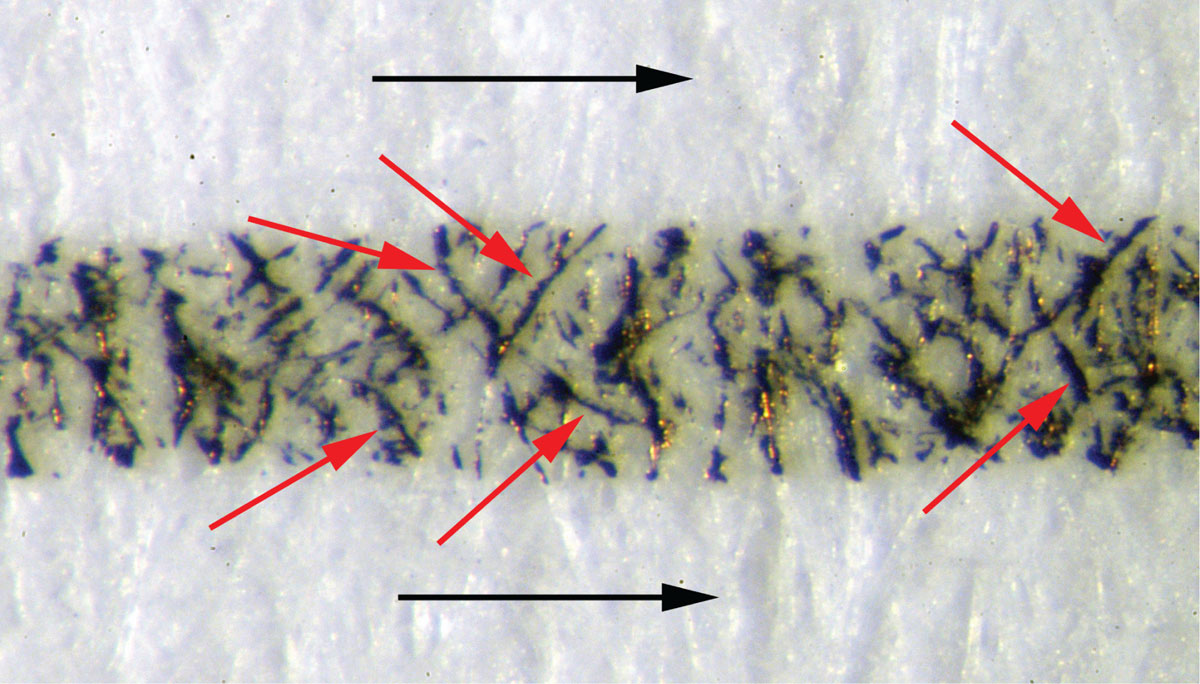
Figure 1
Microscope image of a line written from left to right illustrating the build-up of ink on the left side of the paper fibres (with black arrows indicating line direction and red arrows indicating some fibres with preferential ink build-up).
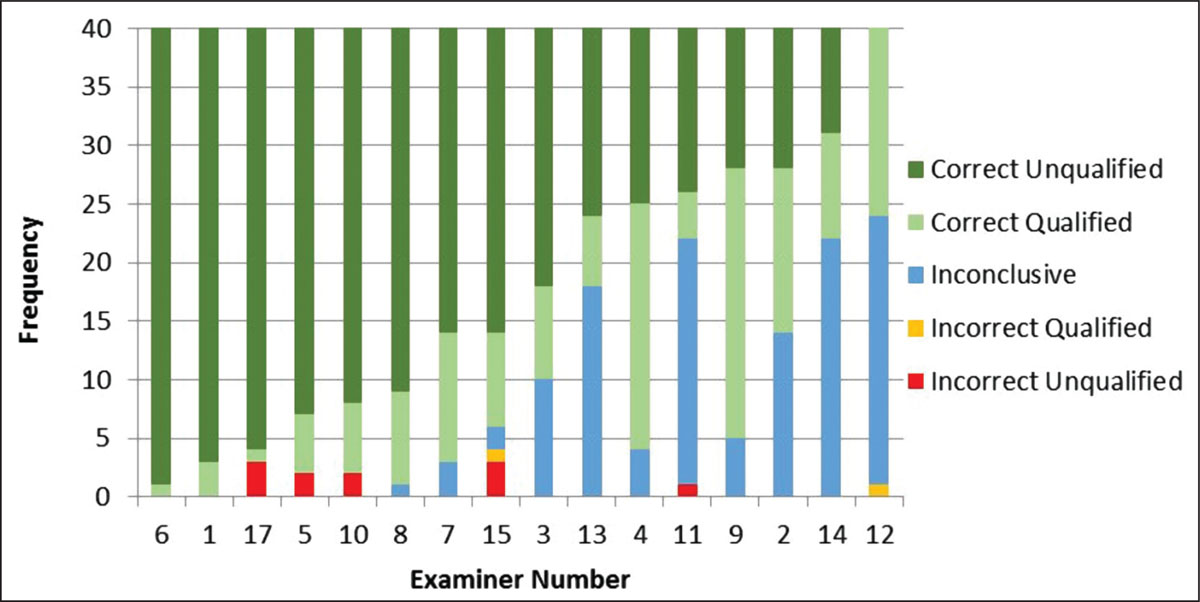
Figure 2
Graph showing examiner results in order of decreasing frequency of correct (unqualified) responses.
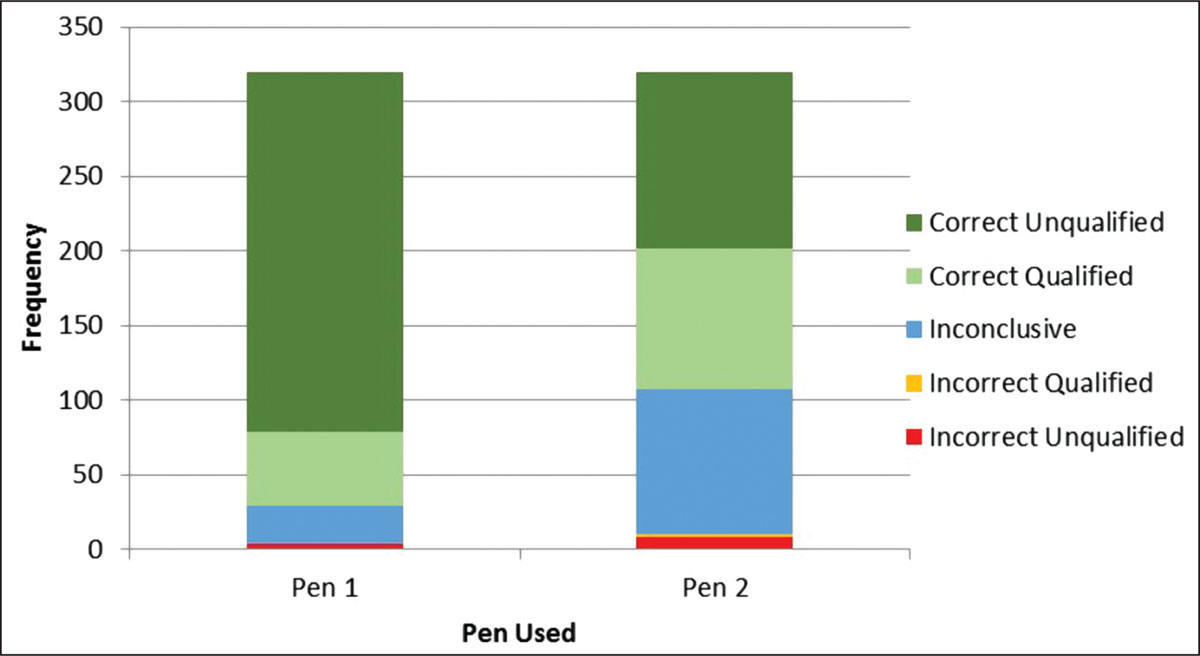
Figure 3
Graph showing proportional examiner results for Pen 1 versus Pen 2.
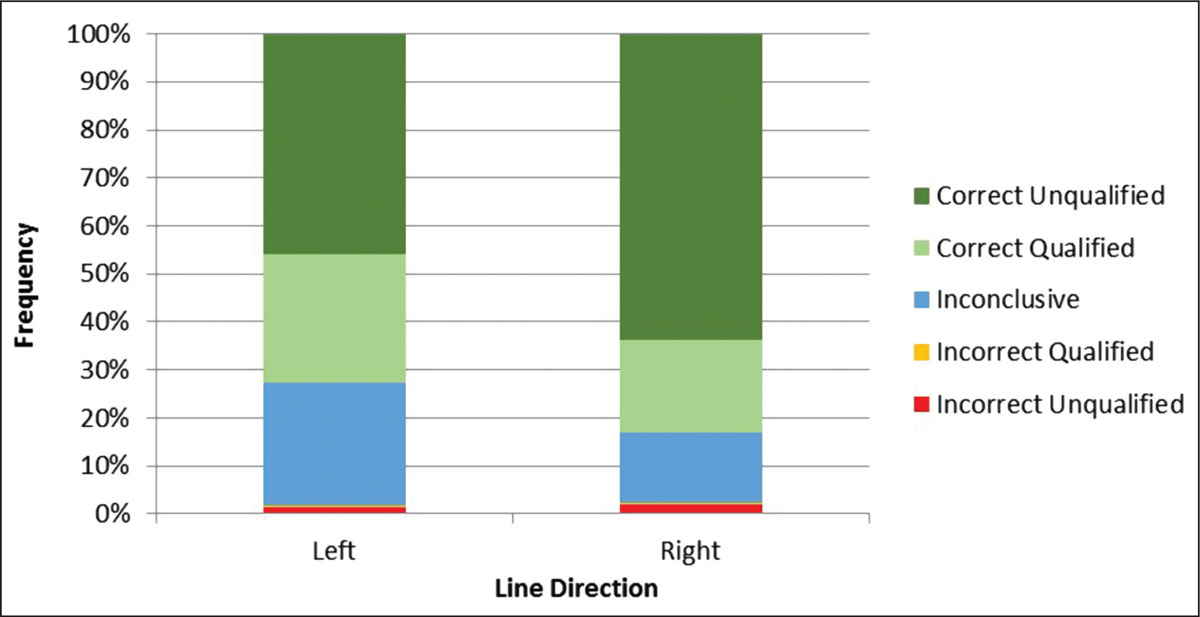
Figure 4
Graph showing proportional examiner results for line direction (left versus right).
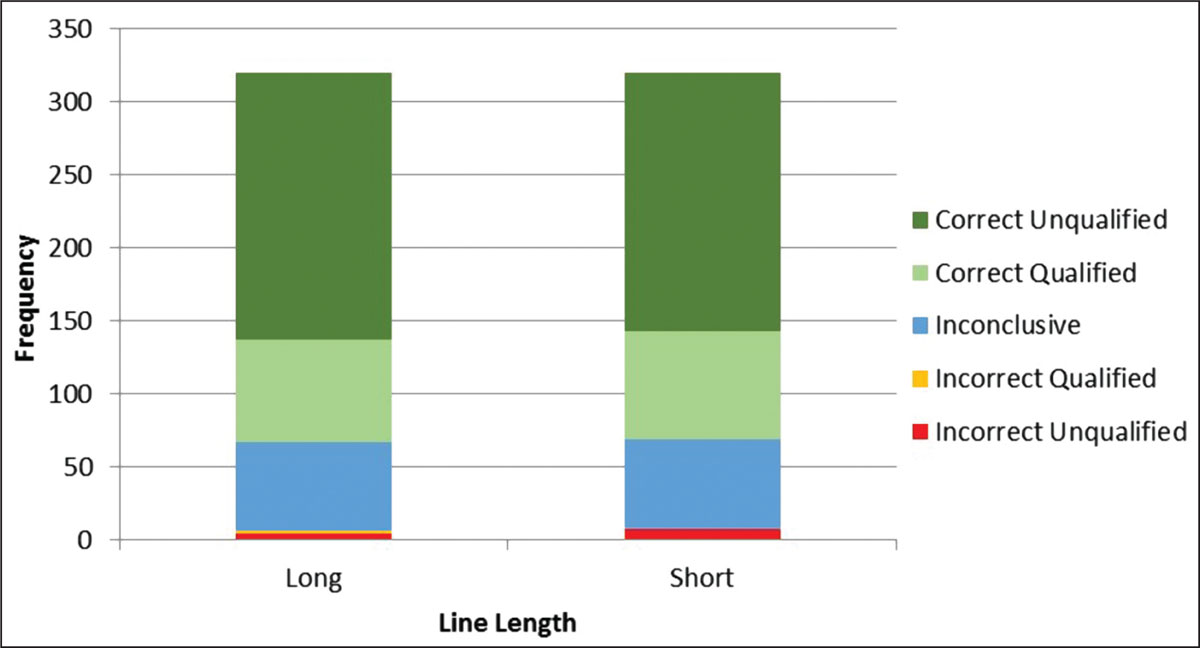
Figure 5
Graph showing no significant effect of the line length (5mm versus 30mm).
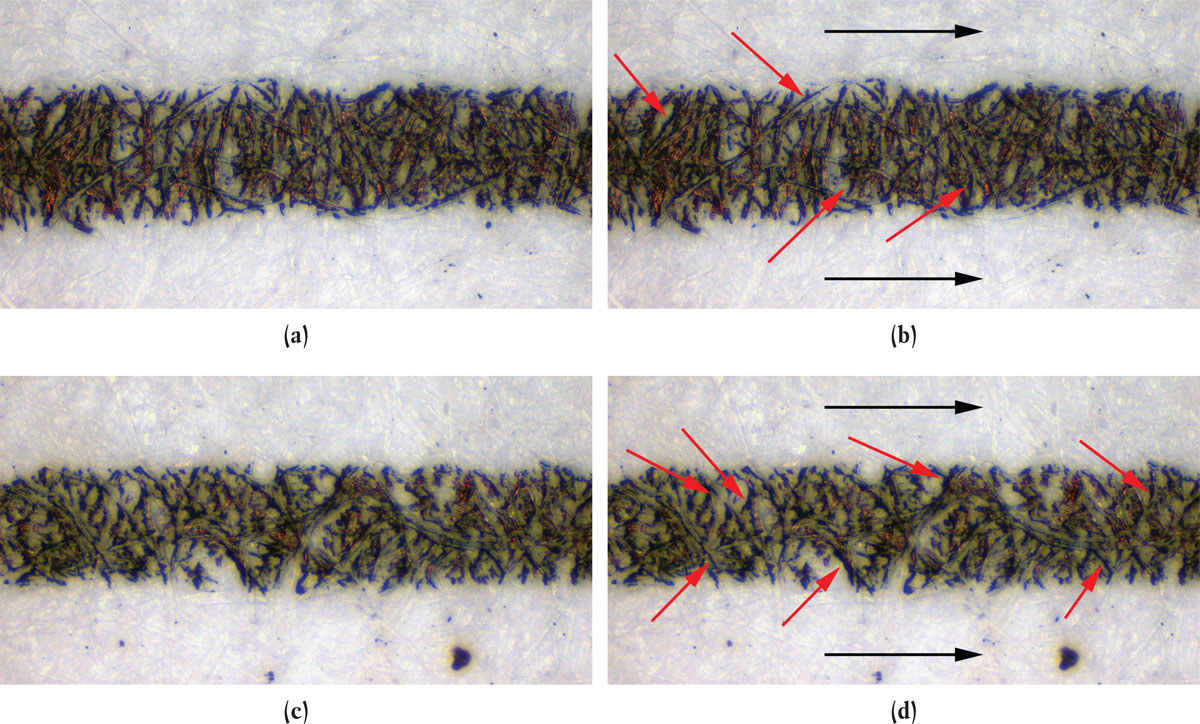
Figure 6
(a) Line extract from Pen 1; (b) same image as (a) with black arrows indicating line direction and red arrows indicating some fibres with preferential ink build-up; (c) Line extract from Pen 1; (d) same image as (c) with black arrows indicating line direction and red arrows indicating some fibres with preferential ink build-up.
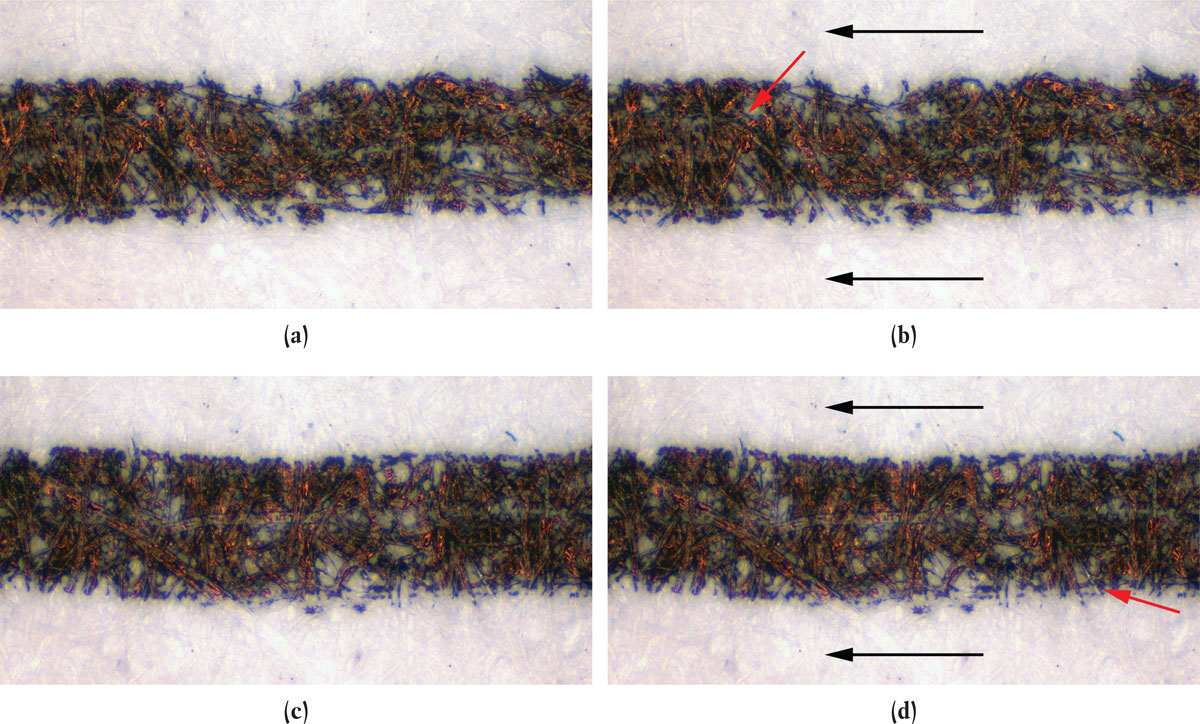
Figure 7
(a) Line extract from Pen 2; (b) same image as (a) with black arrows indicating line direction and red arrows indicating some fibres with preferential ink build-up; (c) Line extract from Pen 2; (d) same image as (c) with black arrows indicating line direction and red arrows indicating some fibres with preferential ink build-up.
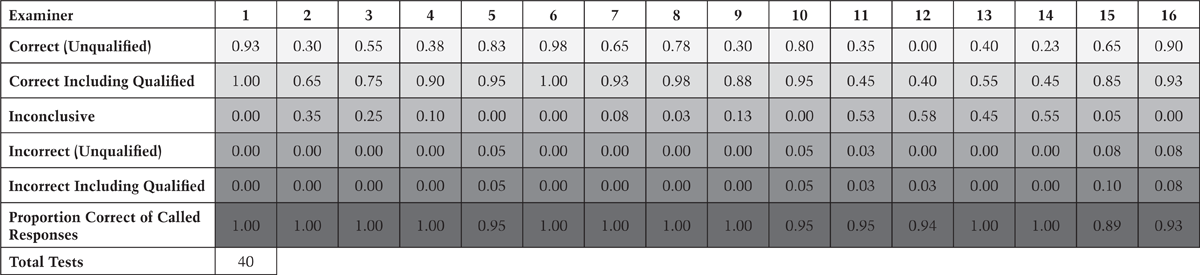
Table 1
Proportions of Responses

Table 2
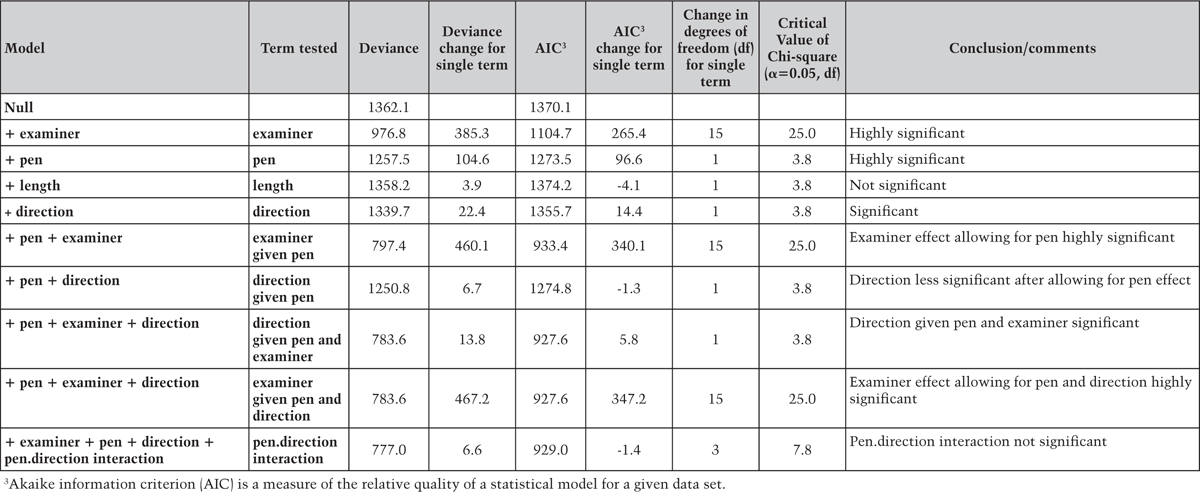
Statistics