
Introduction
There are several techniques that can be used to determine the direction in which a ballpoint pen ink line was written. Perhaps the most obvious technique is the observation of the presence of what could be termed a “depleted ink start” which takes the form of either a void at the start of the ink line or a deposit of ink, often dry and flaky in what has been termed a “dry start” when the ink has dried on the ball of the pen, followed by a void before the ink starts to flow freely and deposit more evenly for the rest of the line (Fryd, 1975, Hung & Leung, 1995 and James & Walker, 1998). The depleted ink start can often also take the form of an imprint of a striation pattern that has been left on the pen after previous writing (the memory effect of ballpoint pens) (Hung & Leung, 1995). Where a curve occurs in the writing, the appearance of striations usually indicates the direction of pen motion (a striation across a curve will begin on the inside edge of an ink line and end on the outside edge) (Hung & Leung, 1995 & Snape, 1980). Another technique utilises the preferential build-up of ink on the upstream side of paper fibres (Fryd, 1975 and Hung & Leung, 1995). It is this technique that is the focus of this paper and can be of prime importance in determining line directions in some circumstances. This is for the reason that there are often examples of ballpoint pen ink lines where other directional indicators are not present or usable, for example short sections of ink lines (such as letter “t”, “A”, or “H” horizontal lines), ink lines without striations and straight ink lines with striations where the ends are merged into other written lines.
Figure 1 shows a microscope image of a line written from left to right and represents a good example of the build-up of ink on the left side of the paper fibres, allowing for a straightforward determination by observing this effect.
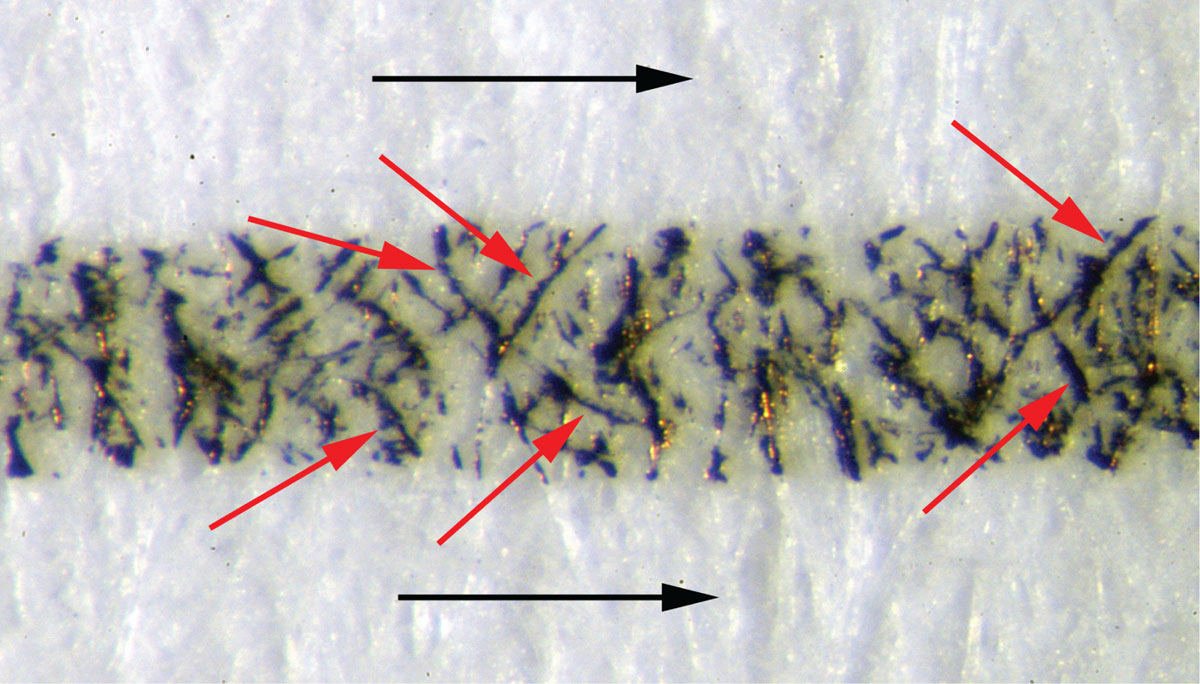
Figure 1
Microscope image of a line written from left to right illustrating the build-up of ink on the left side of the paper fibres (with black arrows indicating line direction and red arrows indicating some fibres with preferential ink build-up).
The technique is mentioned in a small number of publications but there do not appear to be any published results of any blind testing of forensic document examiners’ ability to determine the direction of writing of ballpoint pen ink lines using this technique (Fryd, 1975, Hung & Leung, 1995 and Ellen, 2006).
Methods and Materials
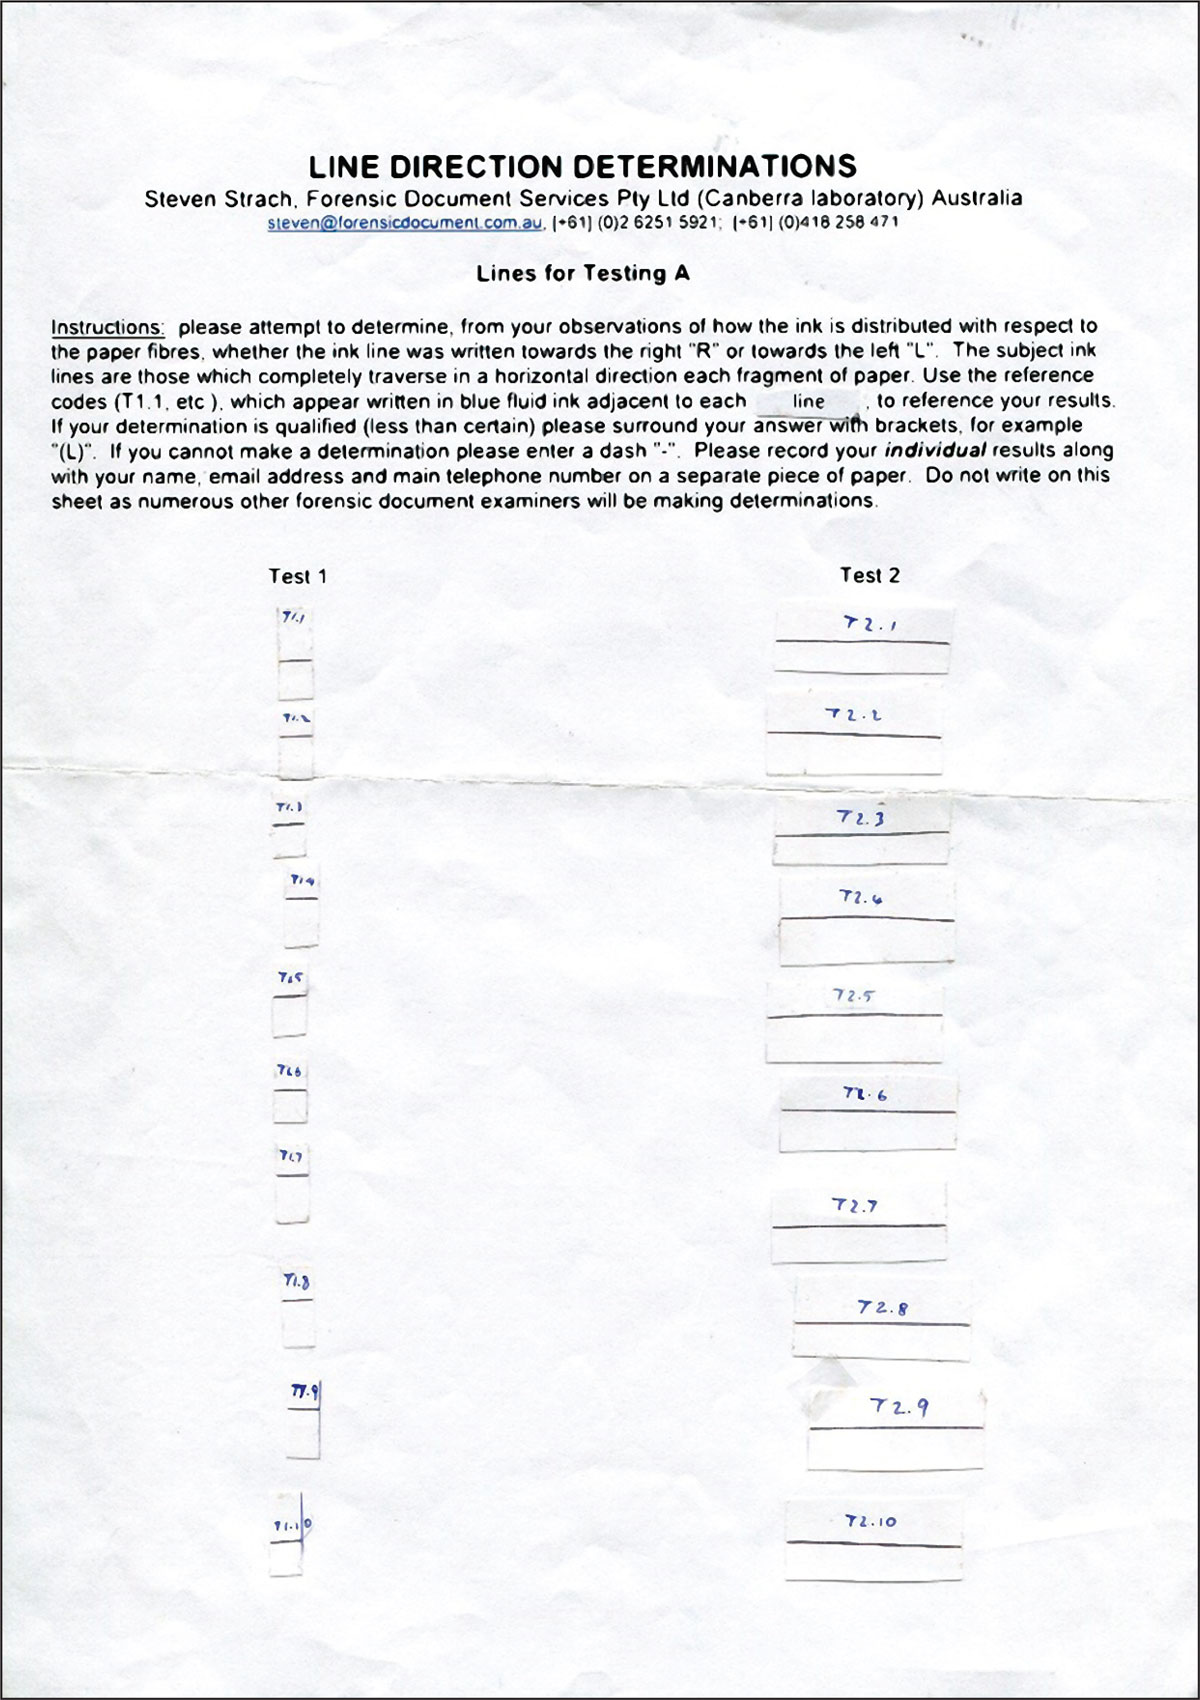
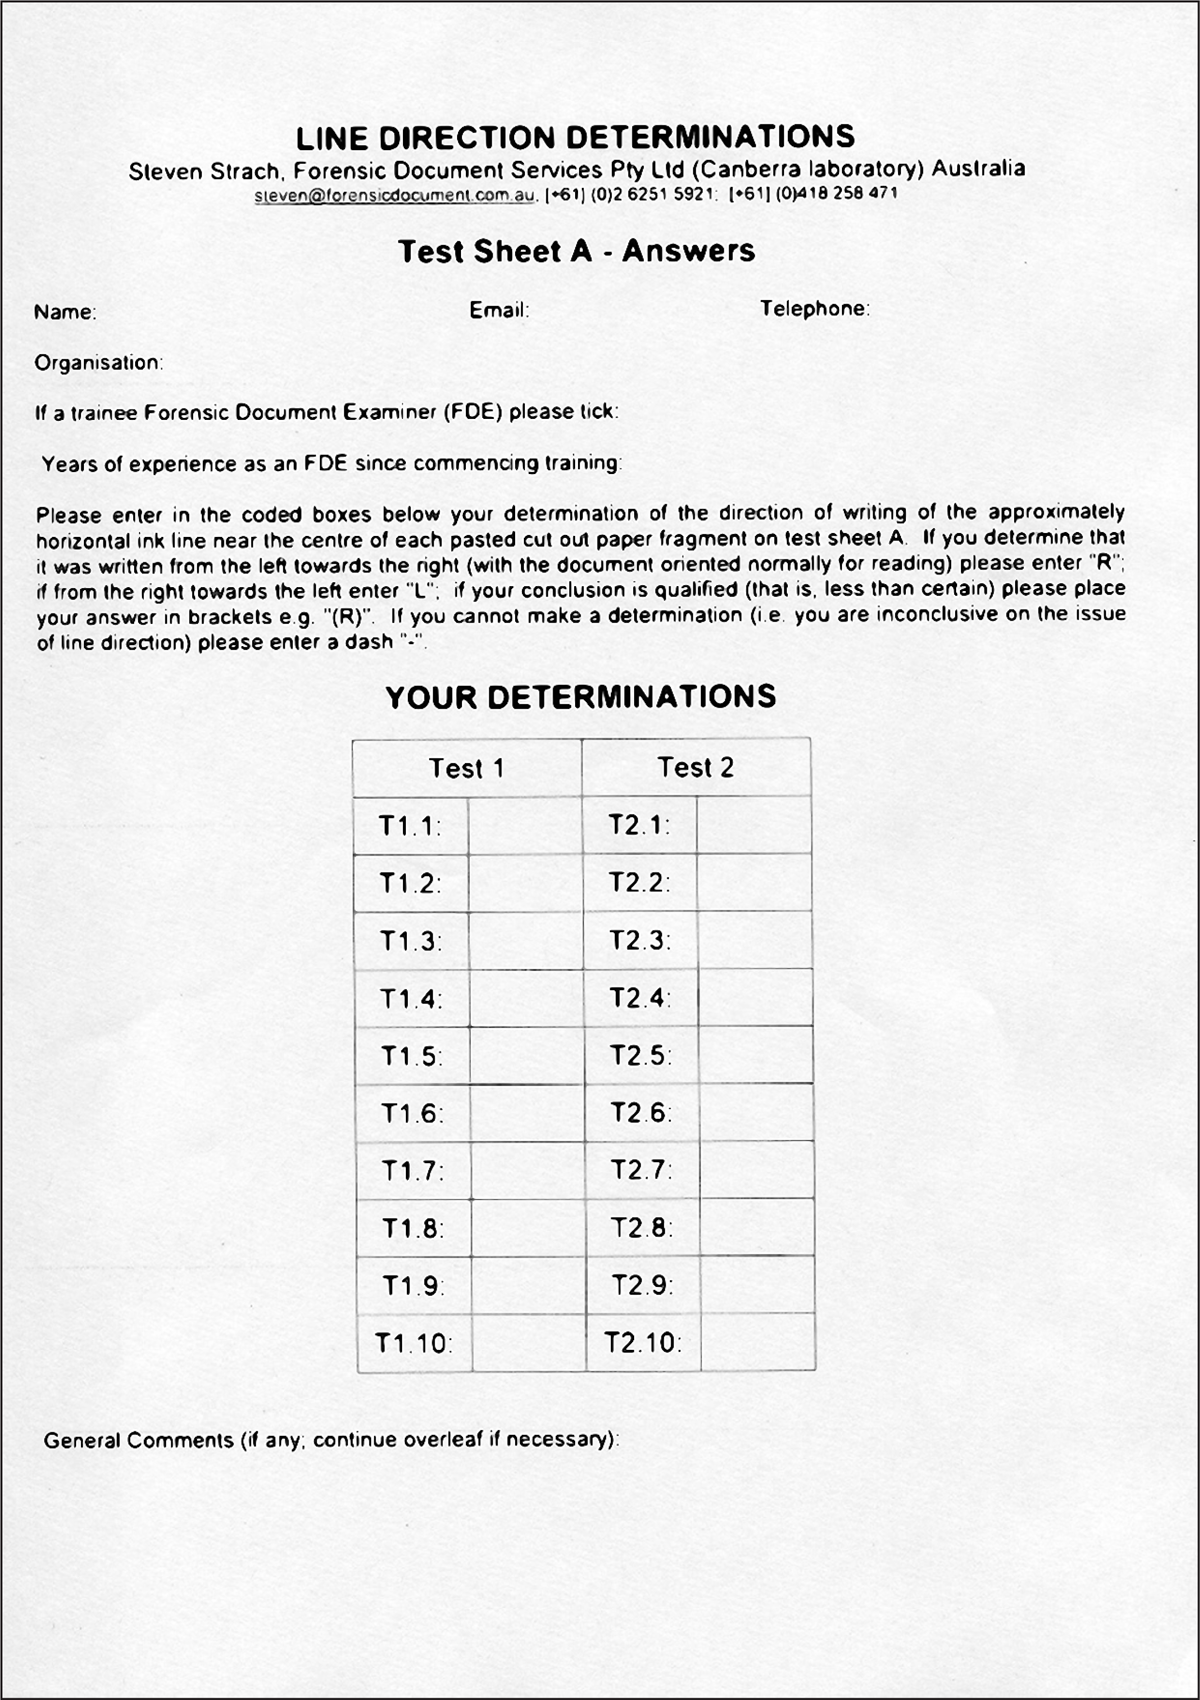
Four tests were constructed to assess the ability of forensic document examiners to correctly determine the direction of writing of ballpoint pen ink lines. Two black ballpoint pens were selected (Pen 1 was a Bic Biro Medium Point and Pen 2 was a Mini Mobile Phone Ballpoint Pen) and used to write twenty straight lines each. The pens were chosen from an initial survey of many pens. Pen 1 was chosen on the basis of an apparent ease of determination of line direction and pen 2 was chosen as an example of a more difficult determination of direction. A random number generator was used to designate the direction of each line used for the tests. The lines were written freehand using qualitatively medium writing pressure with a wad of twenty sheets of paper underneath to provide a compliant writing surface similar to that of a writing pad. Sections measuring 5 mm (“short”) and 30 mm (“long”) of each line were then physically removed and pasted on to two test sheets in ten rows and two columns (the short lines in the first column and the long lines in the second column). Line extracts from Pen 1 were pasted on to a sheet and labelled “Test Sheet A” (see appendix 1) and line extracts from Pen 2 were pasted on to a sheet and labelled “Test Sheet B”. Extracts from straight lines only, avoiding the start or end of the complete written lines, were used for the tests so that other pen effect information (as described in the Introduction) would not assist in the determination.
The test was then distributed in turn to sixteen document examiners from a range of government and private document examination laboratories around Australia. The participants were each given the same written instructions to determine whether the line was written towards the right or the left. Unqualified (effectively certain), qualified (less than certain) and inconclusive responses were allowed. Such response categories were chosen to allow taking the test and subsequent analysis to be as straightforward as possible. Participants were not instructed on what instrumentation should be used to make their determination. The only instruction on technique was that the determination should be based on observations of how the ink is distributed with respect to the paper fibres. A copy of these instructions and one of the test sheets sent to participants is attached at Appendix 1. An informal advice was also provided in terms of recommending that participants not familiar with or who do not regularly use the technique should prepare some examples of ballpoint pen writing of known direction first to observe the relevant ink/paper fibre effects under the microscope. It was also suggested that they view a preliminary presentation on the topic given at the Australasian Society of Forensic Document Examiners Incorporated (ASFDE Inc.) Conference in May 2013.
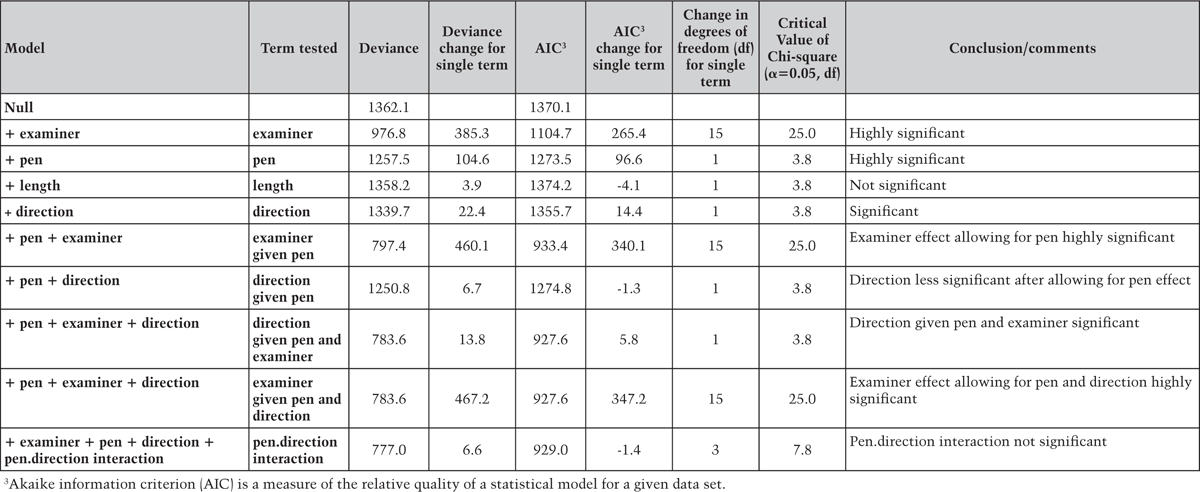
The participant responses were analysed to determine the reliability of the technique. A statistical analysis was undertaken to assess the effect of the following factors on examiner ability and confidence in determining line direction: the individual examiner; ink lines from pen 1 or pen 2; length of ink line; and direction of ink line (McCullagh & Nelder, 1989 and Agresti, 1990). The statistical software program R version 3.1.0—“multinom” function was used to assess the results2 (Venables & Ridley, 2002 and Fox & Andersen, 2005). This analysis was conducted by Mr Geoff Masters of the Canberra Institute of Technology.
Results
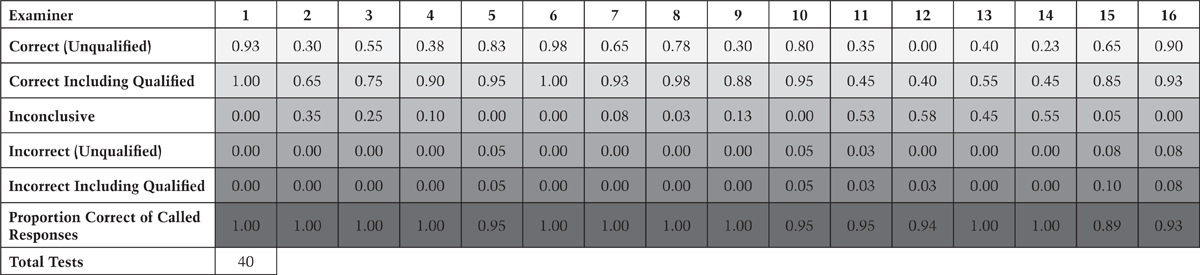
The basic analyses of examiners’ determinations are displayed in tabular form at Appendix 2 and the detailed statistical analysis results are shown at Appendix 3.
Unqualified and qualified responses are classified as “called” responses and were assessed by the authors as being either correct or incorrect. Inconclusive responses are classified as “uncalled” and were regarded by the authors as neutral (neither correct nor incorrect) as the main aim was not to evaluate examiners but rather to assess the reliability of called responses. Of the called responses (that is, unqualified and qualified combined), participants scored an average of 97.6% correct. The highest percentage of correct called responses was 100% while the lowest percentage of correct called responses was 89.5%. Of the 16 participating examiners, 10 were correct in 100% of their called responses.
Considering all responses (called and uncalled) the average percentage of correct unqualified responses only was 56.3% (noting that the balance of 43.7% comprised an average of 22.5% for correct qualified responses, 19.2% for inconclusive, 0.3% for incorrect qualified responses and 1.7% for incorrect unqualified responses.). The highest percentage of correct unqualified responses was 97.5% and the lowest was 0% (one examiner only gave qualified called responses).
Participants answered inconclusive for an average of 19.2% of their responses with the highest percentage of any one examiner being 57.5%. Five of the sixteen examiners did not answer inconclusive for any of their responses. All examiners provided at least one qualified response but in the case of one examiner only one qualified response was provided (the rest being unqualified, and all correct).
The results for each examiner are represented in graphical form at Figure 2, displayed in order of decreasing frequency of correct (unqualified) responses. The examiner effect results are addressed in more detail in the discussion section.
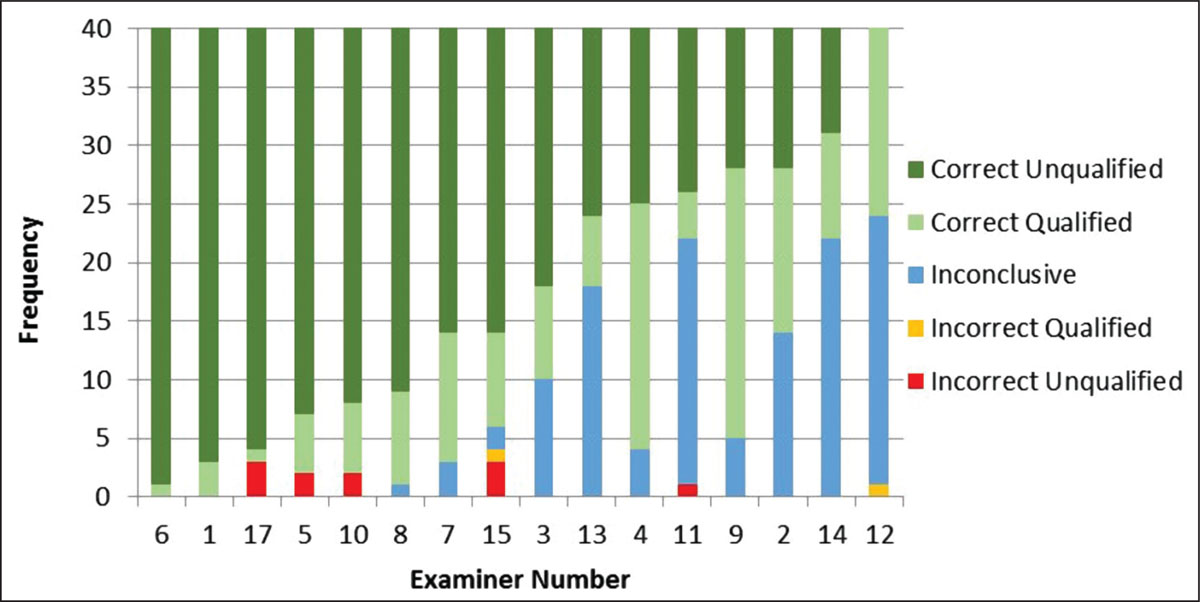
Figure 2
Graph showing examiner results in order of decreasing frequency of correct (unqualified) responses.
There is a clear effect of the pen (pen 1 versus pen 2) on the proportion of the five possible responses, as shown in Figure 3. There are many more unqualified correct responses and fewer inconclusive responses for pen 1, as opposed to the responses for pen 2 which show an approximately even distribution between unqualified correct, qualified correct and inconclusive responses. Statistically this is highly significant (see detailed statistical analysis at Appendix 3).
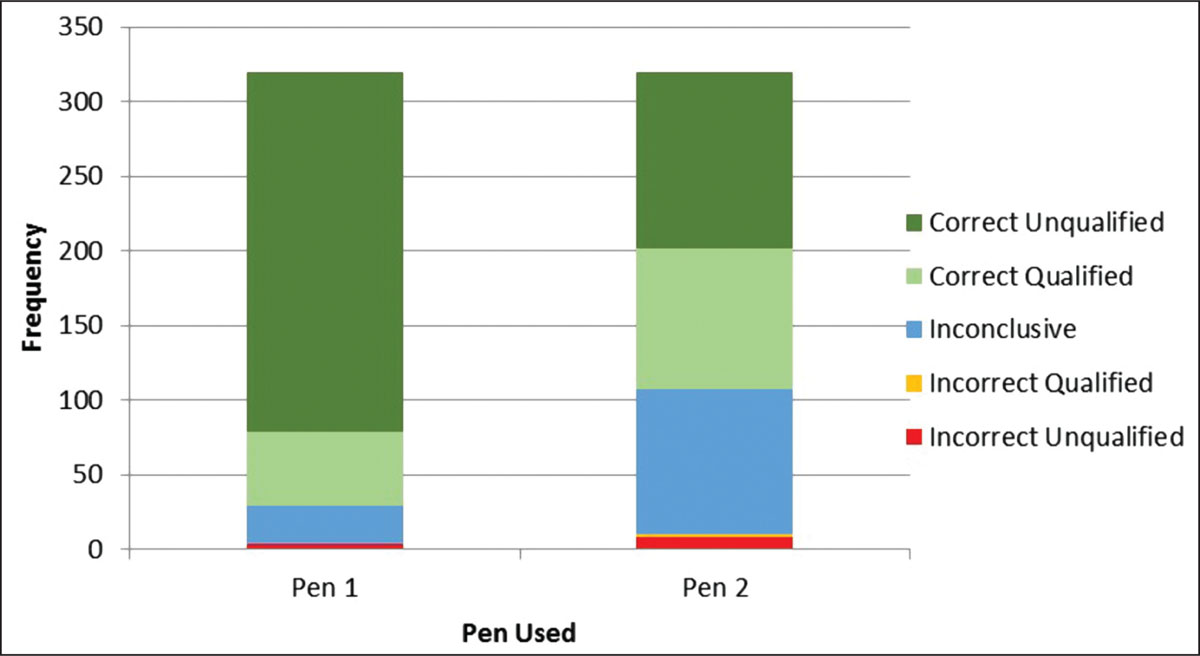
Figure 3
Graph showing proportional examiner results for Pen 1 versus Pen 2.
There appears to be an effect of the pen direction (left versus right) on the proportion of the five possible responses, as shown in Figure 4. It should be noted that since by chance there were more lines in a right direction than left in the tests, this Figure shows percentage frequencies. There are proportionally more unqualified correct responses for the right direction line tests than for the left. Statistically this is significant (see detailed statistical analysis at Appendix 3).
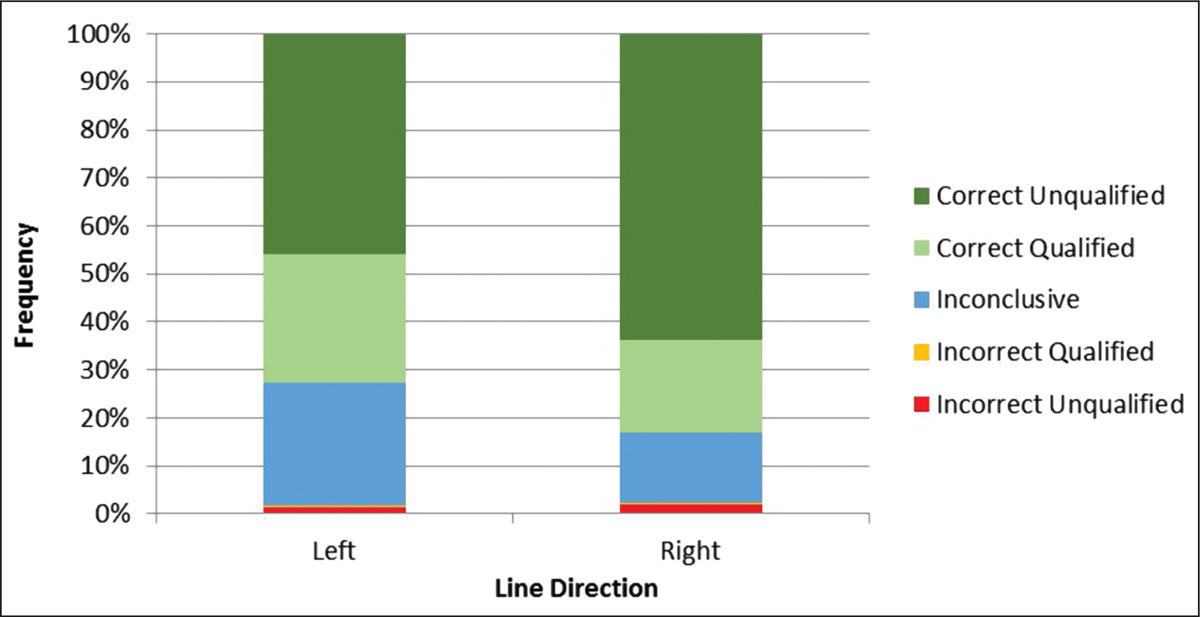
Figure 4
Graph showing proportional examiner results for line direction (left versus right).
There is no significant effect of the line length (5 mm versus 30 mm) on the proportion of the five possible responses, as shown in Figure 5 (see detailed statistical analysis at Appendix 3).
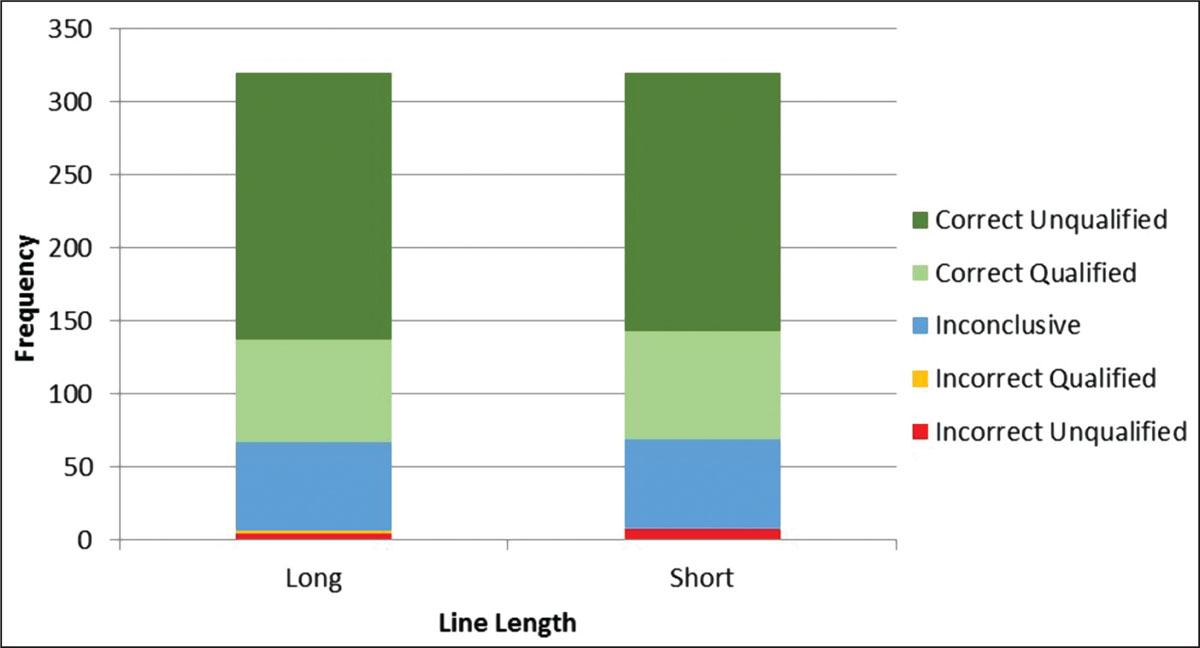
Figure 5
Graph showing no significant effect of the line length (5mm versus 30mm).
Discussion
The proportion correct of called responses appears to the authors to be the most important assessment of the reliability of this method. This category of results deliberately disregards the inconclusive responses which do not relate to the reliability of the determination. In other words, where the examiner does provide a conclusion (that is a “called” response) this statistic provides a measure of the reliability of that conclusion. The 97.6% average proportion correct of these called responses shows that this technique has a high reliability of indicating the correct line direction.
As shown in Figure 2, there is a wide range of examiner responses. This examiner effect is statistically highly significant (details of all the statistical analyses are attached at Appendix 3). The variation in ability and confidence observed in these tests may be related to the examiners’ various levels of experience in undertaking this type of examination but it was not possible to assess this based on the information received to date. It would be necessary to obtain and assess “examiner factors” such as the individual’s experience in using this technique, self-assessed degree of confidence in making such determinations, magnification and lighting used and time spent on undertaking the test. It was not evident at the outset that there was going to be such a wide variation in examiner results and as a result, such information was not obtained. It would be worthwhile undertaking this study with the benefit of this further information as the authors suspect that the time spent on the test and the power of magnification would be critical factors that would possibly explain the difference between the examiners’ results.
The effect of the specific pen on examiner ability and confidence was expected as the pens were specifically chosen to provide a contrast between relatively easy and harder determinations based on preliminary assessments before the tests were constructed.
Somewhat surprisingly, the detailed analysis of the results showed a statistically significant effect related to line direction but no significant effect related to line length.
A possible explanation for the statistically significant effect of line direction on the results is that there may be a perception element to the overall determination. One examiner noted that more difficult line direction determinations could only be made using higher magnification ranges (x40 to over x100) and after rotating the paper through various angles; the examiner only felt comfortable in such circumstances in making a determination when the assumed direction was made to appear to traverse the paper from left to right under the microscope (necessitating a rotation of 180 degrees of the ink line sample when the direction in normal orientation appeared to be right to left). Furthermore, this examiner was also more comfortable (and used this as a further check) in reaching a determination when the assumed direction was made to appear to be from top to bottom (by rotating the sample by 90 degrees) when viewed under the microscope. This may relate to the fact that more ink lines observed under the microscope in general Roman script based handwriting examinations tend to run from left to right than right to left and more tend to run vertically down the page than vertically up the page (participating examiners are generally more used to seeing ink lines in these directions). Given the combination of the fact that the perception element was only noted by one examiner and the less than overwhelming level of statistical significance, it is possible that this effect may be coincidental.
Images of some of the test examples from Pen 1 and Pen 2 are shown at Figures 6 and 7, respectively. Line directions are marked by black arrows. Within these Figures, there are repeat images on which red arrows have been added to indicate areas that were assessed as good examples of the build-up of ink on one side of the fibres (“the ink/fibre effects”) which provide evidence of the line direction. It can be seen that there are multiple examples of the ink/fibre effects visible on the images for Pen 1 but only a few for Pen 2. The authors concur with the general observation of Fryd (1975) that the best effects are observed with fibres that are inclined at a small angle to the ink line. Some fibres were also observed which show the same effect at greater angles (for example 30 to 60 degrees) to the ink line. It might be considered more likely that the ink/fibre effect might only occur away from the centre of the ink line. This is on the basis that the ball, which rotates within the pen when writing on paper, is in fact static (relative to the paper surface) at the point of contact between the ball and the paper. The lower half of the ball moves in the direction of the pen at a velocity of between zero (at the point of contact with the paper) and the same velocity as the pen at the ends of the rotational axis of the ball (within the pen). However, it was sometimes observed that the ink/fibre effect occurred towards the centre of the ink line. It is surmised that, despite the zero velocity of the rotating ball at the point of contact with the paper (apart from rare skipping events), the ink ahead of the ball still has a forward component to its velocity (it is being pushed by a squeezing action of the rotating ball) allowing the ink/fibre effect also to occur near the centre of the ink line.
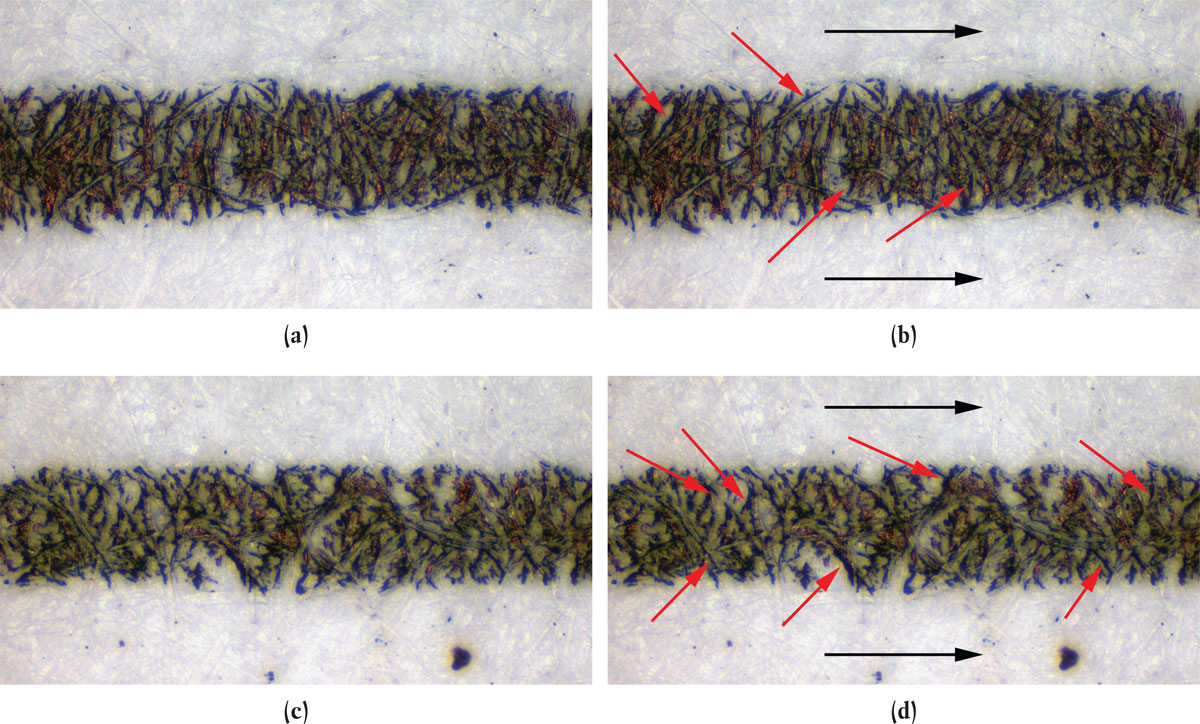
Figure 6
(a) Line extract from Pen 1; (b) same image as (a) with black arrows indicating line direction and red arrows indicating some fibres with preferential ink build-up; (c) Line extract from Pen 1; (d) same image as (c) with black arrows indicating line direction and red arrows indicating some fibres with preferential ink build-up.
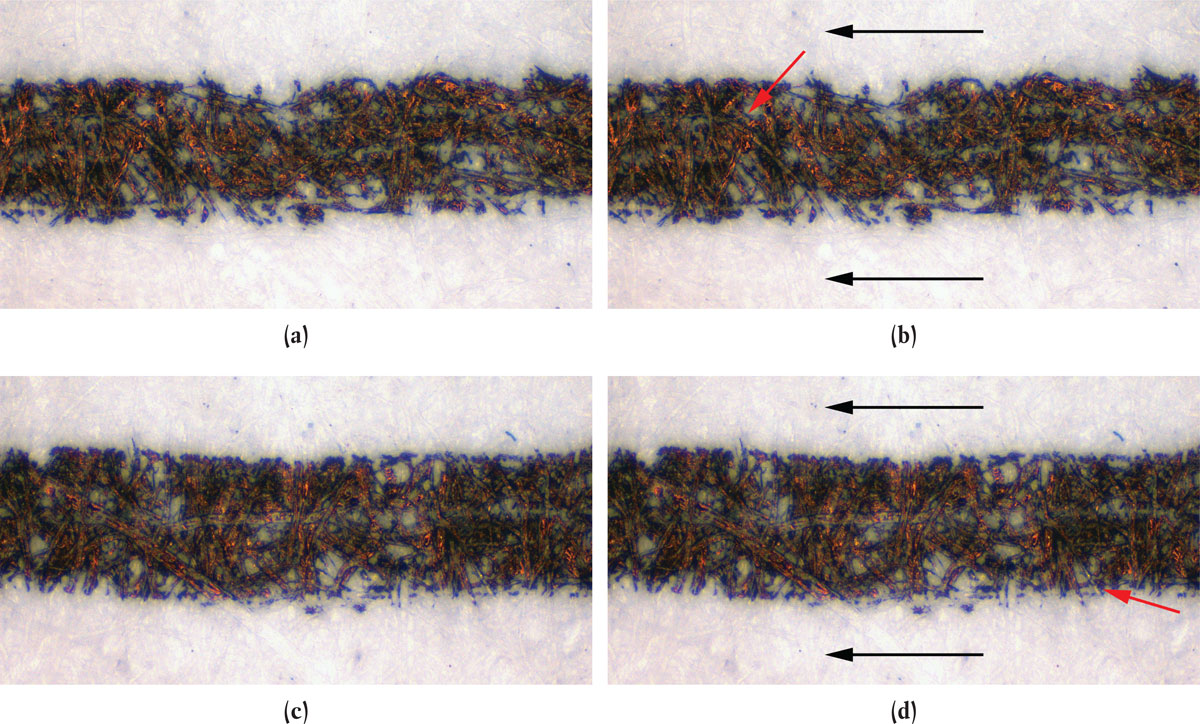
Figure 7
(a) Line extract from Pen 2; (b) same image as (a) with black arrows indicating line direction and red arrows indicating some fibres with preferential ink build-up; (c) Line extract from Pen 2; (d) same image as (c) with black arrows indicating line direction and red arrows indicating some fibres with preferential ink build-up.
The results show that the pen used to write the ink line has a significant effect on the ease in which examiners are able to determine the direction of the ink line. There is much greater ink coverage of the paper in the ink line with Pen 2 (Figure 7) than with Pen 1 (Figure 6), resulting in the paper fibres being “swamped” with ink with less preferential build-up discernible. This may account for the greater difficulty examiners had in making a direction determination with Pen 2 rather than Pen 1. The difference in ink coverage may be due to either (or both of) the construction of the pen or reduced viscosity of the ink of Pen 2 compared with that of Pen 1 (in either case allowing more ink to flow from Pen 2).
The lack of correlation between line length and examiner results shows that enough information was available to the examiner in the 5 mm lengths of ink lines and the additional information available in the 30 mm ink lines did not further assist.
Given that examiners have the ability to make determinations, it is conceivable that some image analysis protocol may allow a more objective determination of line directions. For example, image analysis to determine statistically the preponderance of dark lines (ink) in an image preferentially on one side of the white lines (paper fibres) in particular ranges of orientations may assist with such determinations. The use of the 3D-microscope may also assist. These are possible projects for the future.
Conclusions and Recommendations
Determinations of line directions from observations of ballpoint pen ink lines under the microscope and making note of the preferential build-up of ink on the upstream side of paper fibres has been shown to be a reliable technique, with an average percentage correct rate of called responses of 97.6%. There is a wide variety in confidence of examiners in making determinations as reflected by the large variation in the number of inconclusive and qualified results from examiner to examiner. To increase examiner confidence, it is suggested that higher magnification ranges (for example, greater than 100x) are used for more difficult determinations and such lines are examined in varying orientations to possibly become more comfortable with a particular direction determination. For those less familiar with the technique, microscope examination of ballpoint ink lines of known direction is strongly recommended as a familiarisation exercise.
Appendices
Appendix 1
Reduced size images of the instructions with the test sheet (A) and the corresponding answer sheet

Notes
[1] Presented at the 72nd Annual General Meeting of the American Society of Questioned Document Examiners held jointly with the Australasian Society of Forensic Document Examiners, Inc., Honolulu, Hawaii, August 11-15 2014 and at the 22nd International Symposium on the Forensic Sciences of the Australian and New Zealand Forensic Science Society, Adelaide, South Australia, August 31 to September 4 2014.
Acknowledgments
The authors wish to thank all the forensic document examiners who participated in the testing reported in this paper, Mr Geoff Masters of Canberra Institute of Technology for his input on the statistical analysis of the data and Michelle Novotny of Forensic Document Services for reviewing the contents of this paper.