
Introduction
Ink analysis forms a significant branch of forensic document examination. Ballpoint inks, especially blue and black colors1, are the most widespread and most encountered in forensic casework requiring this type of analysis (about 80%2). The aim of this investigation is mainly to determine if two or more ink entries in one document have been written with different types of ink3. Concluding the existence of a difference often entails serious legal and financial consequences.
Many ink analysis approaches have emerged and are now being broadly classified as: destructive, which minimally or completely damages the questioned document; or as non-destructive, that do not cause any damage to the document.
The routine examination of a questioned document begins with non-destructive methods, usually microscopic and optical4. Ink color, luminescence, and absorption of light can be studied using a variety of techniques5, 6 such as visible infrared absorption and luminescence 3, 7,8,9,10,11, infrared luminescence and reflectance spectroscopy12, 13, Raman spectroscopy10, 14,15,16,17 and microspectrophotometry5, 18. These optical techniques allow in situ analysis but their main disadvantage is that they do not provide information on the chemical composition of the ink. Thus, they are used for differentiation4 rather than identification. If detailed information about the ink entry such as compositional information is required, destructive methods which are typically chemical would follow. These necessitate the extraction of the ink from the substrate in order to be analysed4. The degree of damage varies from one method to another. The first and most widespread separation method used among document examiners, due to its simplicity and sensitivity, is thin layer chromatography19,20,21, 22. This method provides a high discrimination power but focuses only on dye analysis and causes local destruction to the questioned document, which is unsatisfactory from the legal point of view23.
Whereas the vast majority of ink analysis approaches, including TLC, concerns the comparative, qualitative analysis of dyes which make up about 50% of ink composition23, Fourier transform infrared (FTIR) spectrometry1, 16, a method of measuring IR absorption, reveals specific features of the samples molecular structure by analysing dyes and resins24. This advantage permitted the creation of searchable libraries. However, extraction of ink is needed to achieve adequate discrimination.
Mass spectroscopic methods - Laser desorption ionization25,26,27, field desorption28 and high performance liquid chromatography2, 29 were also proposed for ink analysis. These techniques do not only differentiate between inks but also investigate if two ink entries or more have come from the same common origin28 by analyzing other ink components such as solvents, providing a greater potential than TLC23. In addition to the destructive nature of these analyses, most of them are not readily available in an ordinary forensic document section.
The legal, scientific and individual concerns are demanding forensic examinations in general and questioned document in particular to adapt the approach of developing techniques that are non-destructive, rapid, objective and highly discriminating.
1.1. Ballpoint Pens: Ink Composition
The transfer from a single dye dissolved in an oilbased solvent to a mixture of dyes dissolved in a glycol-based solvent was the most important makeover in ballpoint ink formulation. These changes offered document examiners the chance of greater success in differentiating inks. The historical developments in ballpoint ink composition are explained in detail in the literature23, 24, 30.
Currently, ballpoint ink is typically comprised of a mixture of synthetic dyes dissolved in a vehicle that includes solvents, resins and oils23, 31, 32. Additional materials are added into the vehicle such as ball lubricants, elasticity modifiers and corrosion inhibitors to optimize the properties of the ink32. Table 1.1 shows the main components of ballpoint inks.
Table 1.1
Main Components of Ballpoint Inks.31
| Ink Component | Characteristics | Function | Examples |
|---|---|---|---|
| Colorant Material: Dyes | Typically synthetic Soluble in vehicle Could be acidic, basic or solvent | colorant material | Phthalocyanines30 Victory Blue32 Methyl violet Crystal violet |
| Vehicle: Solvents | Glycol-based27 | Flow and drying characteristics | Ethylene glycols23 Glycol ethers Benzyl alcohol |
| Resins | Natural or synthetic high molecular weight | Viscosity adjusters30 Surface active agents | Polyester resins Phenolic resins32 |
| Oils | Drying or nondrying or a combination | Oleic acid23 | |
| Additives Materials | Contain a variety of materials | Optimizing certain properties such as brittleness, stability, wetting and flexibility of ink | Solvents inorganic salts hydrocarbon waxes |
Ballpoint ink, overall, has distinguishable characteristics; it is typically paste, more viscous, thicker and contains more organic dyes than for example roller ball and gel inks31.
Ink composition differs from one manufacturer to another and between inks made by the same manufacturer. This forms the basis of ink analysis. The chemical composition of ink plays a role in terms of the response obtained when the ink is exposed to illumination. However, it is not well understood which of the ink’s component has the greater significance.
1.2. Composition of paper
Even though papers are generally composed of similar materials (e.g. matted fibers obtained from cotton, linen, sisal and pulp and other chemicals added to optimize properties such as fluorescence, gloss and smoothness)33, the composition and the concentration of these components differ.
Type of papers may interfere with the luminescence properties of inks24, 33, 34. Therefore, interpretation of infrared luminescence of entries on different substrates should be carried out with extreme caution. This interference is much diminished when comparing two ink entries made on the same substrate3. However, it is not eliminated since surface inhomogeneities exist3, 24.
1.3. Infrared Reflectance/Absorption
As illustrated in Figure 1.1, the object is illuminated by a floodlight that contains a high infrared component (400 – 1000 nm). The object transmits, absorbs, reflects and/or absorbs then re-emits the light (explained more in section 1.4.). Different inks theoretically respond differently; some reflect more light (are brighter) or at a different wavelength (are a different color). This response can be seen by the human eye if the reflected light falls within the visible spectrum.
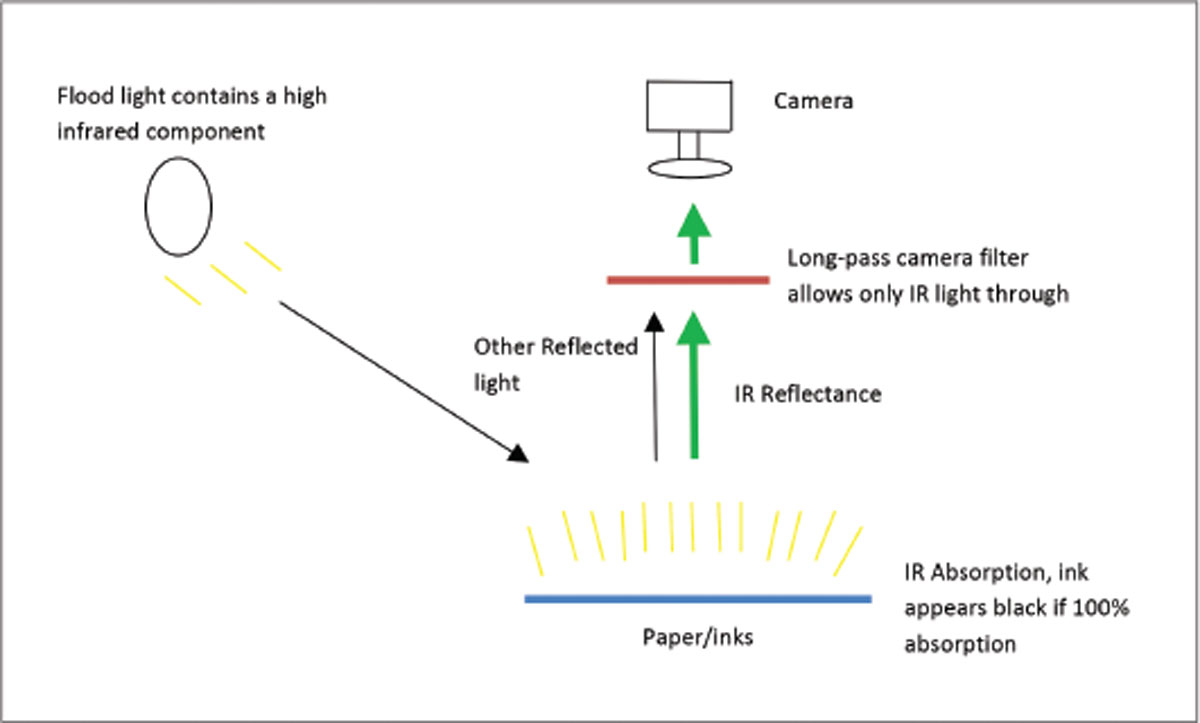
Figure 1.1.
Infrared Reflectance/absorbance.
However, the reflected light can extend into the infrared (IR) region since the illumination source has an infrared component. To visualize this reflected infrared light, a filter is used to block the transmission of visible light and only allow IR light to pass through to be recorded by an IR sensitive camera. This technique can be used to differentiate between inks that are indistinguishable to the naked eye6.
1.4. Infrared luminescence
Infrared luminescence has been an effective, rapid, direct, simple and non-destructive technique for differentiating inks that appear similar to the unaided eye35 since at least 19638. This phenomenon occurs when molecules of an object are irradiated by a source of light.3. They absorb energy from that source and re-emit it as light at longer wavelengths 3, 35.
As shown in Figure 1.2, to observe and record the property of infrared luminescence the object has to be radiated by an excitation beam. The emitted radiation produced from the interaction between the object and the excitation beam goes through a filter that only allows light in the infrared or far-red range to pass through to be recorded by an infrared-sensitive camera7. The differentiation is based on the different responses that inks show when they absorb and re-emit light. Some inks remit light strongly or at different wavelengths35 while some ink dyes do not have the property of infrared luminescence7. However, differentiating inks by visual comparison to determine the degree of luminescence poses several difficulties including the subjectivity of this analysis and impossibility of knowing the exact wavelength visually. For this reason, ink’s luminescence responses in this study will be based on their luminescence spectra obtained using the VSC6000 spectrometer rather than merely visually.
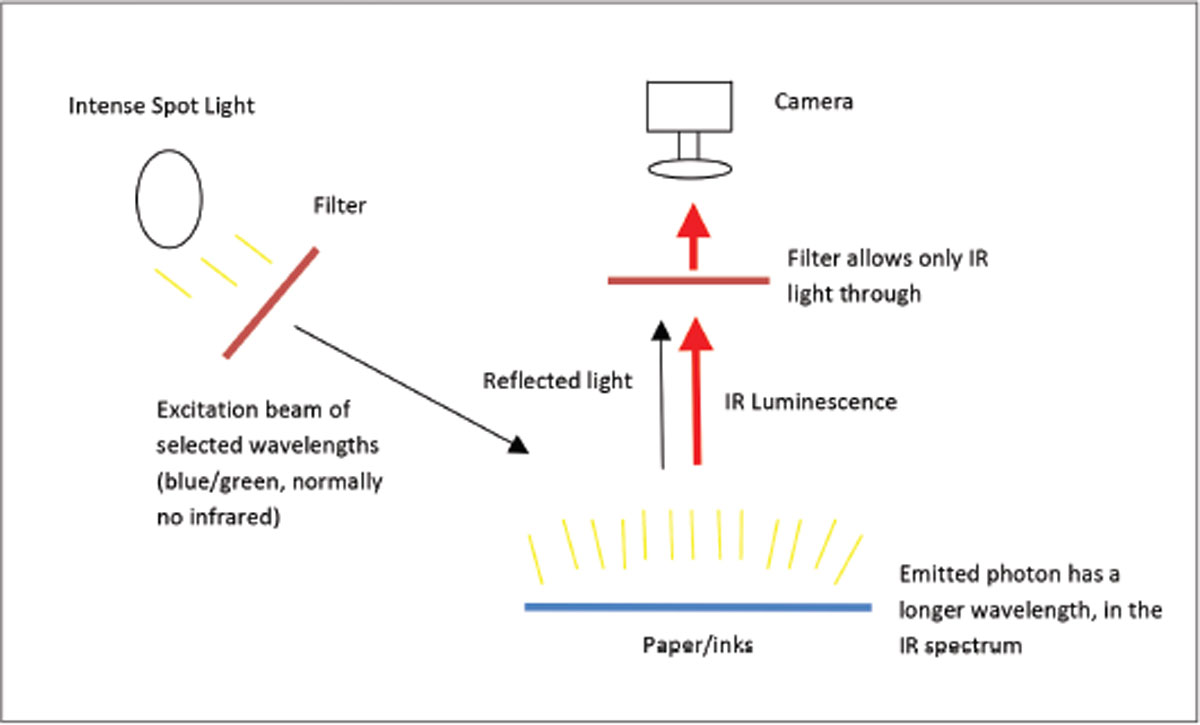
Figure 1.2.
Infrared Luminescence.
In addition, infrared luminescence cannot be considered in isolation of other methods to differentiate among inks8. A single ink contains components that are luminescent and components that are not. If an ink is not luminescing it may mean that its non-luminescent components are masking the luminescent components. Introducing a substance such as water, body lotion or milk could cause the non-luminescent components to diffuse allowing the luminescent components to become visible8.
1.5. VIS-IR Reflectance and VIS-IR Luminescence Spectroscopy
The subjectivity of the visual assessment of infrared reflectance and luminescence behavior has driven the need for methods that allow a more objective way of drawing conclusions. Spectroscopy, defined as “a technique for resolving electromagnetic radiation into its component wavelengths and measuring the radiation as it interacts with matter”24, allowed document examiners to base their findings on spectral analysis rather than on visual observations.
The VSC6000HS has an automated spectrometer that uses a video camera and bandpass filter to analyze the light originating from the object. Spectral analysis is then performed over the wavelength band 400 – 1000 nanometer38. The results are displayed as a spectral graph and chromaticity values.
The spectrometer facility of the VSC has been used in several studies6, 15, 24, 34, 39. Spectra obtained from a VSC2000 demonstrated repeatability and successful discriminations between different inks were made34. In another study that included roller-ball and ballpoint inks, the VSC2000 discriminated 98.24% of the black non-liquid inks and 90.90% of the blue non-liquid inks24.
Similar to most spectroscopic analysis, several factors affect the results of reflectance and luminescence spectroscopy. The age of the IR light source, the writing substrate and the variation between the “standard white tile” may influence the spectra34. In addition, contamination and weathering may cause non-luminescent inks to exhibit infrared luminescence and consequently interfere with the spectra3. These factors should be noted prior to performing any ink differentiation method, particularly surface analyses.
1.6. Aims and Objectives
The main objective of this project is to determine the discrimination power of the VSC6000HS in differentiating among ink lines made by blue and black ball point pens.
A study performed on the previous version of the VSC (VSC5000) have concluded that reflectance spectroscopy has no value in differentiating ink lines made by different pens.15
Foster + Freemen Limited implemented an integral grating-type spectrometer with the new version VSC6000HS36. Discrimination of inks, based on reflectance and luminescence spectroscopy, utilizing the new version has not been researched yet.
The project aims to:
Analyze blue and black ballpoint ink lines by non-destructive objective methods utilizing the latest version of the Video Spectral Comparator VSC6000HS
Determine the discriminating power of VSC6000HS reflectance and luminescence spectroscopy
Determine if the VSC6000HS spectrometer can differentiate between ink lines that appear similar by conventional methods (e.g. the visual assessment of reflectance and luminescence behavior)
Determine the effect differences in paper has on the results of the spectra obtained by the VSC6000HS
Experimental
2.1. Sample Collection
30 blue and 30 black ballpoint pens were collected from stationery stores around Wellington, New Zealand for the purpose of this project. Table 2.1 and 2.2 show the pen code given to each pen and description including brand name.
Table 2.1
Blue ballpoint pens used in the study.
| Pen Code | Description |
|---|---|
| bb1 | BIC ECOlutions Clic Stic Medium Blue BP |
| bb2 | Uni Power Tank Retract BP 1.0mm |
| bb3 | Papermate 4 Ball, Business RT BP 1mm |
| bb4 | BIC 4 Colour Ball Pen 1.0mm |
| bb5 | Papermate InkJoy 100RT 1.0 M |
| bb6 | Uni Laknock Ret BP 0.7mm Fine |
| bb7 | Pilot Supergrip Fine Blue |
| bb8 | Stabilo Liner 308 Ret BP Med |
| bb9 | BIC Cristal M |
| bb10 | Pilot Begreen 1.0mm |
| bb11 | BIC Yellow Barrel |
| bb12 | FBP Fashion Ballpens Display of 24 |
| bb13 | Pen Inspire Fashion Brights Asst Designs |
| bb14 | Uni Pen Power Tank Eco Blue Medium 1MM |
| bb15 | Stabilo liner 808 Fine |
| bb16 | Zebra Surari Emulsion 0.7mm |
| bb17 | Zebra Jim Knock ASST 0.7mm |
| bb18 | Impact retractable ASST 0.7mm |
| bb19 | Zebra Z-1 Cap 1.0mm |
| bb20 | Artline clix 4 1.0mm |
| bb21 | Artline Flow 1.0mm |
| bb22 | Staedtler 422 Click Ballpoint Pen |
| bb23 | Staedtler 432M Ballpoint TRI Pen BL |
| bb24 | RNZPC Training Services |
| bb25 | Bank of New Zealand |
| bb26 | Pentel BK 101M Superb G |
| bb27 | Kirk Motors |
| bb28 | Workplace New Zealand |
| bb29 | Mainzeal Interiors |
| bb30 | The Devon New Plymouth |
Table 2.2
Black ballpoint pens used in the study.
| Pen Code | Description |
|---|---|
| kb1 | Papermate InkJoy 700 RT 1.0 M |
| kb2 | Uni Power Tank 0.7 |
| kb3 | Papermate 4 Ball, Business RT BP 1mm |
| kb4 | BIC 4 Colour Ball Pen 1.0mm |
| kb5 | Papermate InkJoy 100RT 1.0 M |
| kb6 | Uni Laknock Ret BP 0.7mm Fine |
| kb7 | Pilot Super Grip M |
| kb8 | Stabilo Liner 308 Ret BP Med |
| kb9 | Papermate InkJoy 300 RT 1.0 M |
| kb10 | Pilot BPS-GP F |
| kb11 | BIC Click Med Gray Barrel |
| kb12 | Papermate FlexGrip Elite M |
| kb13 | Bic Wellington Parkroyal |
| kb14 | CENTRA Rally |
| kb15 | Stabilo liner 808 Fine |
| kb16 | Zebra Surari Emulsion 0.7mm |
| kb17 | Zebra Jim Knock ASST 0.7mm |
| kb18 | Impact retractable ASST 0.7mm |
| kb19 | Zebra Z-1 Cap 1.0mm |
| kb20 | Artline clix 4 1.0mm |
| kb21 | Thunder Bay Police Force |
| kb22 | Staedtler 422 Click |
| kb23 | Brink |
| kb24 | Securency International PTY LTD |
| kb25 | Bic Te Papa Our Place |
| kb26 | Pentel BK 101M Superb G |
| Kb27 | Dangerous Goods WTR |
| kb28 | Cleveland Indians TM |
| kb29 | US Postal Inspection service |
| kb30 | Cross |
Paper substrate study: A variety of papers, as shown in Table 2.3, were provided by New Zealand Police Document Examination Section. The purpose of this study was to determine the effect the paper substrate had on the reflectance and luminescence spectra obtained from VSC6000HS.
Table 2.3
Paper substrates used in the paper substrate study.
| Brand | Make | Description |
|---|---|---|
| EXP | Green 50R | 50% recycled A4 80 GSM white copy paper |
| Officemax | Multipurpose plus | 80 GSM A4 white copy paper |
| APRIL Fine Paper | Excellent copy paper | A4 80 GSM white |
| REFLEX | Ultra white carbon neutral | A4 80 GSM white |
| Staples | Staples A4 copy paper | A4 80 GSM white |
| Sapphire offset | A4 copy paper | A4 150 GSM white paper |
| Mondi | Color copy | A4 160 GSM white paper |
| Mataura | Copier paper | A4 80 GSM yellow paper |
| Mataura | Copier paper | A4 80 GSM blue paper |
| Mataura | Copier paper | A4 80 GSM pink paper |
| Mataura | Copier paper | A4 80 GSM green paper |
2.2. Sample Preparation
An ink line from each pen used in the study was drawn on a piece of white A4 80 GSM Staples photocopy paper. In order to reduce the effect of paper on the results obtained, all ink lines of the same color were drawn on the same sheet of paper that was divided into 30 sections by using a pencil and ruler. The blue ink lines were on one sheet of paper and the black ink lines were on another.
Paper substrate study—On each sheet of paper used in this study, an ink line was drawn from a blue ballpoint pen (bb3—Papermate 4 Ball, Business RT BP 1mm) and a black ball point pen (bk18—Impact retractable ASST 0.7mm).
2.3. Instrumentation
The Video Spectral Comparator VSC6000HS, Foster + Freeman Ltd., was used to study the luminescence behaviors and to obtain reflectance and luminescence spectra of all samples. The experiment was conducted in a dark room where the VSC was the only light source available.
2.3.1. Infrared Luminescence Settings
A black card was placed under the document that contained the ink lines. The full set of the excitation wavelengths (400 nm – 800 nm) was applied on ink lines. The default longpass camera filter automatically changed corresponding to the selected excitation wavelengths, as shown in Table 2.4. Integration time used was 500 milliseconds.
Table 2.4
Selected spot light filters used and the corresponding default cut-off wavelength (camera filter).
| Spot Light Filter Excitation Wavelengths (nm) | Camera Filter Default Cut-off Wavelength (nm) |
|---|---|
| 400-485, 400-535, 445-570, 485-590, 485-610 | 645 |
| 515-640 | 695 |
| 545-675 | 725 |
| 585-720, 605-730, 645-800 | 830 |
The infrared luminescence behavior of samples was visually examined and the results were recorded in an Excel spreadsheet. Responses were categorized as:
No luminescence,
Light luminescence, or
Strong luminescence.
2.3.2. Reflectance and Luminescence Spectra Acquisition Settings
The document was placed on the platen under the canopy; auto focused, magnified 29.96 times. The sample (ink line) was positioned in the centre of the crosshairs. Since a single ink line is not totally homogenous, 3 replicate measurements were taken from 5 different areas of the same ink line, producing a total of 15 spectra for each ink line. This allowed the variation within the same ink line to be obtained. The recorded spectra were then averaged and compared.
Spectral comparison criteria included spectrum’s overall pattern shape, number of peaks and wavelengths of peak maxima. Discriminating power was calculated independently for each applied method for each ink type.
Reflectance Spectra Acquisition
Reflectance Spectra were taken by using a tunable floodlight with an infrared component as an illumination source. Integration time was 300 milliseconds and brightness was 60%. A white reference tile, provided by manufacturer, was used to give a white reference (a calibration reference) 37. “The Tile provides a matt white surface with an essentially flat reflectance response to illumination within the visible/IR range of wavelengths (400 – 1000 nm) over which documents are usually examined”35. This calibration measurement was performed prior to obtaining spectra of each ink line.
Infrared Luminescence Spectra Acquisition
Luminescence spectra were obtained by selecting the narrowband spot lighting, spot light filter at 485 – 610 nm, camera filter at 645 nm. Spot diameter/intensity was set to minimum diameter/ maximum intensity, integration time 5 seconds and magnification of 29.96. A black reference was taken between each reading.
2.3.3. Discriminating Power (DP)
“The Discriminating Power (DP) of a series of attributes is defined as the probability that two distinct samples selected at random from the parent population would be discriminated in at least one attribute if the series of attributes were determined” 40. This concept was first described by Smalldon and Moffat40 and has been used in many ink differentiation studies4, 6, 19.
The following formula was used to calculate DP as follows:
where is the number of undifferentiated pairs of samples after comparison and is the total number of samples25,19. The result is expressed as a percentage.
Results and Discussion
3.1. Reproducibility Study of Reflectance and Luminescence Spectroscopy
A single ink line is not totally homogenous because the ink’s components are not evenly distributed across the ink line. This is mainly due to the skipping characteristic associated with ballpoint implements. Thus, it was essential to record the spectra from different areas of the ink line in order to acquire the intra-sample variations. 3 replicate spectra of 5 different areas within the same ink line were taken. This allowed the variation within the same ink line to be obtained.
Figure 3.1 shows 15 reflectance spectra of (bb9) and Figure 3.2 shows 15 luminescence spectra of (bb11) taken from 5 different areas – each area was scanned three times. These spectra were taken on two different days – three areas in one day and two areas on another.
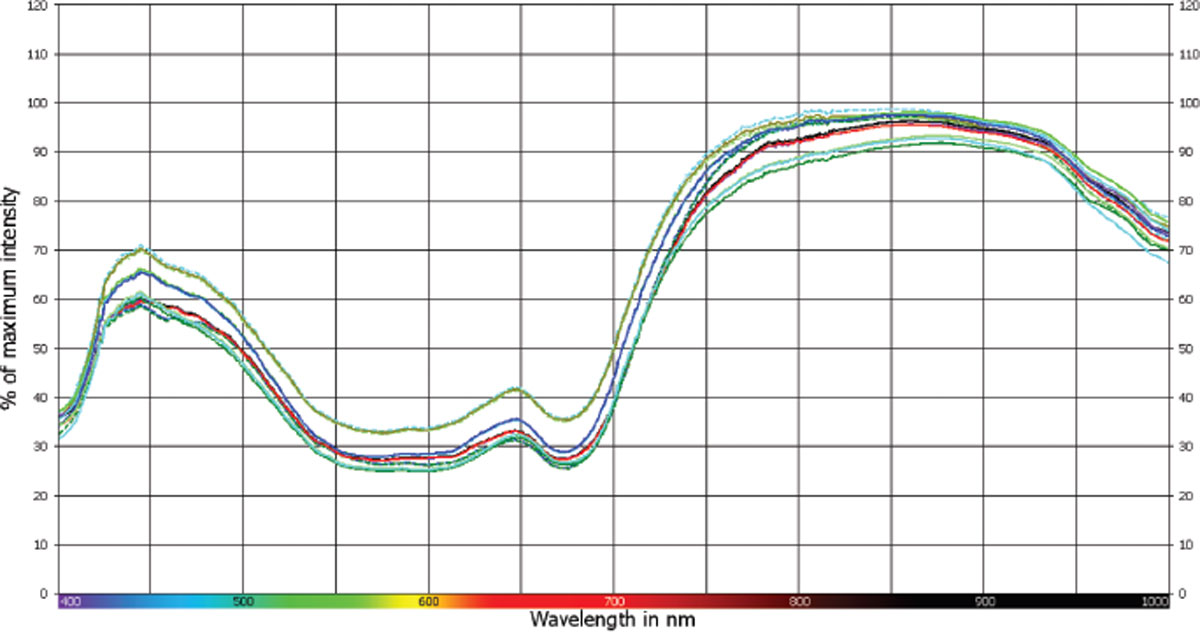
Figure 3.1
Triplicate reflectance spectra from 5 different areas of the same ink line (bb9).
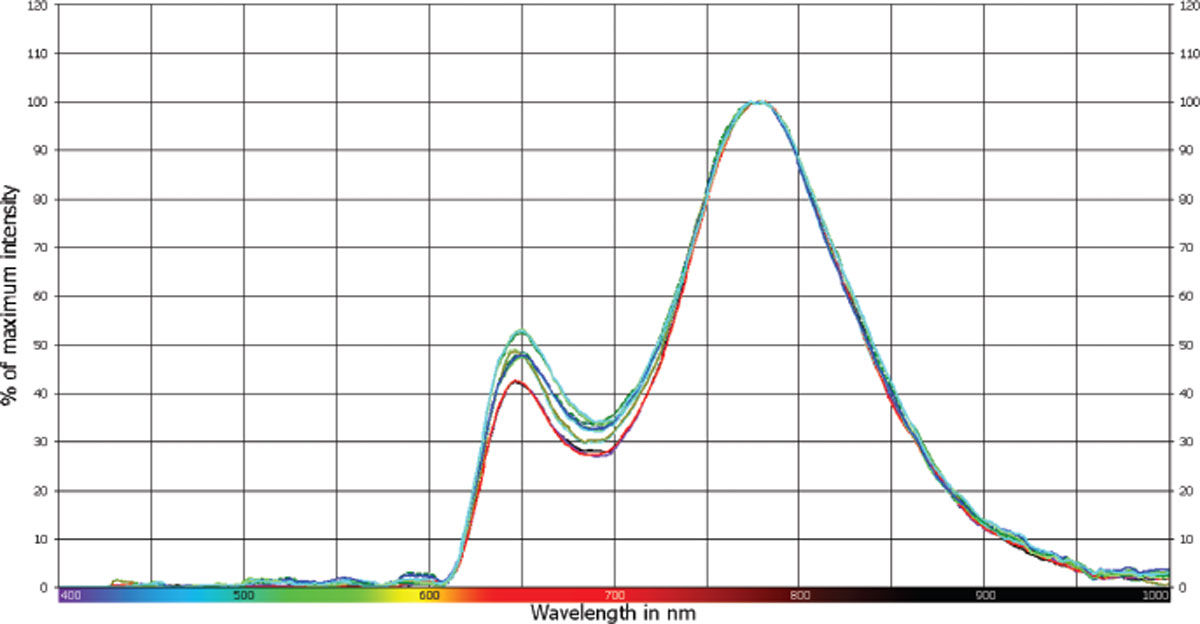
Figure 3.2
Triplicate infrared luminescence spectra from 5 different areas of the same ink line (bb11).
Analysis of these spectra demonstrated spectral reproducibility with minor variations. All spectra of the same ink line showed consistent pattern shape, number of peaks and wavelengths of peak maxima. Slight differences in intensities represent the variations within the ink line. Thus, signal intensity was not used as a central differentiation factor when comparing different inks.
3.2. Ink Differentiation Analysis
3.2.1. Ink lines of blue ballpoint pens
The Visual Assessment of the Luminescence Behavior
Based on their infrared luminescence behaviors exhibited across the full range of the excitation wavelengths, blue ink lines were divided into 4 groups as shown in Table 3.1. Within each group the individual pens were undistinguishable from each other by their infrared luminescence behavior.
Table 3.1
Groups of blue ballpoint pens based on the visual assessment of luminescence behavior.
| Group | Pen Code (bb) | Luminescence Behavior as the excitation wavelengths increase |
|---|---|---|
| 1 | 4, 6, 9, 12, 13, 17, 18, 19, 20, 28, 29 | No Luminescence across the full range of the excitation wavelengths |
| 2 | 1, 3, 5, 8, 15, 21, 22, 24, 27, 30 | Strong Luminescence across the full range of the excitation wavelengths |
| 3 | 23, 25, 26 | Light luminescence across the full range of the excitation wavelengths |
| 4 | 2, 7, 10, 11, 14, 16 | Luminescence gradually increased |
The 30 ink lines of blue ballpoint pens exhibited different responses as the excitation wavelengths increased. Group 1 ink lines had no luminescence across the full range of the excitation wavelengths. This was an initial indication that it would not be beneficial obtaining luminescence spectra for this group.
On the other hand, the inks in Groups 2, 3 and 4 all exhibited infrared luminescence. A uniform strong luminescence was recorded for Group 2. Group 3 ink lines exhibited light luminescence that was uniform across the full range of the excitation wavelengths.
Group 4 ink lines had a proportional relationship with the excitation wavelengths. They gradually increased their luminescence with the increase of the excitation wavelengths.
The comparison of inks’ luminescence behaviour is widely practiced and considered as a valid method of differentiating among inks7, 8. However, it should be approached with caution since a degree of subjectivity exists in this examination, and the luminescence response could be influenced by other factors3. Therefore, the above classification was not conclusive. The purpose of this visual classification was a preparation step for the subsequent spectral comparison of the ink lines. The results of this initial examination explained the overall infrared luminescence behaviour of each ink line and established the appropriate excitation wavelengths and camera filters for recording luminescence spectral profiles.
Spectral Comparison
The 30 blue ballpoint ink lines produce 435 possible pairs of compared samples. Based on their reflectance spectra alone, all except 52 pairs could be differentiated as shown in Figure 3.3. The luminescence spectra differentiated all except 100 pairs. Thus, with this sample of 30 pens, the discriminating power for the blue ballpoint pens by reflectance and luminescence spectroscopy was approximately 88% and 77% respectively.
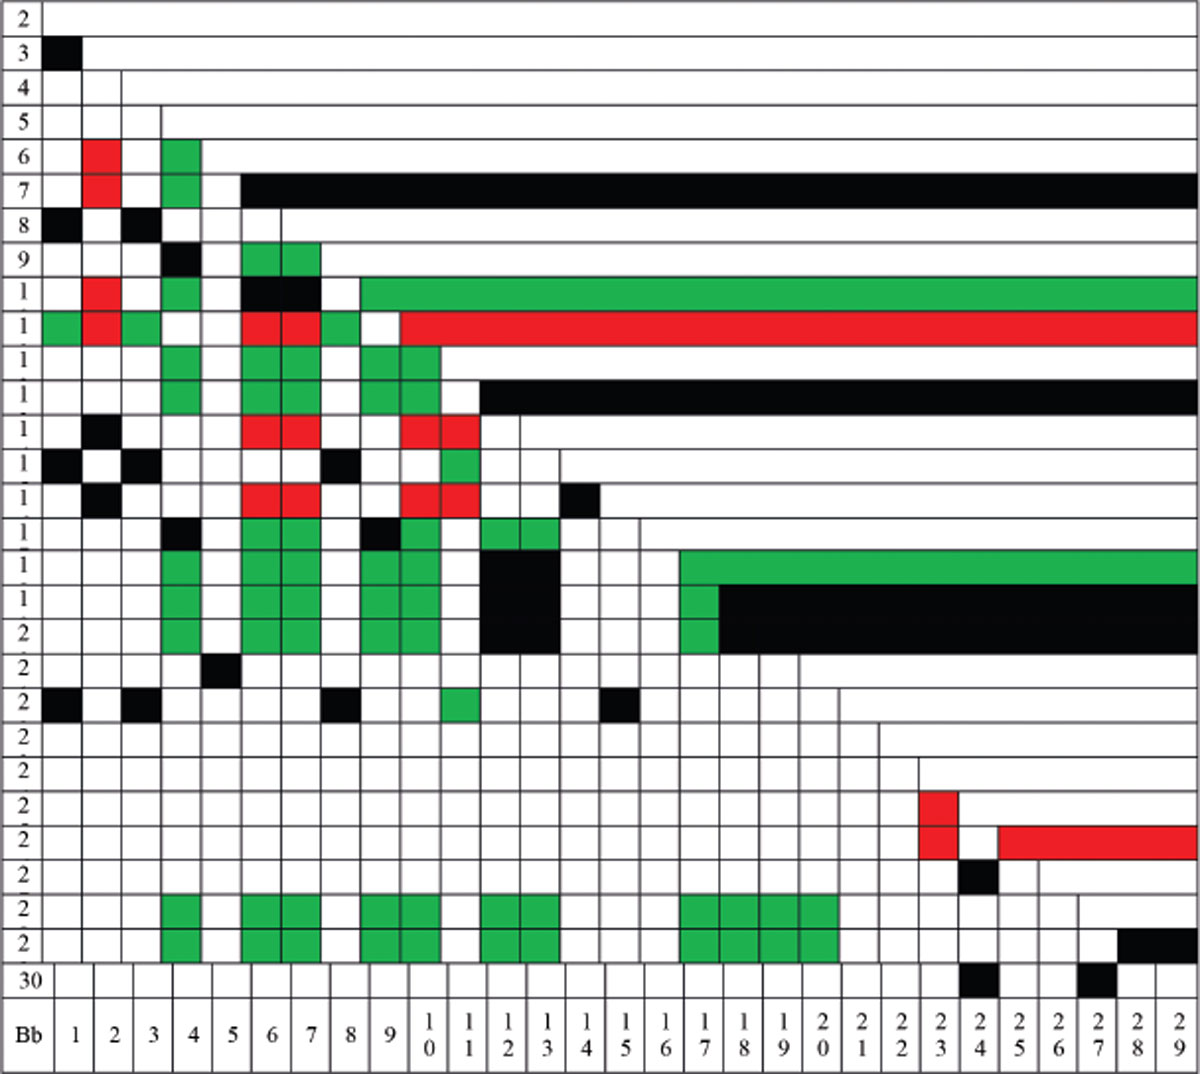
Figure 3.3
Differentiation of blue ballpoint by means of applied methods.
By combining the results of the two methods it was possible to differentiate another 18 pairs of inks, increasing the discriminating power to 92%. Table 3.2 demonstrates the final groupings of the blue ballpoint pens after applying both methods.
Table 3.2
Groups of blue ballpoint pens based on VSC6000HS reflectance and luminescence spectroscopy.
| Group | Pen Code (bb) |
|---|---|
| 1 | 1, 3, 8, 15, 22 |
| 2 | 4, 9, 17 |
| 3 | 6, 7, 10 |
| 4 | 2, 14, 16 |
| 5 | 11 |
| 6 | 23 |
| 7 | 25 |
| 8 | 26 |
| 9 | 5, 21 |
| 10 | 24, 27, 30 |
| 11 | 28, 29 |
| 12 | 12, 13, 18, 19, 20 |
Figure 3.4 is a clear example of pairs that were undistinguishable by reflectance spectroscopy. It shows the spectra of bb1, 3, 8, and 15. These ink lines that were made by different pens demonstrated a similar spectral shape, number of peaks and wavelengths of peak maxima. Slight differences in signal intensities were expected within the same ink line as illustrated in the reproducibility study. Thus, they should not be weighed as significant differences that differentiate ink lines. These spectra were undistinguishable from each other.
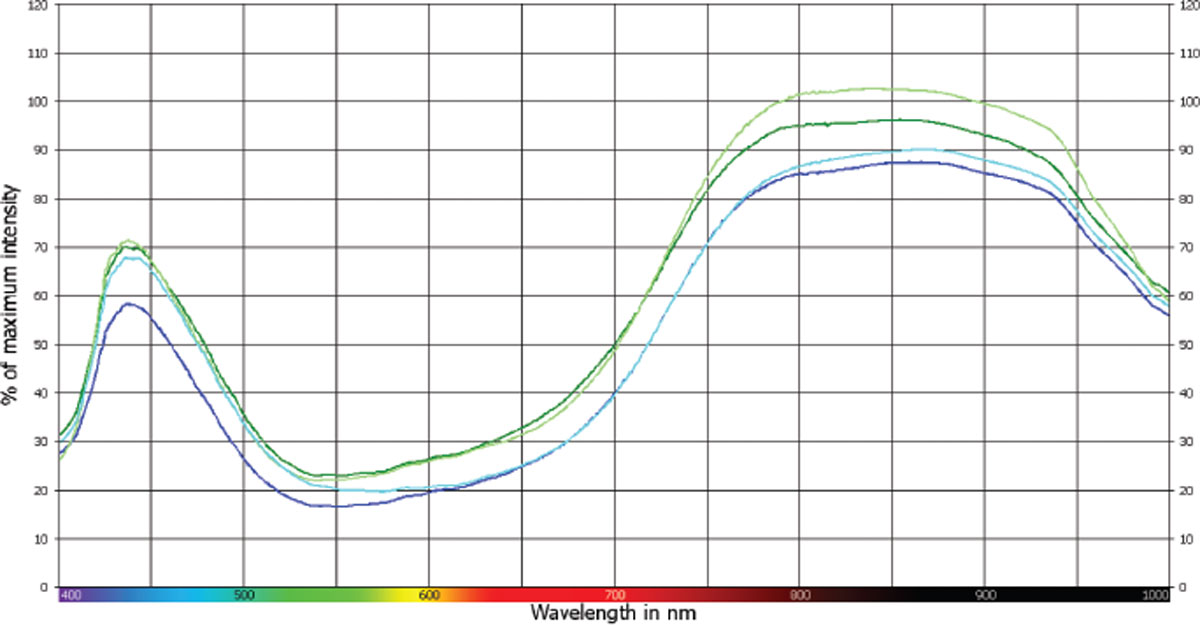
Figure 3.4
Reflectance spectra of bb1, 3, 8 and 15 (examples of undistinguishable pairs).
On the other hand, bb2, 5 and 9 demonstrated different responses in reflected light, as can be seen from their spectra in Figure 3.5. Bb9’s spectrum had 3 peaks whereas bb2 and 5 had only two. In addition, they are significantly different in reflected light within the infrared region of the spectrum. Therefore, these ink lines were distinguishable from each other. This is an example showing pairs that were distinguishable by reflectance spectroscopy.
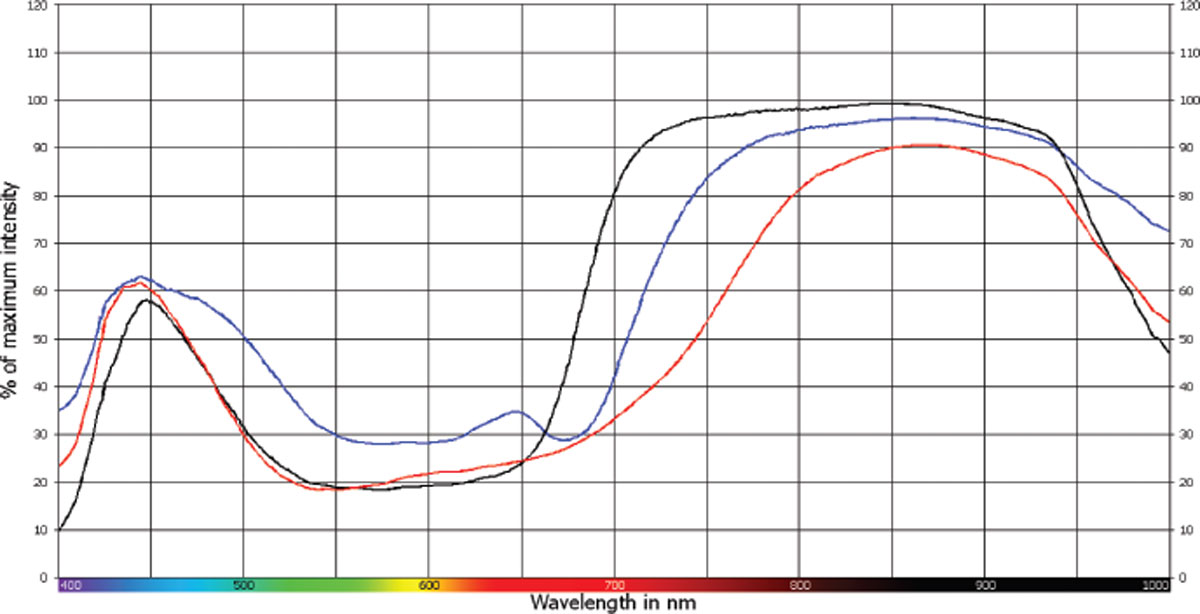
Figure 3.5
Reflectance spectra of bb2, 5 and 9 (an example of distinguishable pairs).
These ink lines also had different infrared luminescence behaviors and so could be distinguished by infrared luminescence. Reflectance spectroscopy, however, provided a more objective, and still relatively simple way of clearly demonstrating the differences between these ink lines.
Reflectance spectroscopy also succeeded in discriminating some ink lines that had no luminescence and accordingly could not be discriminated by infrared luminescence. For example, bb6 and 9 were not differentiated by infrared luminescence, but were discriminated by reflectance spectra as shown in Figure 3.6. Therefore, the VSC6000HS reflectance spectroscopy provided an additional powerful tool in discriminating inks when the conventional method – infrared luminescence – was useless.
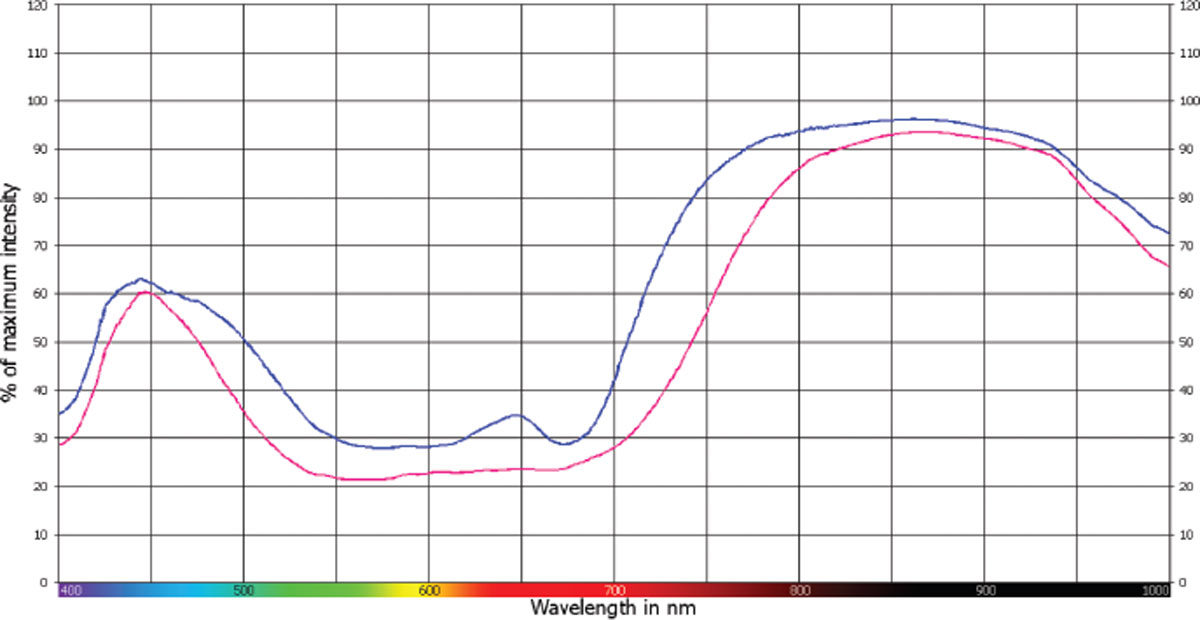
Figure 3.6
Reflectance spectra of bb6 and 9—ink lines that had no luminescence but were discriminated by reflectance spectroscopy.
Figure 3.7 shows luminescence spectra of two ink lines made by 2 different pens (bb24 and 27). They exhibited similar spectral pattern with one peak at the same wavelength. This is an example demonstrating a lack of differentiation of ink lines using luminescence spectroscopy. This resemblance does not confirm that the two inks have come from the same source, just that they cannot be differentiated at this level of analysis.
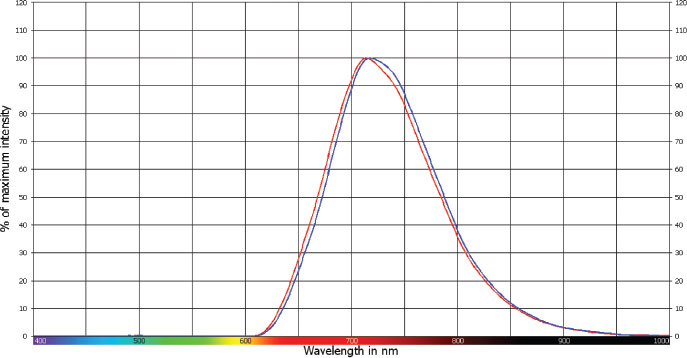
Figure 3.7
Luminescence spectra of bb24 and 27 (an example of undistinguishable pairs).
Figure 3.8 shows luminescence spectra of bb14, 21 and 26. These ink lines all visually showed a strong luminescence across the full range of the excitation wavelengths. Accordingly they were undistinguishable by infrared luminescence. Luminescence spectroscopy, however, discriminated these ink lines. Differences in the number of peaks, spectral shape and wavelengths of peak maxima were significant differences that did not only differentiate these ink lines, but also provided an objective way of measuring luminescence and easily illustrating these differences.
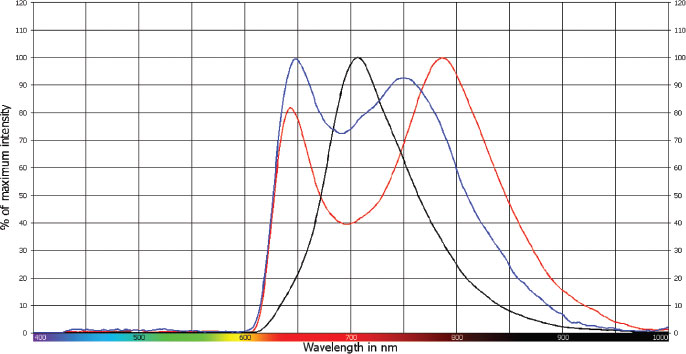
Figure 3.8
Luminescence spectra of bb14, 21 and 26 (an example of distinguishable pairs).
3.2.2. Ink lines of black ballpoint pens
The Visual Assessment of Luminescence Behavior
Similar to the blue ink lines’ results, black ink lines showed variable infrared luminescence behaviors as the excitation wavelengths increased. Table 3.3 shows the different groupings of the black ink lines based their luminescence behavior. Within each of Groups 1, 2, 3, and 4 the ink lines produced consistent responses with the increase of the spot light filter. In Group 5, however, the ink lines exhibited irregular luminescence behaviors. For example, some of these ink lines produced light luminescence with short excitation wavelengths. Then, they suddenly luminesced strongly when excited with mid-range wavelengths. However, they started to lose luminescence with longer excitation wavelengths. Therefore, their relationship with the excitation wavelengths was not fully understood.
Table 3.3
Groups of black ballpoint pens based on luminescence Behavior.
| Group | Pen Code (kb) | Luminescence Behavior as the excitation wavelengths increase |
|---|---|---|
| 1 | 2, 3, 6, 7, 10, 17, 21, 29, 30 | No Luminescence across the full range of the excitation wavelengths |
| 2 | 11, 14, 18, 20 | Strong Luminescence across the full range of the excitation wavelengths |
| 3 | 26 | Light luminescence across the full range of the excitation wavelengths |
| 4 | 13, 19, 22, 23, 24, 28 | Luminescence gradually increases |
| 5 | 1, 4, 5, 8, 9, 12, 15, 16, 25, 27 | Irregular luminescence behavior as the wavelength increases |
Excitation wavelengths within the mid-range of the VSC6000HS settings produced the most variant infrared luminescence of ink lines. There fore, these groupings have established that these excitation wavelengths were suitable to be used for obtaining luminescence spectra.
Spectral Comparison
The 30 black ballpoint ink lines produce 435 possible pairs of compared samples. Based on their reflectance spectra alone, all except 54 pairs could be differentiated as shown in Figure 3.9. The luminescence spectra differentiated all except 72 pairs. Thus, with this sample of 30 pens, the discriminating power for the black ballpoint pens by reflectance and luminescence spectroscopy was approximately 88% and 83% respectively.
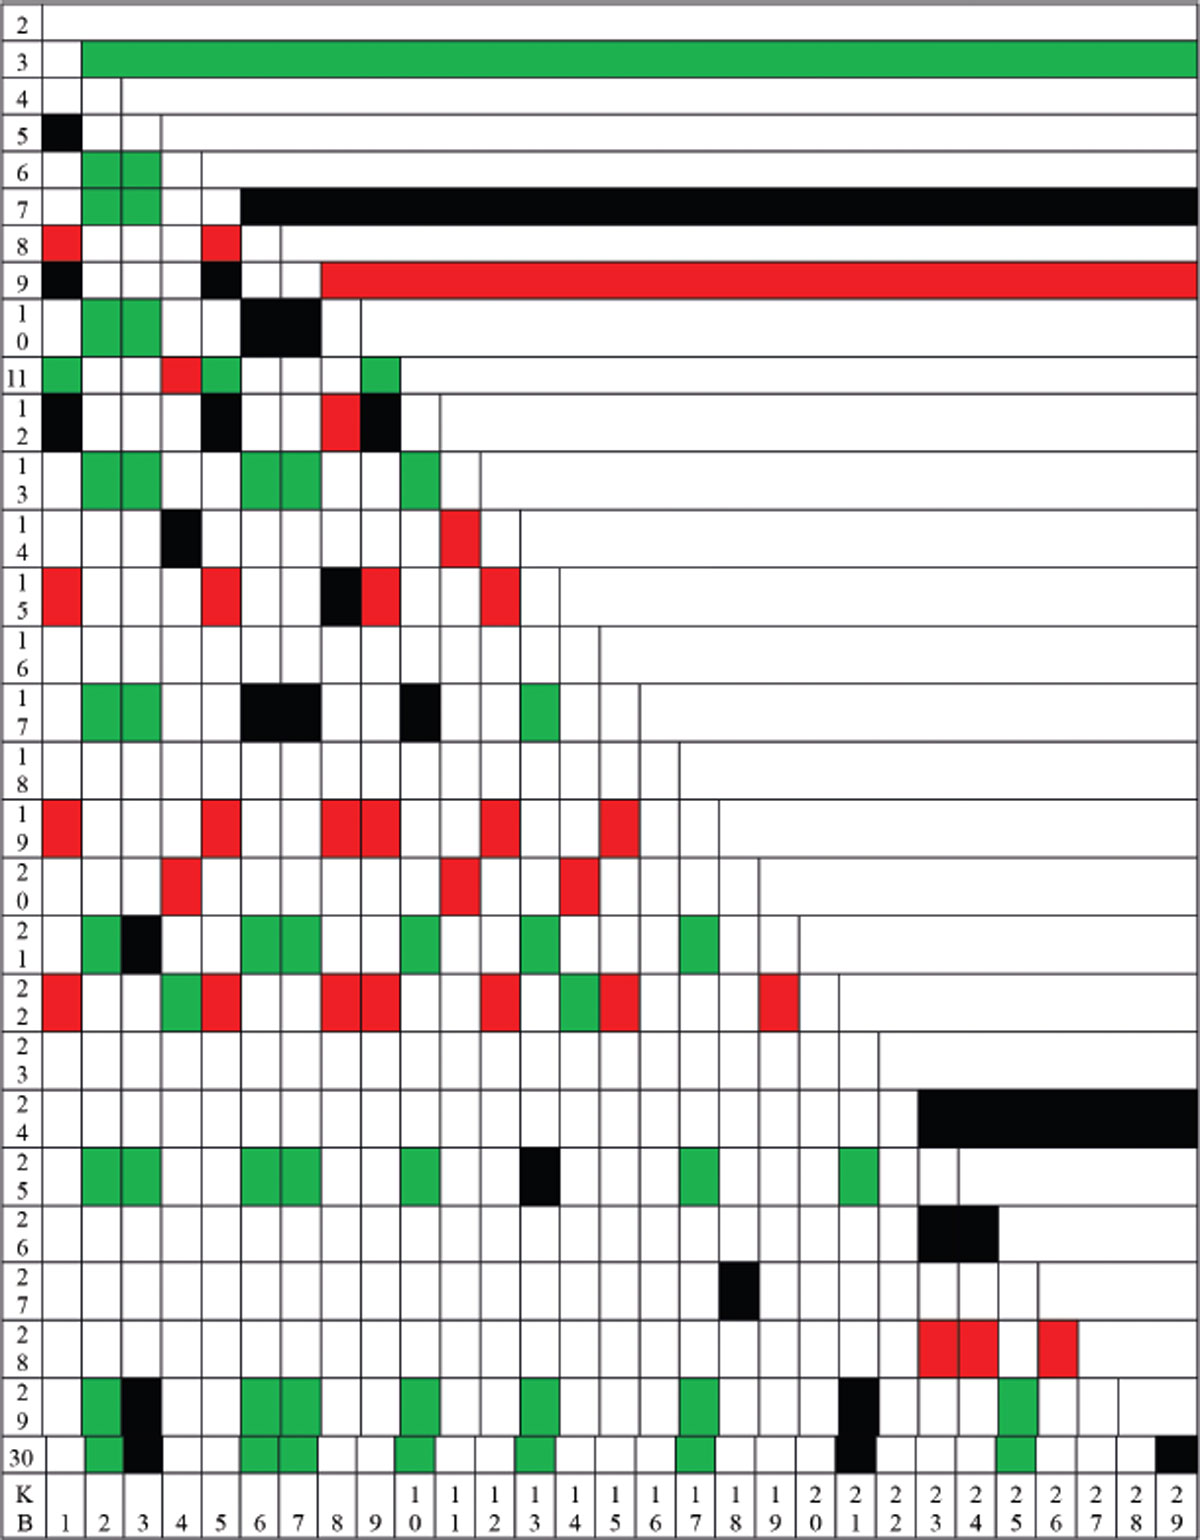
Figure 3.9
Differentiation of black ballpoint by means of applied methods.
By combining the results of the two methods it was possible to differentiate another 29 pairs of inks, increasing the discriminating power to approximately 94%. Table 3.4 demonstrates the final groupings of black ballpoint pens after applying both methods.
Table 3.4
Groups of black ballpoint pens based on VSC6000HS reflectance and luminescence spectrometry.
| Group | Pen Code (kb) |
|---|---|
| 1 | 3, 21, 29, 30 |
| 2 | 2 |
| 3 | 13, 25 |
| 4 | 1, 5, 9, 12 |
| 5 | 8, 15 |
| 6 | 19 |
| 7 | 22 |
| 8 | 6, 7, 10, 17 |
| 9 | 11 |
| 10 | 4, 14 |
| 11 | 20 |
| 12 | 18, 27 |
| 13 | 23, 24, 26 |
| 14 | 28 |
| 15 | 16 |
Figure 3.10 shows the reflectance spectra of kb21, 29 and 30. These spectra have similar pattern shapes indicating that they demonstrated similar responses in reflecting light. This is a clear example of pairs that are undistinguishable by VIS-IR reflectance spectroscopy. The differences in signal intensities are found even within the same ink line. Thus, they are not counted as differentiating differences.
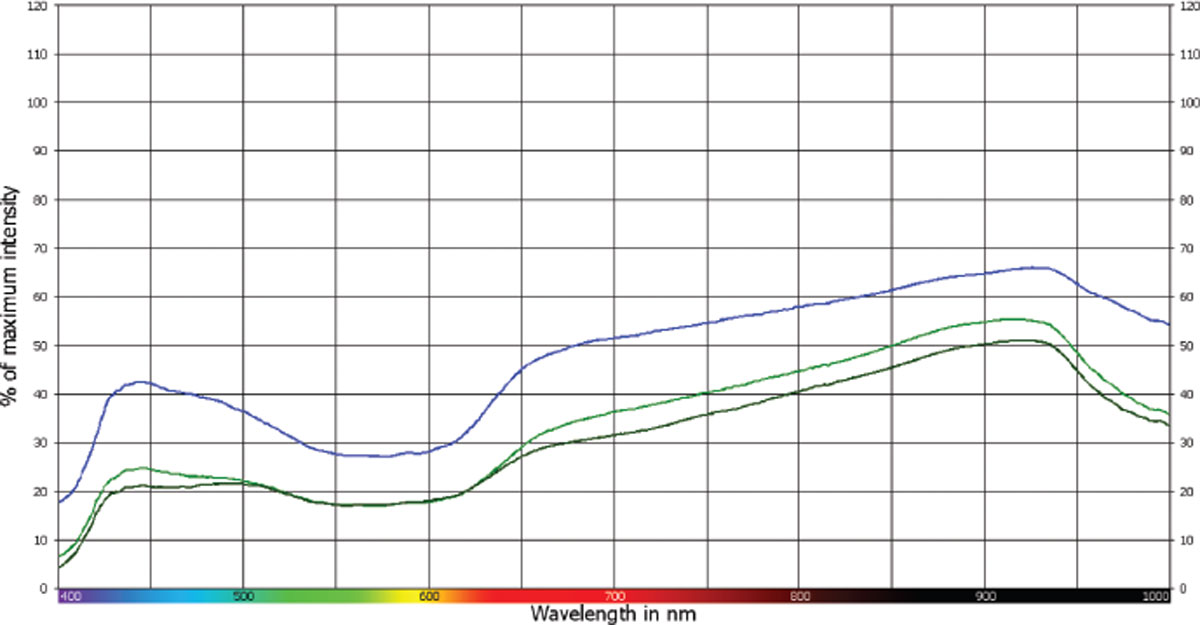
Figure 3.10
Reflectance spectra of kb21, 29 and 30 (an example of undistinguishable pairs).
On the other hand, the ink lines of kb2, 3 and 6 exhibited different spectral pattern shape, as can be seen from their spectra in Figure 3.11. Therefore, they were easily discriminated. This is an example of distinguishable pairs.
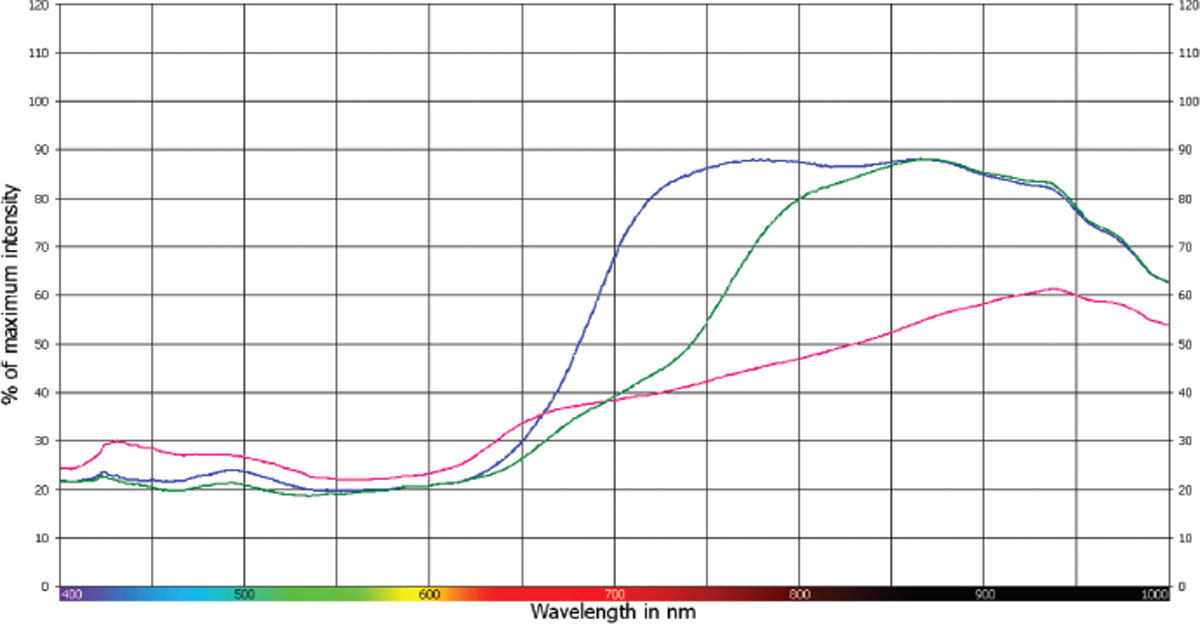
Figure 3.11
Reflectance spectra of kb2, 3 and 6 (an example of distinguishable pairs).
It is noteworthy to mention that these ink lines did not produce infrared luminescence and so were undistinguishable from each other using that technique.
Figure 3.12 shows the spectra of three different ink lines. This is an example showing a lack of differentiation of ink lines by luminescence spectroscopy on the VSC6000HS. These ink lines have a similar spectral pattern, wavelength of peak maxima and number of peaks. This similarity means that these ink lines produced similar luminescence at that excitation wavelength, though they are known to be from different pens. For this reason, among others, this methodology cannot be used for identification.
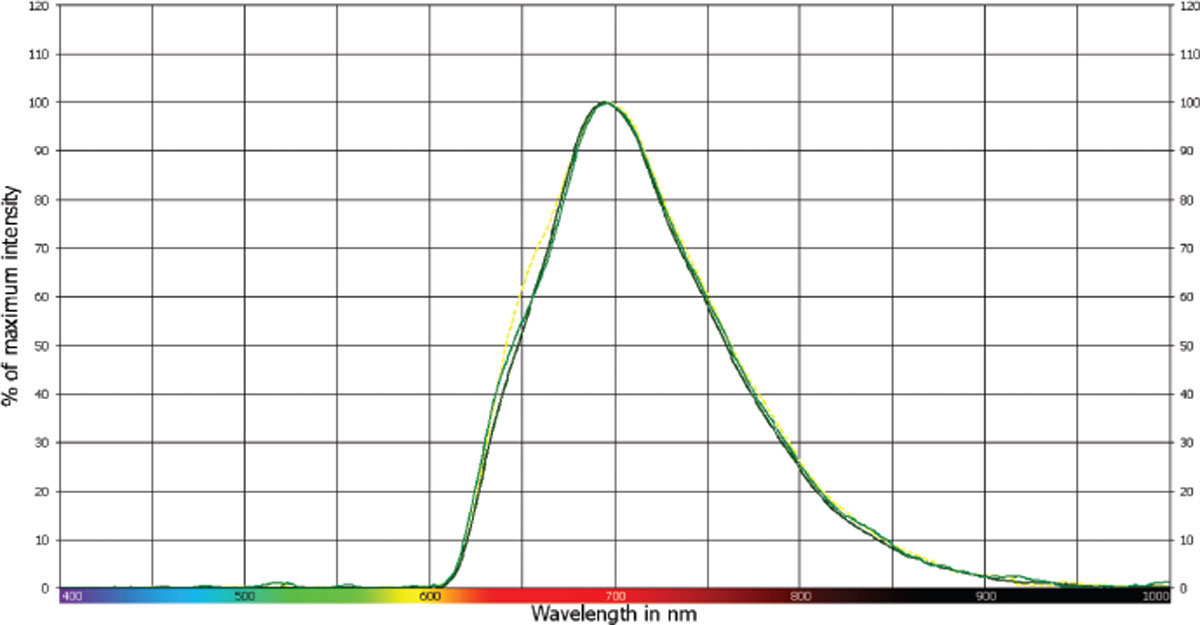
Figure 3.12
Luminescence spectra of kb4, 14 and 22 (an example of undistinguishable pairs).
The luminescence spectra of kb11 and 18 are shown in Figure 3.13. These ink lines produced strong luminescence and were undistinguishable from each other using infrared luminescence. However, luminescence spectroscopy succeeded in discriminating them. Furthermore, it offered a more objective and reliable way of demonstrating the differences. This is a clear example distinguishable pairs.
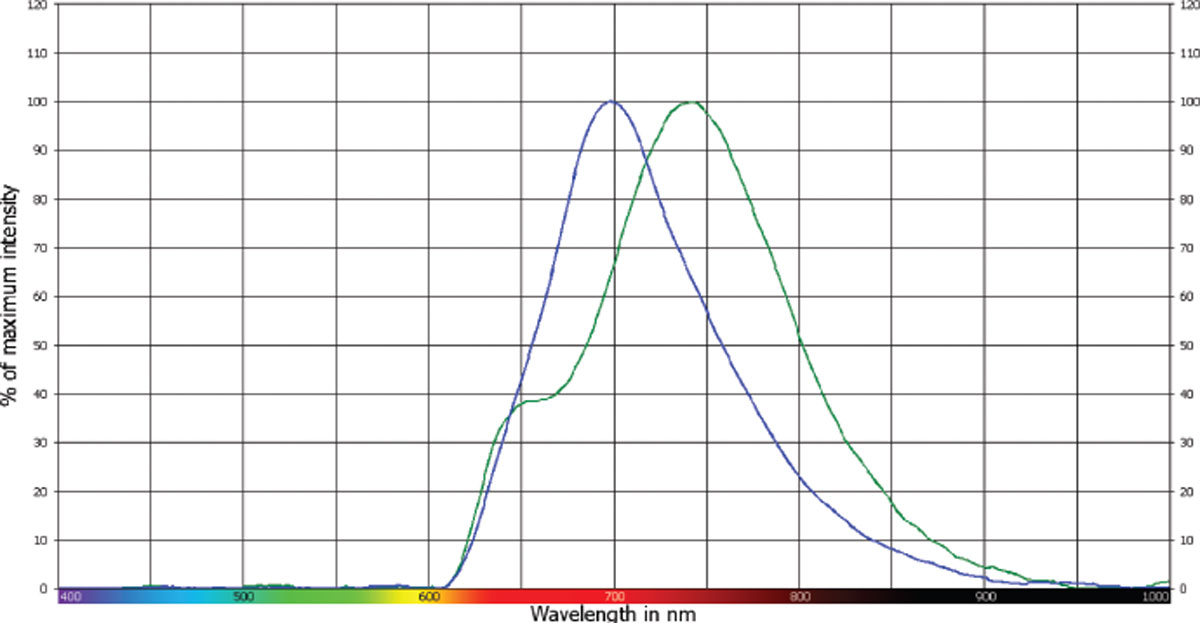
Figure 3.13
Luminescence spectra of kb11 and 18 (an example of distinguishable pairs).
3.3. Blind Trial
The VSC did not come with a statistical package for spectral data analysis. The equipment is designed for visual, on-screen comparison of spectra. In the absence of a statistical analysis, a blind study was undertaken to validate the qualitative comparison method.
A blind trial was constructed to test the repeatability of the claimed discrimination for blue ballpoint pens using blinded samples. A subset of 12 pens was selected from the original 30 pens. This comprised pens from 10 of the original 12 discriminated groupings as shown in Table 3.2, with an additional pen from each of the two larger groups.
Twenty ink line samples were generated for examination. These comprised one sample from each of the twelve pens, plus an additional eight duplicate samples made by randomly reselecting from the twelve pens. This resulted in three samples from one pen, twelve samples which were pairs from six different pens and five individual samples from five pens. These were randomly distributed on a grid and submitted to the author for comparison.
The twenty ink samples were examined and grouped using the same methodology as before. This resulted in the same 10 groupings that had originally been made, including the duplicate samples being correctly associated.
3.5. Paper substrate study
The paper substrate study was conducted to determine the effect the paper substrate had on the reflectance and luminescence spectra obtained from the VSC6000HS.
3.5.1. Paper substrate effect on VIS-IR reflectance spectra
Blue ink line
No significant differences were found between the reflectance spectra of the blue ink lines (using bb3) that were drawn on each of the different white paper substrates used in this study. Agreements in overall spectral pattern shape, wavelengths of peak maxima and number of peaks made these spectra undistinguishable from each other. The slight differences of signal intensities were expected to be found even within the same ink line on a single substrate.
Accordingly, the white paper substrates did not affect the reflectance spectroscopy’s results. The ink lines from the same pen (bb3) on the different white paper substrates used in this study demonstrated similar reflectance spectra.
Figure 3.14 is an example showing the similarity of the blue ink spectra on two different white papers. Based on these results, comparing blue ink entries on different white paper substrates using reflectance spectroscopy is satisfactory as a method of differentiation. The method, similar to other optical methods, should not be used as an identification technique since a number of variables prevent achieving that.
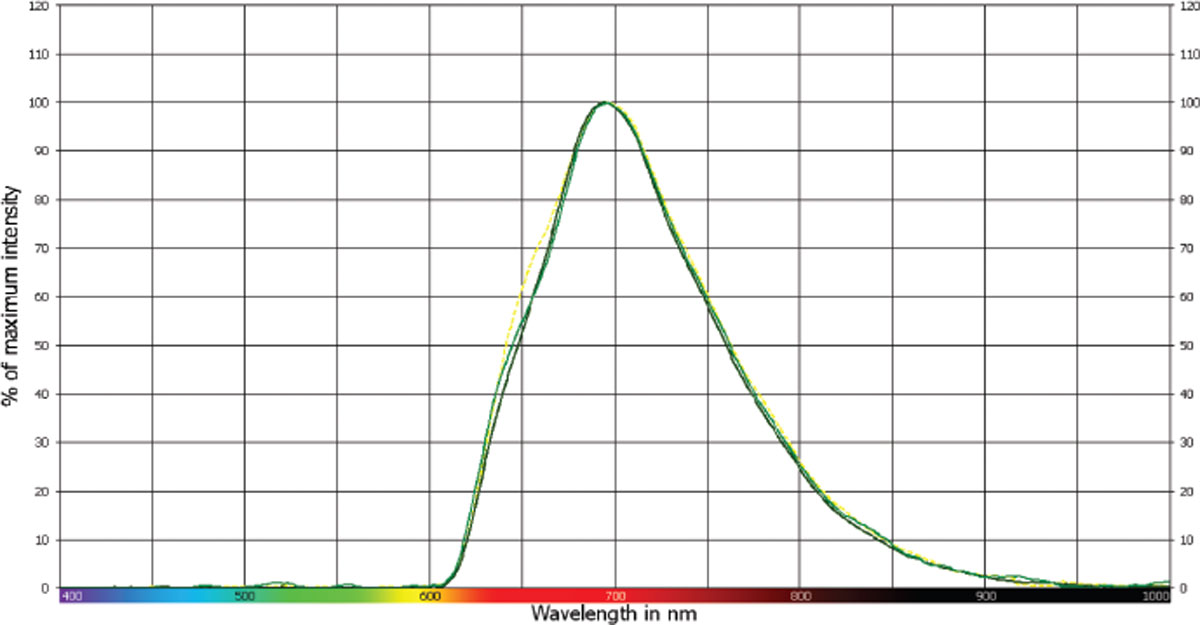
Figure 3.14
Reflectance spectra of a blue ink on two different white paper substrates (Mondi and EXP Green).
The spectra of the blue ink lines on the colored papers had variable results. The pink and blue papers had similar results to those obtained from the white paper substrates. However, the yellow and green papers had different responses within the visible region of the spectrum.
Figure 3.15 shows reflectance spectra of the blue ink on a white paper substrate and a blue paper substrate. The ink lines on these two different colored substrates behaved similarly in terms of reflecting light. Both spectra have similar overall spectral pattern shape, number of peaks and wavelengths of peak maxima. Therefore, they would not be differentiated from each other.
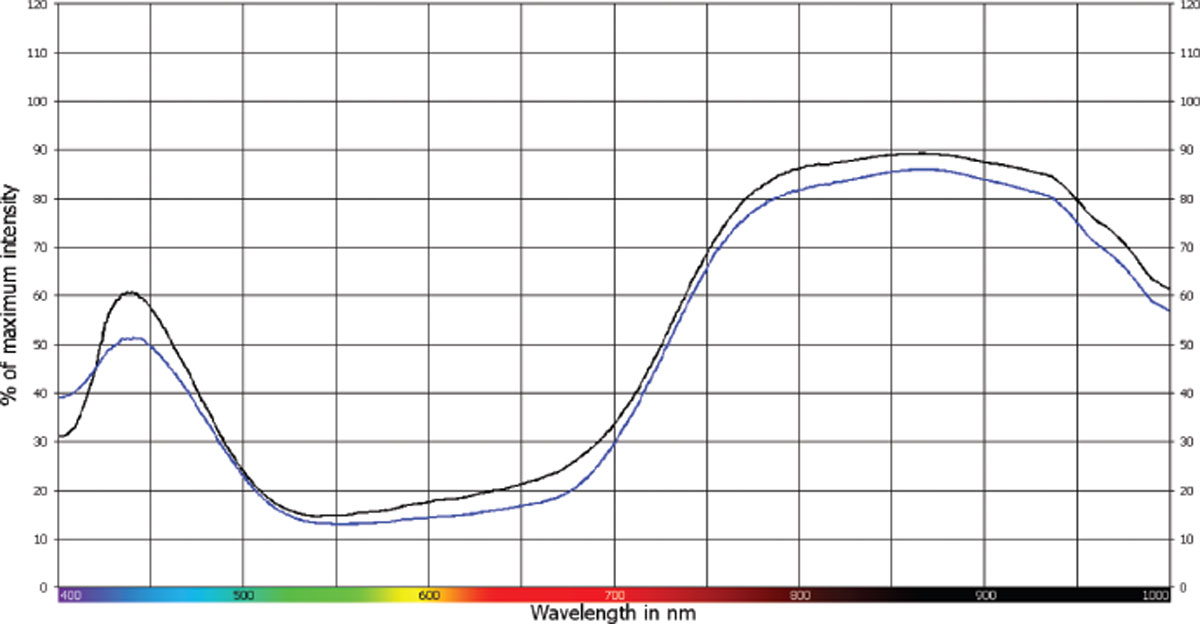
Figure 3.15
Reflectance spectra of the blue ink on a white paper substrate (black line) and a blue paper substrate (blue line).
The yellow and green paper substrates on the other hand, showed different spectral appearances in comparison to the spectra taken from the other substrates (e.g. white, blue and pink), as demonstrated in Figure 3.16. Even though they all have a similar response in reflecting light in the infrared region, the green and yellow substrates showed spectral differences within the blue region of the visible spectrum. The blue ink lines drawn from the same pen on these two colored substrates seemed to absorb more light rather than reflect in that region, resulting in diminishing the first peak. This could lead to an incorrect differentiation.
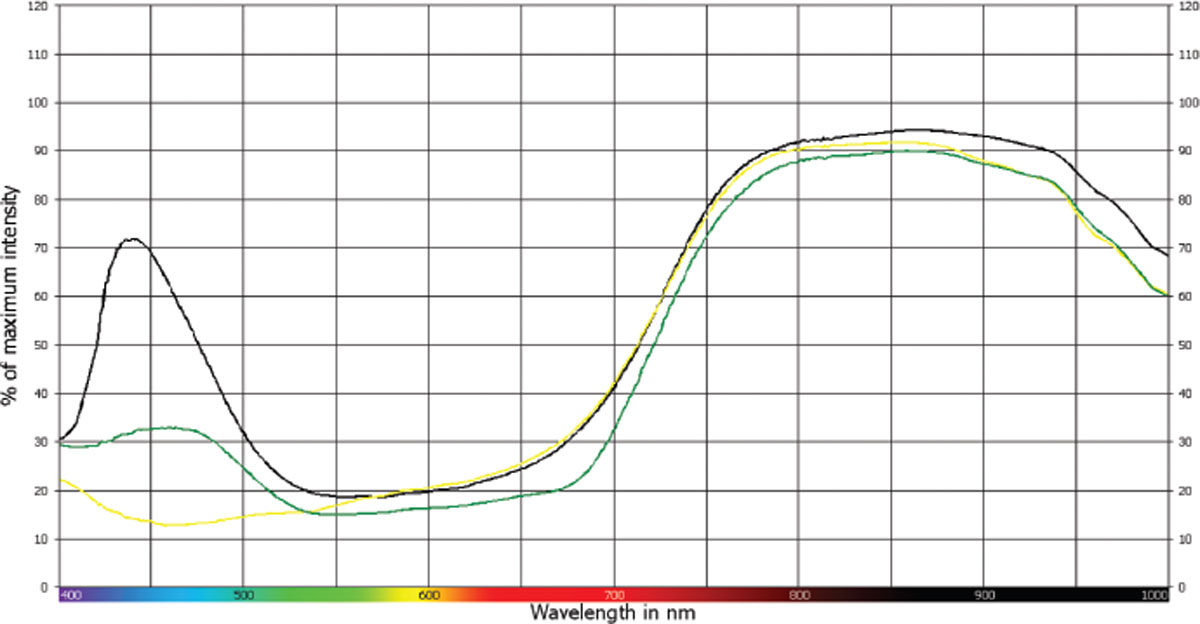
Figure 3.16
Reflectance spectra of the blue ink on a white paper substrate (black line), a yellow paper substrate (yellow line) and a green paper substrate (green).
Black ink line
Spectra of the black ink lines (using kb18) drawn on all of the white paper substrates demonstrated similar reflectance spectra. Figure 3.17 shows the reflectance spectra of the black ink on 3 different white paper substrates. These spectra from different papers are undistinguishable from each other due to the similarity in comparison criteria e.g. pattern shape and wavelength of peak maxima. Accordingly, the white paper substrates did not affect the reflectance spectroscopy’s results.
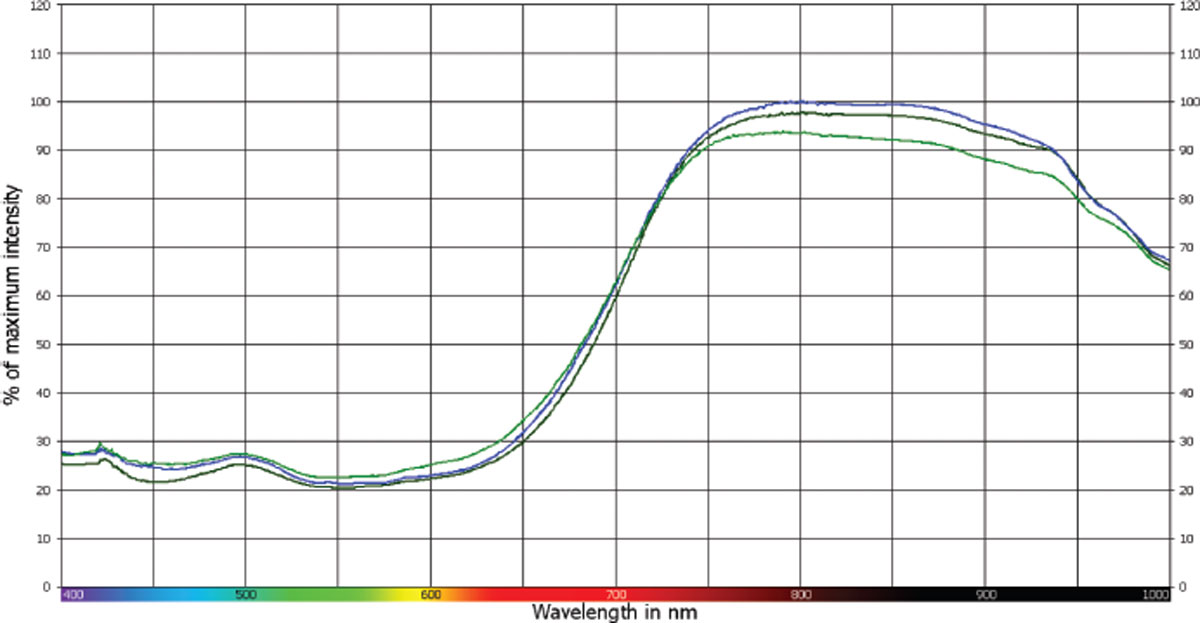
Figure 3.17
Reflectance spectra of the black ink on 3 different white paper substrates.
The black ink lines drawn on all of the colored papers, apart from the yellow paper, showed spectra similar to the white papers’ results. They were undistinguishable from each other. The yellow paper substrate, however, had a different spectral appearance in the visible region as shown in Figure 3.18. The ink line absorbed more light, resulting in diminishing the small peaks as can be seen from the white substrate’s spectra. Even though the ink line came from the same pen, the reflectance spectra had differences due to the paper substrate used.
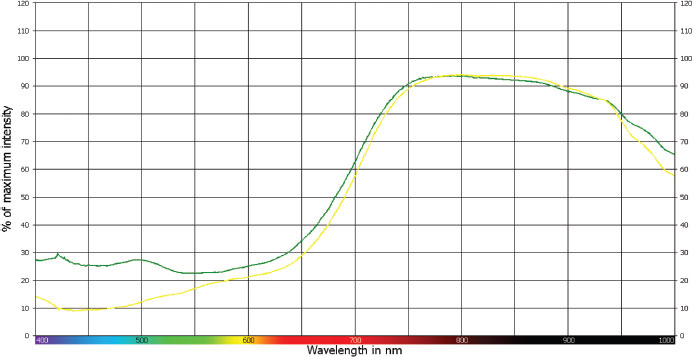
Figure 3.18
Reflectance spectra of the black ink on a white paper substrate (green line) and a yellow paper substrate (yellow line).
3.5.2. Paper substrate effect on VIS-IR luminescence spectra
Blue ink line
The blue ink lines on all the white substrates except “EXP Green – the 50% recycled paper” exhibited similar spectra. As can be seen from Figure 3.19, these spectra are undistinguishable from each other.
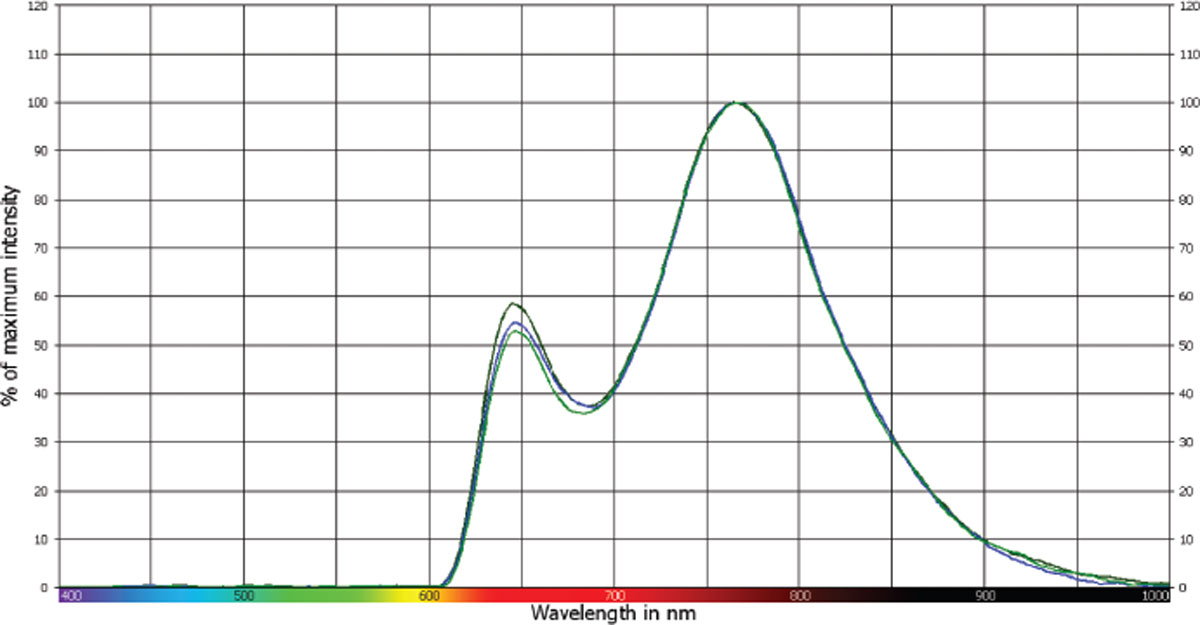
Figure 3.19
Luminescence spectra of the blue ink on 3 different white paper substrates.
The luminescence spectra of the ink line on “EXP Green” paper had peak maxima at different wavelengths compared to the rest of the white paper substrates as shown in Figure 3.20. This paper was the only paper that is 50% recycled. When examined using visual infrared luminescence, strongly luminescing inclusions were noted in the paper, possibly from the mixture of recycled materials.
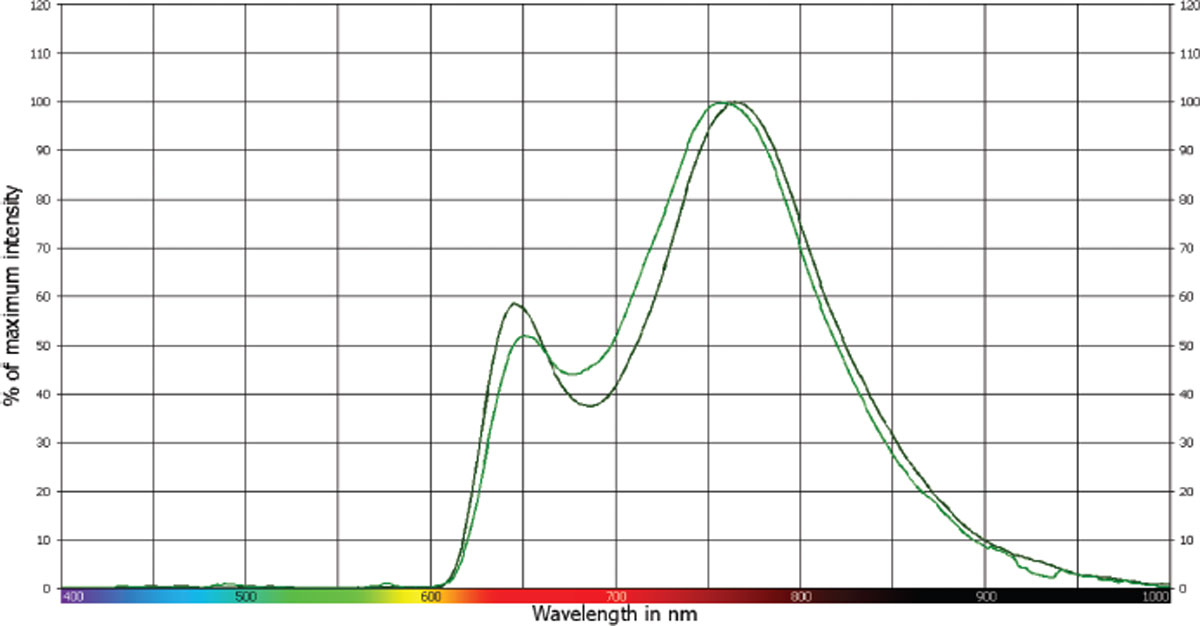
Figure 3.20
Luminescence spectra of the blue ink on “Staples” white paper substrate (black line) and “EXP Green” white paper substrate (green line).
Even though the ink was the same, the luminescence spectra obtained were different. An incorrect differentiation could be made based on these differences. The luminescence spectra of the blue ink lines drawn on the colored papers exhibited differences in wavelength of peak maxima and signal intensity. Figure 3.21 shows an example of the luminescence spectra of the blue ink on a yellow paper substrate in comparison to a white paper substrate. These spectra have significant differences that make them distinguishable from each other. Therefore, the color of the paper influenced the luminescence spectra. Comparing ink entries on different colored substrates using luminescence spectroscopy was found not to be useful.
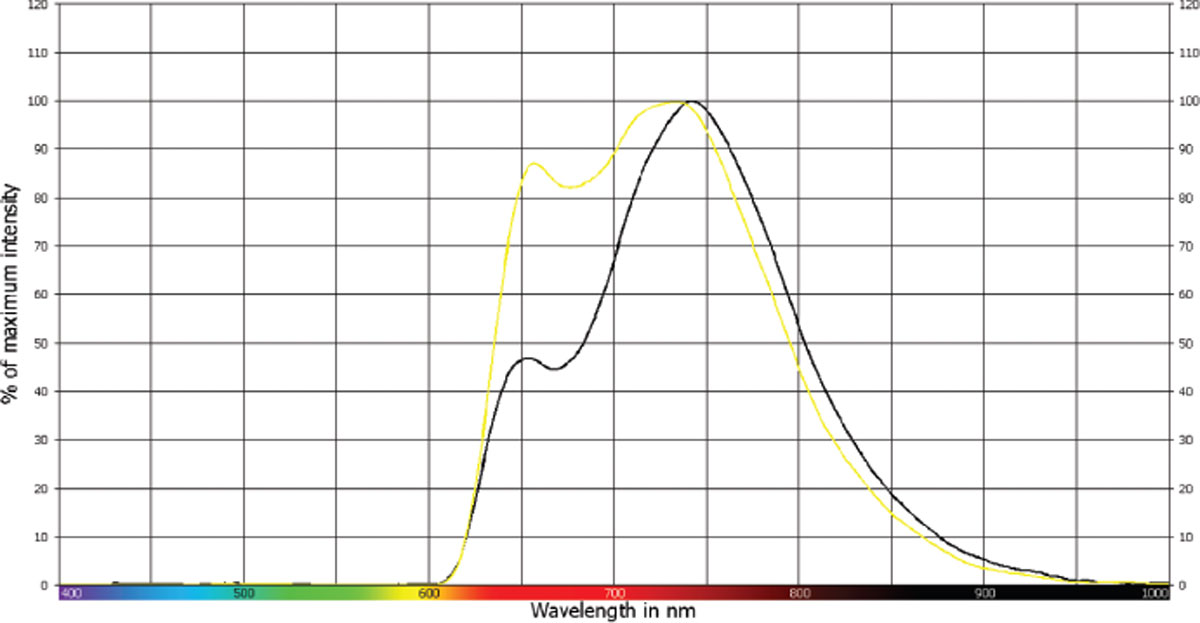
Figure 3.21
Luminescence spectra of the blue ink on a white paper substrate (black line) and a yellow paper substrate (yellow line).
Black ink line
No significant differences were found between the luminescence spectra of the black ink on all of the white paper substrates as shown in Figure 3.22.
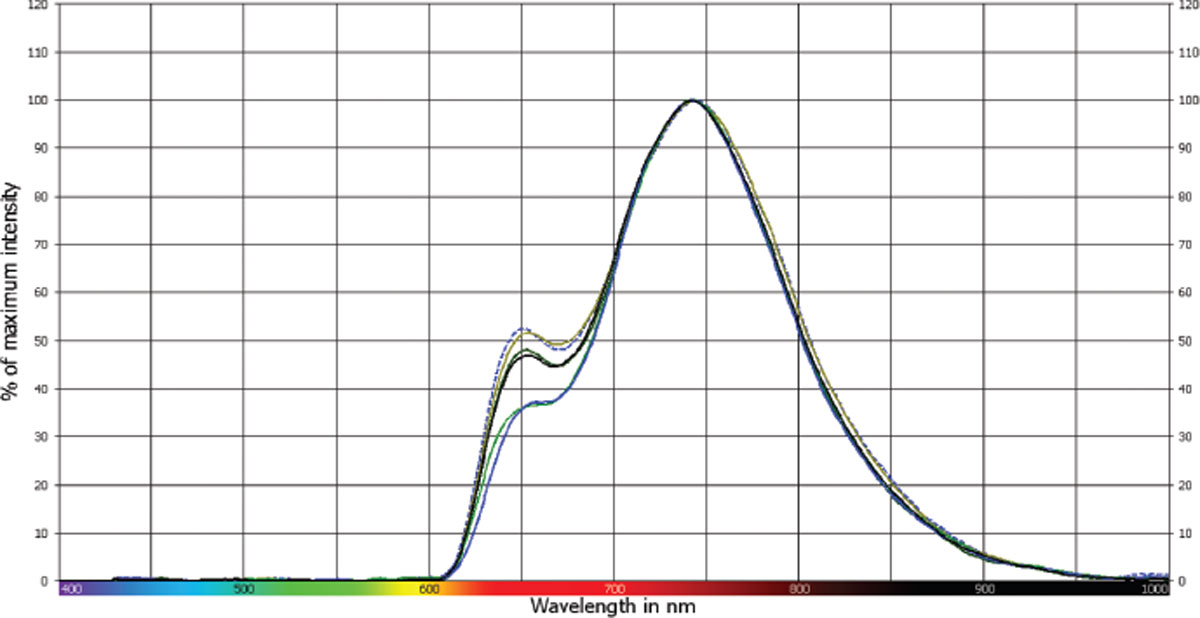
Figure 3.22
Luminescence spectra of the black ink on 6 different white paper substrates.
The luminescence spectra of the black ink lines drawn on all the colored papers also exhibited differences. As shown in Figure 3.23, the luminescence spectra of the black ink on a yellow paper substrate has significant differences compared to the spectra from a white paper substrate. These spectra are distinguishable from each other. Thus, it is not possible to compare an ink entry on white paper with an entry on a colored paper using this method.
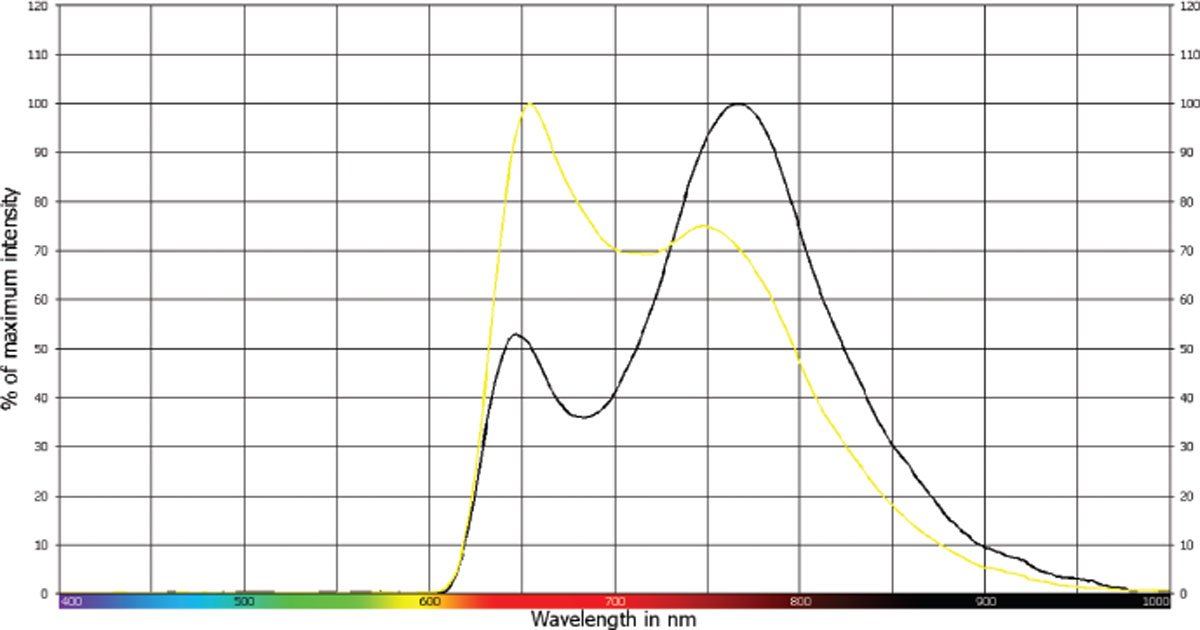
Figure 3.23
Luminescence spectra of the black ink on a white paper substrate (black line) and a yellow paper substrate (yellow line).
Table 3.7 summarizes the results of the paper substrate study whose aim was to determine if the paper type would have an influence on the reflectance and luminescence spectra obtained by the VSC6000HS spectrometer facility.
Table 3.7
A summary of the paper substrate study’s results. Did the paper type affect the spectra obtained in comparison to a standard white “Staples” A4 paper?
| Paper type | Reflectance spectra | Luminescence spectra | ||
|---|---|---|---|---|
| Blue ink line | Blue ink line | Blue ink line | Blue ink line | |
| EXP (50% recycled) | No | No | Yes | No |
| Officemax | No | No | No | No |
| APRIL Fine Paper | No | No | No | No |
| REFLEX | No | No | No | No |
| Staples | No | No | No | No |
| Sapphire offset | No | No | No | No |
| Mondi | No | No | No | No |
| Mataura (blue) | No | No | Yes | Yes |
| Mataura (pink) | No | No | Yes | Yes |
| Mataura (green) | Yes | No | Yes | Yes |
| Mataura (yellow) | Yes | Yes | Yes | Yes |
“Yes” indicates that the resultant spectra looked different than the spectra obtained from a standard white “Staples” A4 paper and that accordingly the paper substrate has affected the resultant spectra. “No” means the spectra were similar and accordingly the paper did not affect the spectra obtained.
Conclusions
The main aim of this project was to determine the discrimination power of VSC6000HS visibleinfrared reflectance and infrared luminescence spectroscopy in differentiating ink lines made by blue and black ballpoint pens. Assessing the efficiency of the VSC6000’s spectrometer in comparison to the VSC5000 and determining the effect paper types has on the spectra obtained by the VSC6000HS were also objectives of the project.
Reflectance and luminescence spectra of ink lines made by 30 blue and 30 black ballpoint pens were obtained and compared against each other.
Table 4.1 summarizes the discriminating power of each methodology applied for each type of ballpoint pens. Reflectance spectroscopy was found to be slightly more discriminating than luminescence spectroscopy for both types of pens. Combining the two methods gave further discrimination of ink lines.
Table 4.1
Discriminating power obtained for each method for each type of ballpoint pen.
| Methodology | VIS-IR Reflectance spectroscopy | VIS-IR Luminescence Spectroscopy | Two methods combined |
|---|---|---|---|
| Blue ink line | 88% | 77% | 92% |
| Black ink lines | 88% | 83% | 94% |
It was also found that some ink lines that gave similar luminescence behavior were discriminated by luminescence spectroscopy. Reflectance spectroscopy also succeeded in discriminating some ink lines that did not produce any luminescence; they were not differentiated by luminescence spectroscopy.
In addition to the achieved satisfactory discriminating powers, these methodologies provided a more objective non-destructive analysis of illustrating the differences of ballpoint inks of the same color. Furthermore, this ink analysis is characterized by its rapidity and simplicity methodology. Based on these factors, the use of VSC6000HS reflectance and luminescence spectroscopy is recommended in ink differentiating analyses.
However, ink lines from different pens produced similar spectral profiles. Thus, this methodology should not be used for identification.
The effect of paper in the spectra obtained from the VSC6000HS was also studied in this project. 11 different types of A4 papers, that included 7 white papers and 4 different colored papers, were examined. Spectra of a blue and a black ink line were obtained from these paper substrates.
It was found that the white paper substrates did not affect the reflectance spectra of the blue and black ink lines. The colored paper substrates, apart from the yellow and green, produced similar reflectance spectra to those of white papers. However, comparing ink entries on two or more different colored-papers is not recommended.
The luminescence spectra of the ink lines on white paper substrates, apart from one white paper (EXP green 50% recycled) were found to be similar. However, the lines on colored paper substrates produced different spectra. Thus, comparison of ink entries on different colored-substrates is not acceptable.