
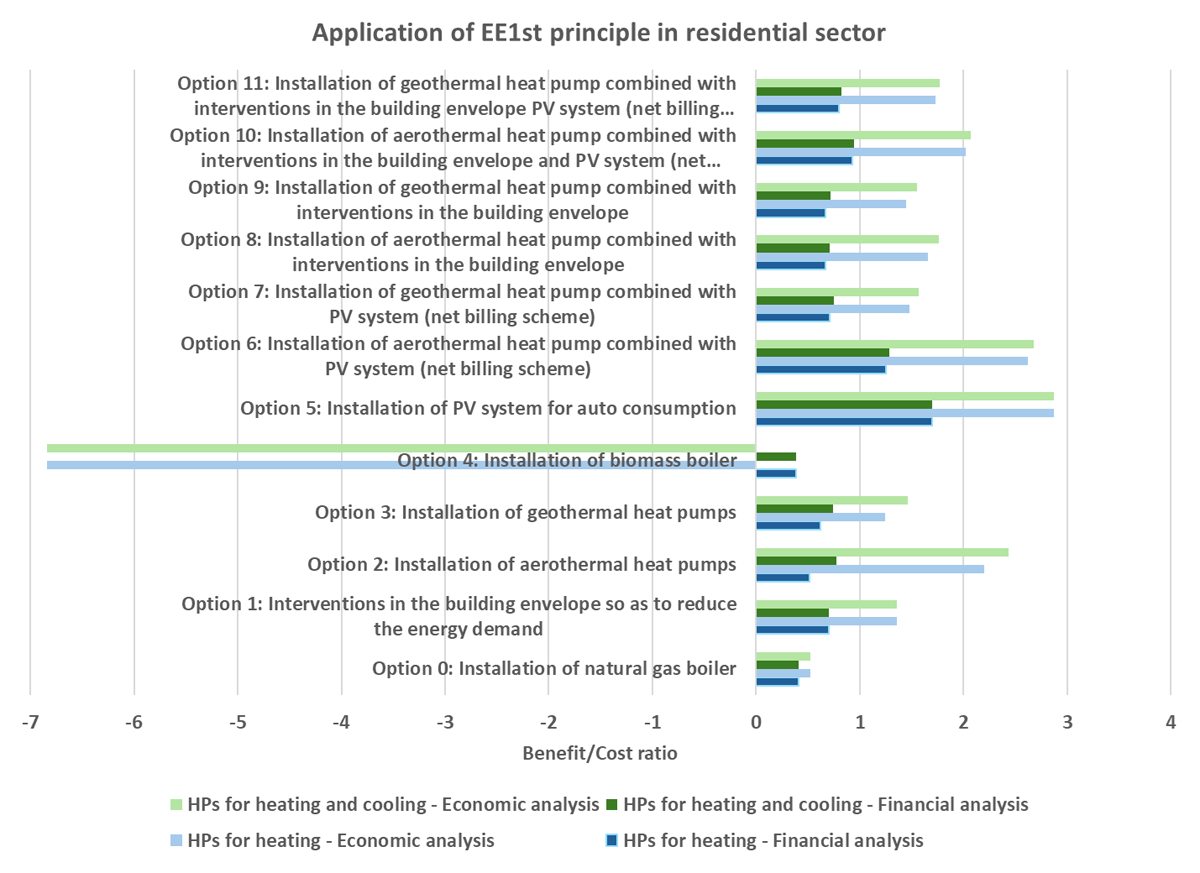
Figure 1
Graphical representation of the performance of different policy options in the residential sector considering the benefit/cost ratio (ENEFIRST Plus, 2025a).
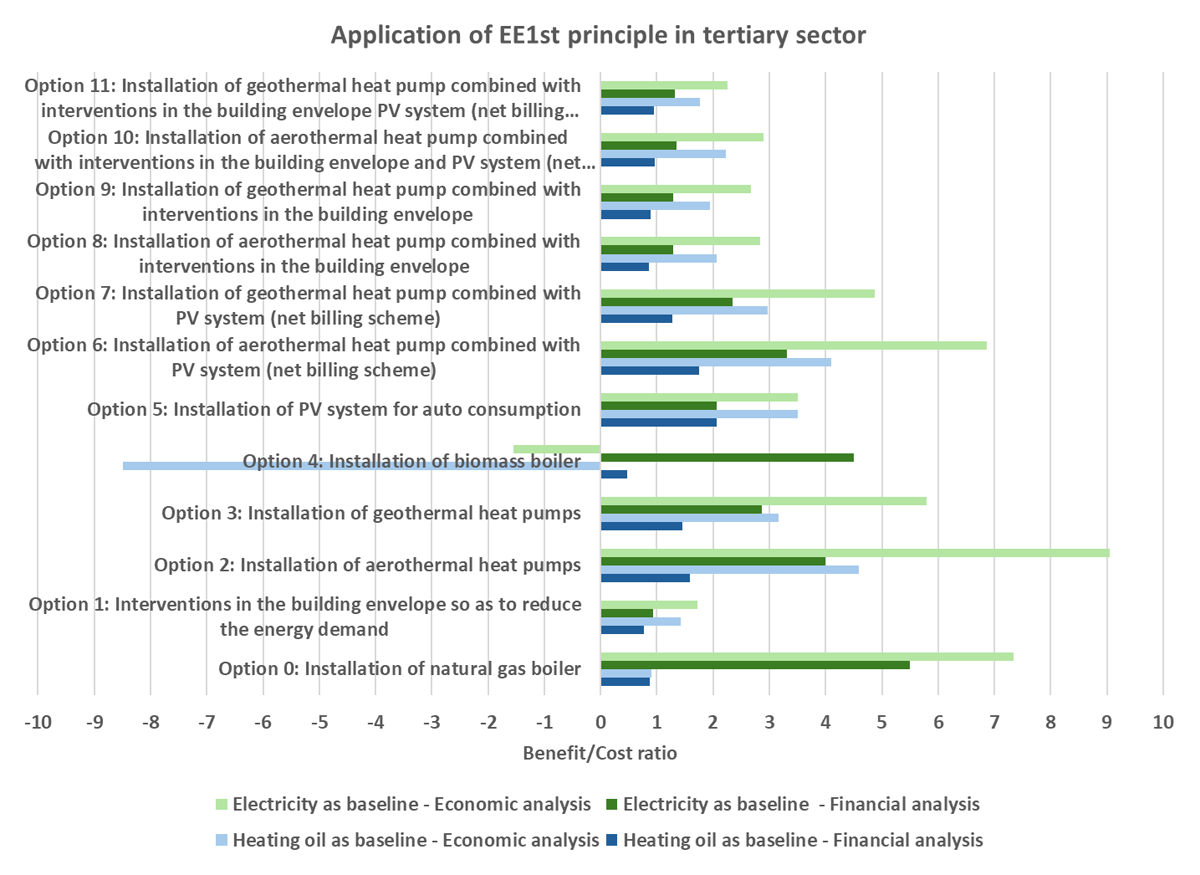
Figure 2
Graphical representation of the performance of different policy options in the tertiary sector considering the benefit/cost ratio (ENEFIRST Plus, 2025a).