
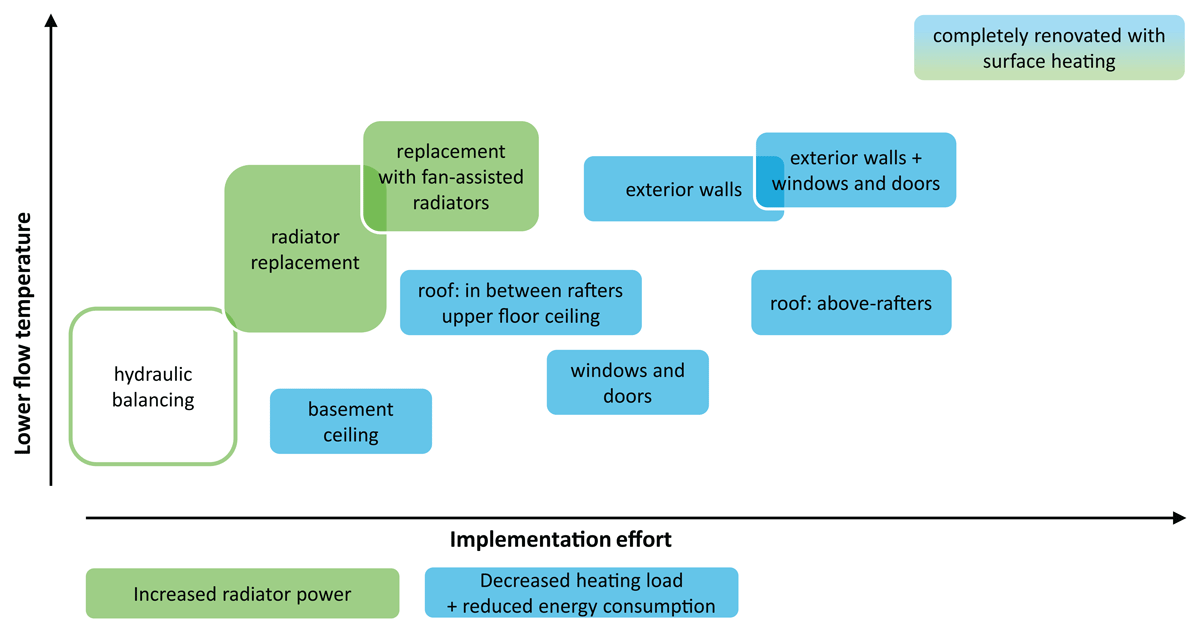
Figure 1
Influence and effort of measures and their impact on the supply temperature in the heating circuit, based on Mellwig, Pehnt & Lempik (2021).
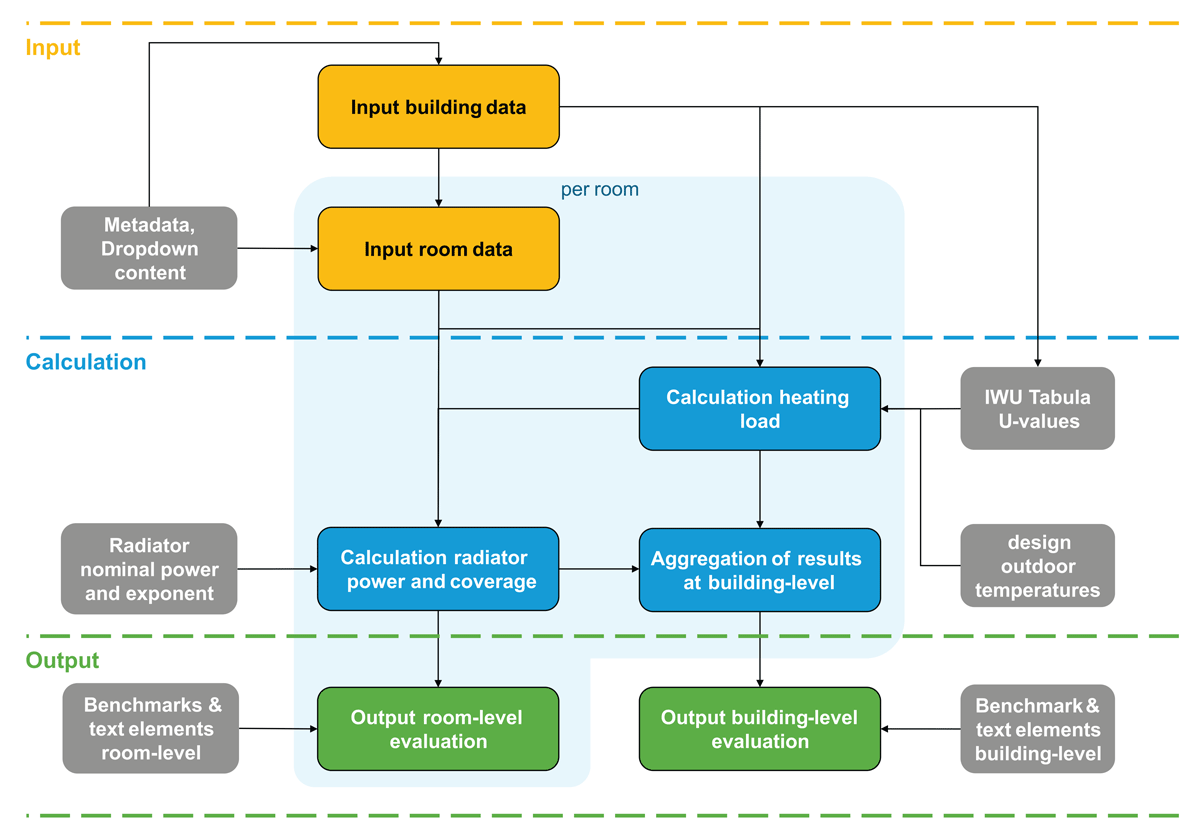
Figure 2
Overall workflow of the methodology for inputs (yellow), calculation steps (blue), outputs (green) and data sources (grey).
Table 1
Output rating of LT-ready evaluation.
| RATING | USER OUTPUT | COVERAGE RATIO FRAD,ACT |
|---|---|---|
| LT-ready | Optimized efficiency | ≥100% |
| Nearly LT-ready | 70–100% | |
| Partial deficit | 40–70% | |
| Not yet LT-ready | Low efficiency | <40% |
Table 2
Evaluation thresholds for opaque components and windows, based on (dena 2025).
| RATING | EXTERIOR WALL | ROOF | FLOOR | CEILING | WINDOWS |
|---|---|---|---|---|---|
| Red | >0.8 | >0.8 | >0.8 | >0.8 | >2.7 |
| Orange | 0.5–0.8 | 0.5–0.8 | 0.5–0.8 | 0.5–0.8 | 2.1–2.7 |
| Yellow | 0.35–0.5 | 0.3–0.5 | 0.4–0.5 | 0.3–0.5 | 1.5–2.1 |
| Green | ≤0.35 | ≤0.3 | ≤0.4 | ≤0.3 | ≤1.5 |
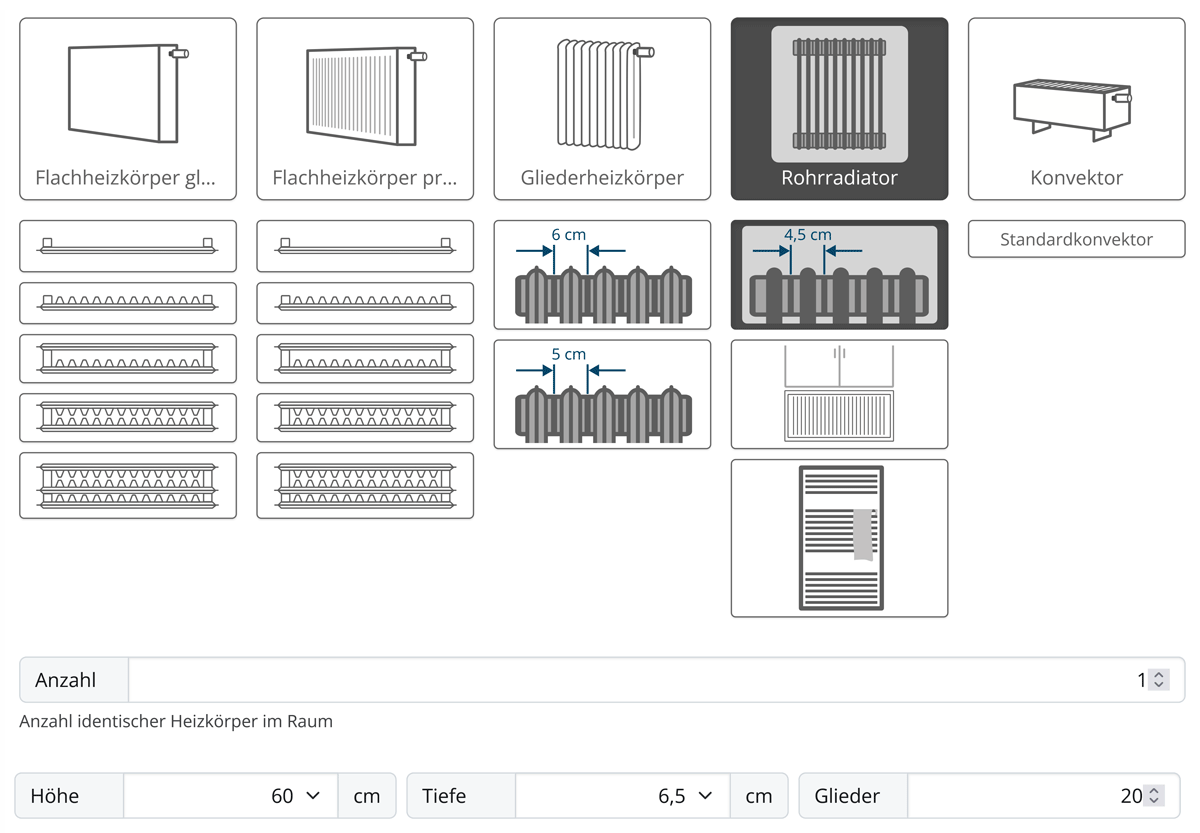
Figure 3
Screenshot of graphical radiator selection and input of required measures. Translation from left to right: flat radiator sleek/profiled, ribbed radiator, tubed radiator, convector.
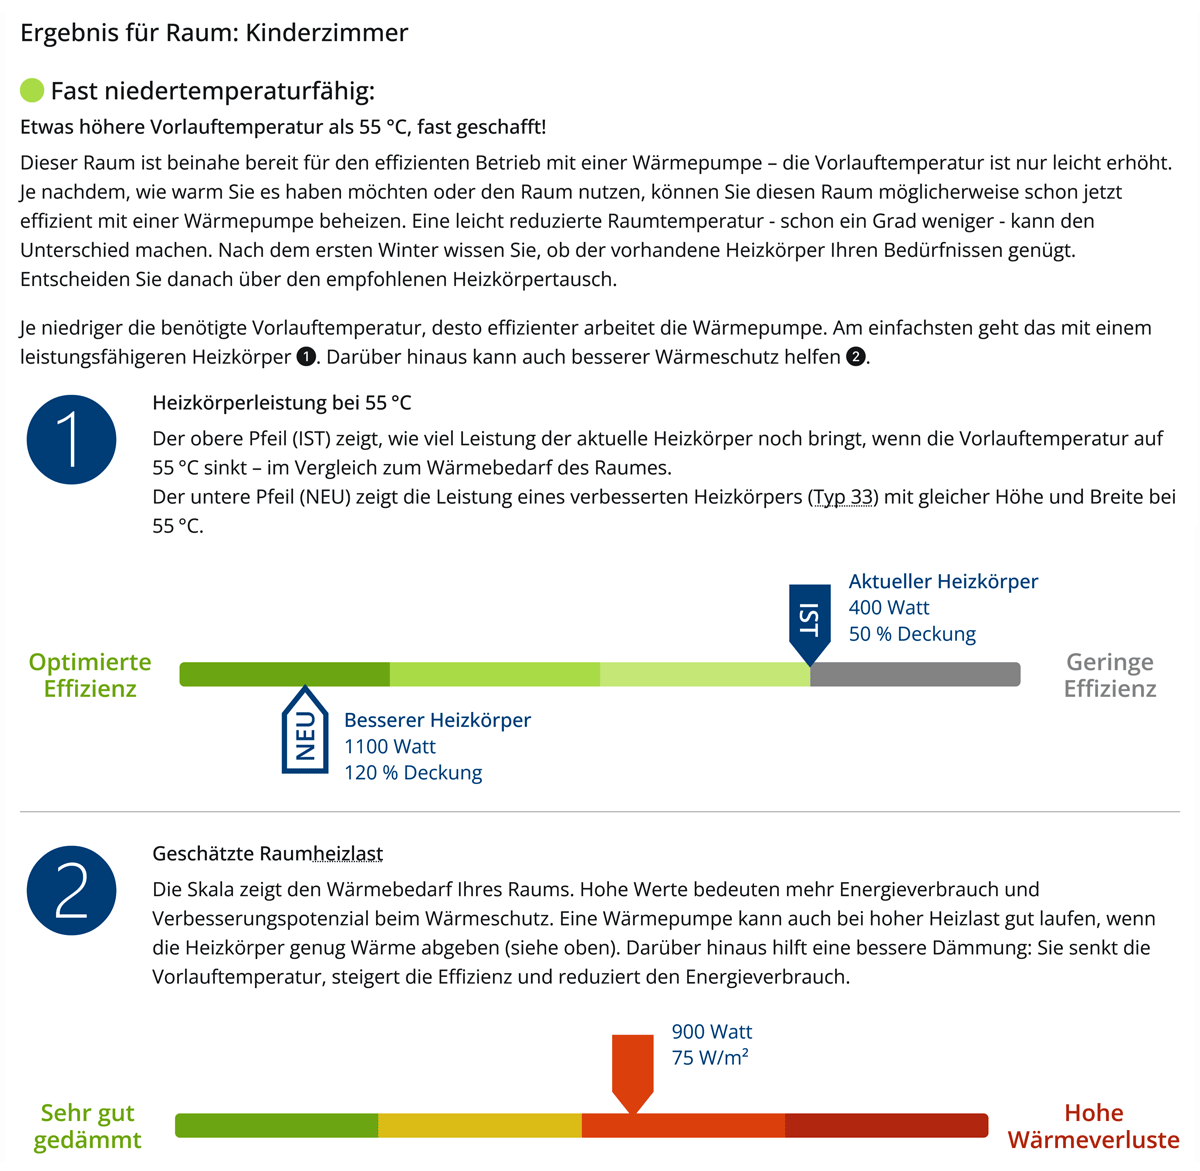
Figure 4
Screenshot: result display on room-level with output on LT-readiness and rating of heat pump efficiency and specific room heat losses (in German).
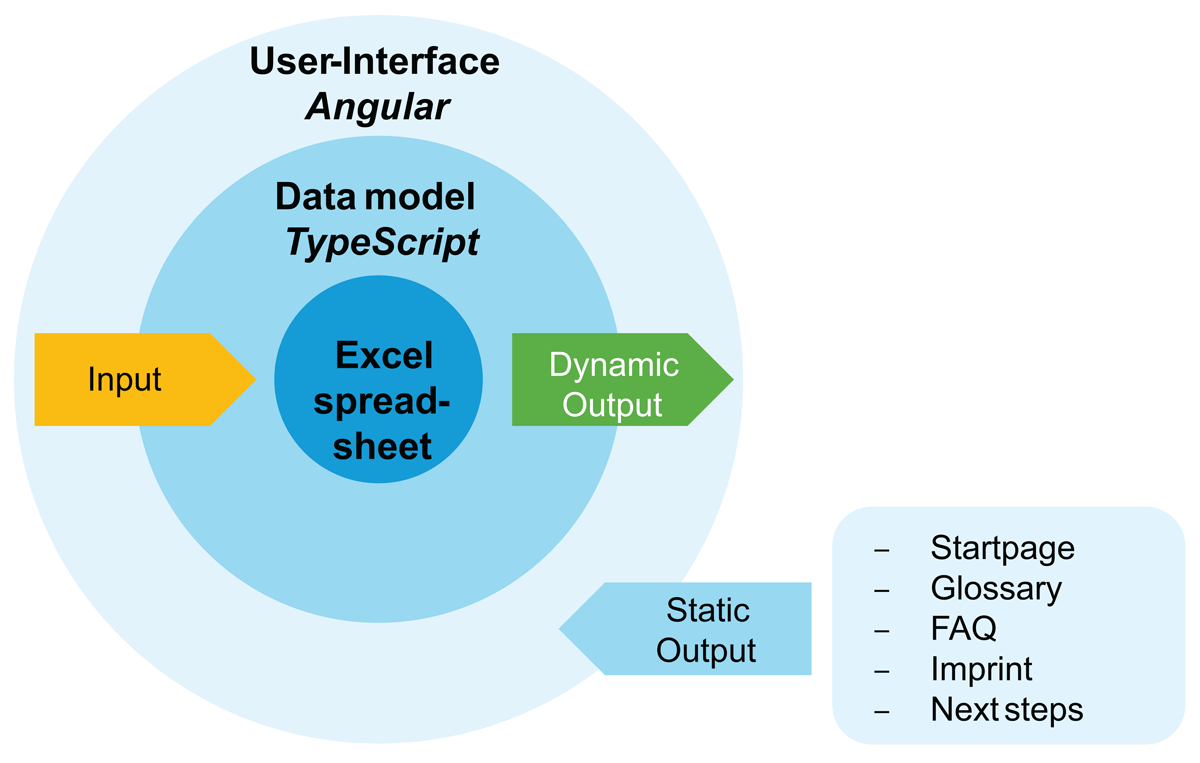
Figure 5
Interfaces between Excel, Typescript and Angular for input data, calculation and dynamic output.
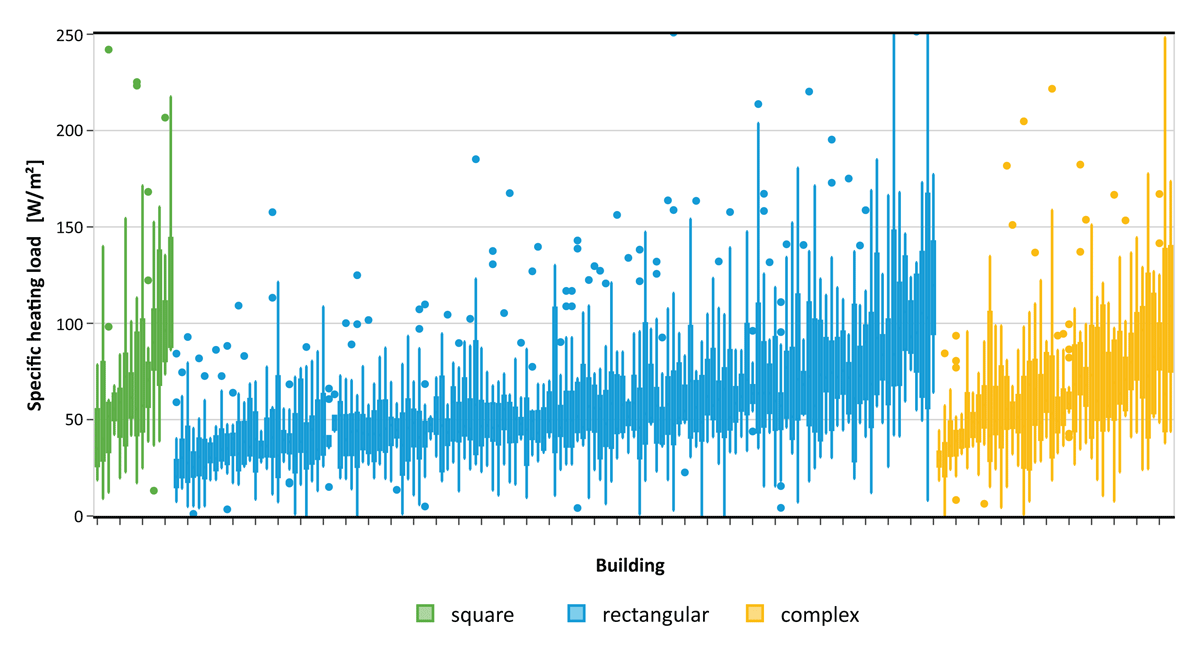
Figure 6
Distribution of specific space heating load per individual building for square (green), rectangular (blue) and complex (yellow) floor plans.
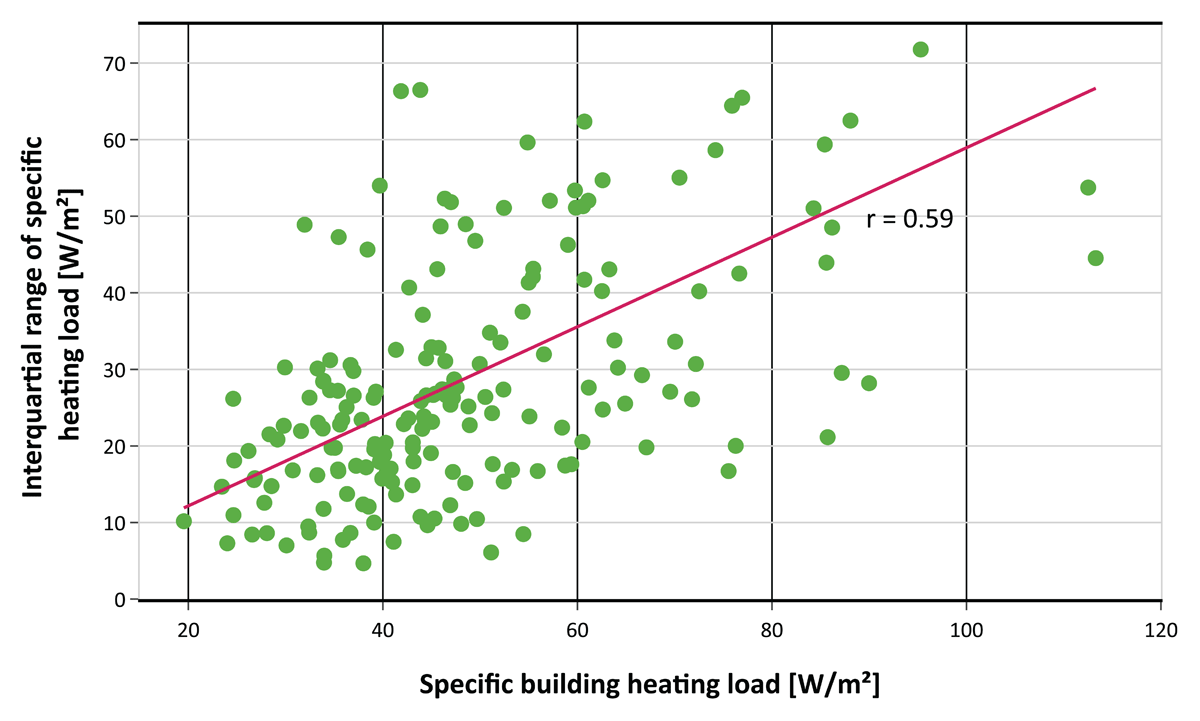
Figure 7
Dependence of the uneven distribution of space heating load on the specific building heating load based on the interquartile range of the specific space heating load per building.
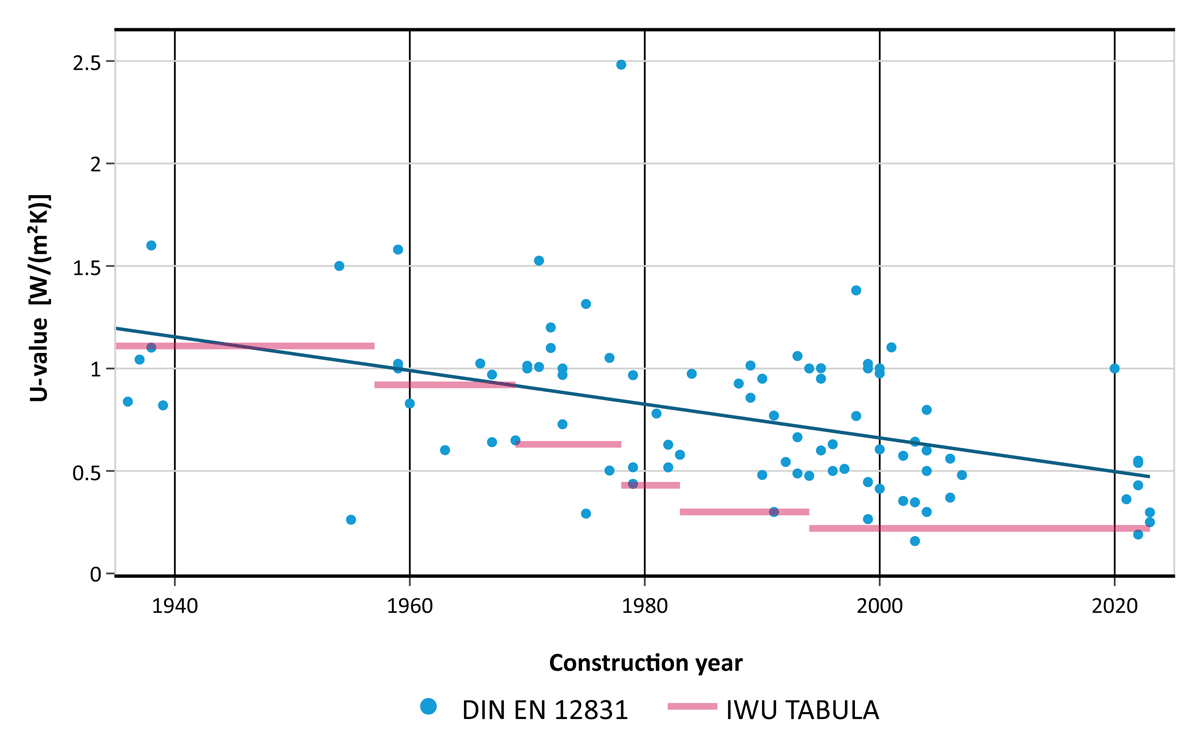
Figure 8
U-values (vertical) by construction year (horizontal) for the ceiling component calculated according to DIN EN 12831 (blue) and generic U-values according to TABULA (red).
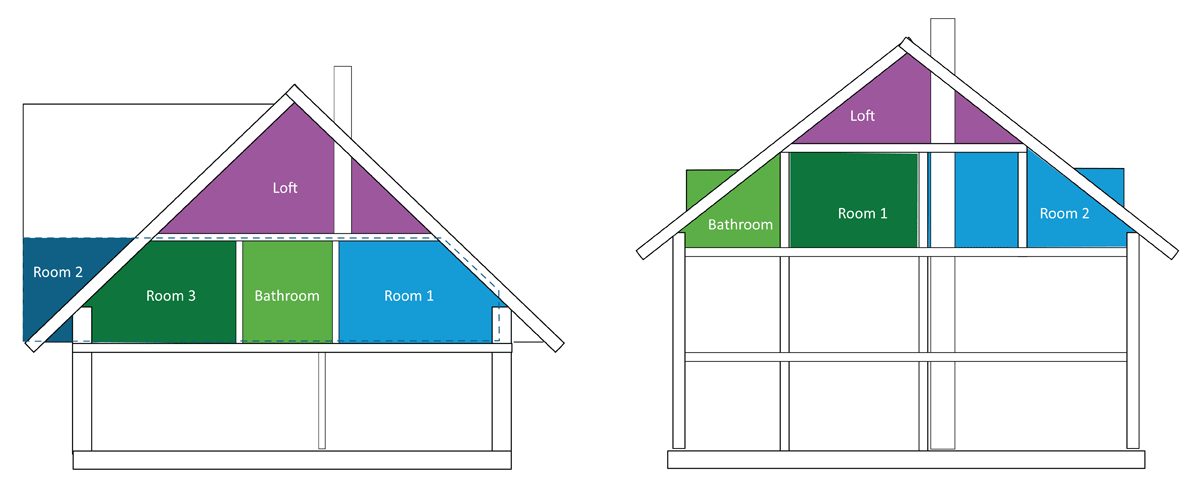
Figure 9
Schematic drawing of building “cross-gable” (left) and “dormer” (right).
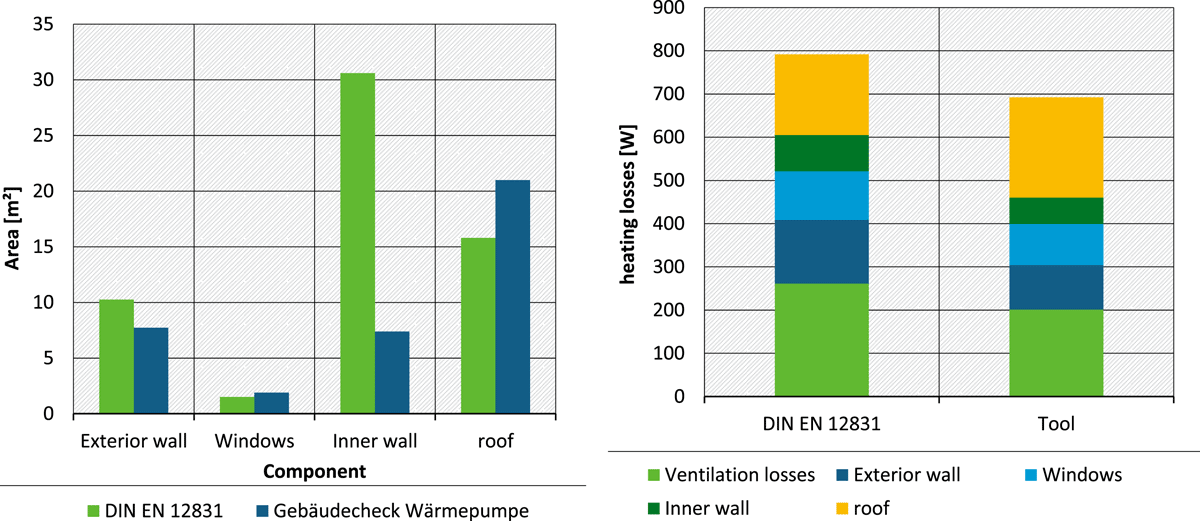
Figure 10
Gross component area (left) and heat losses (right) from DIN EN 12831 calculation and “Gebäudecheck Wärmepumpe” assessment for room 3 in building “cross-gable”.
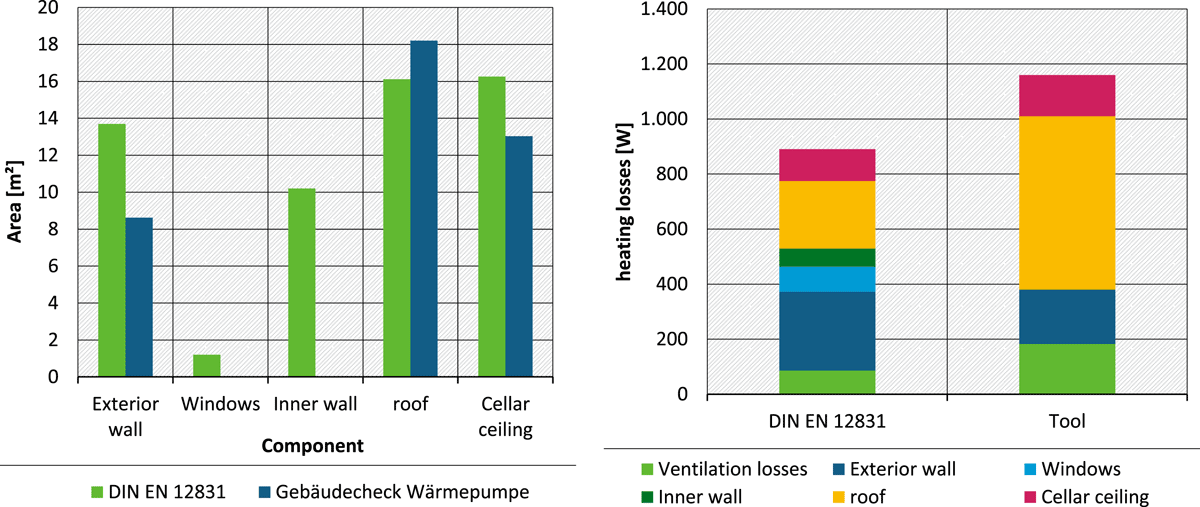
Figure 11
Gross component area (left) and heat losses (right) from DIN EN 12831 calculation and “Gebäudecheck Wärmepumpe” assessment for bathroom in building “dormer”.
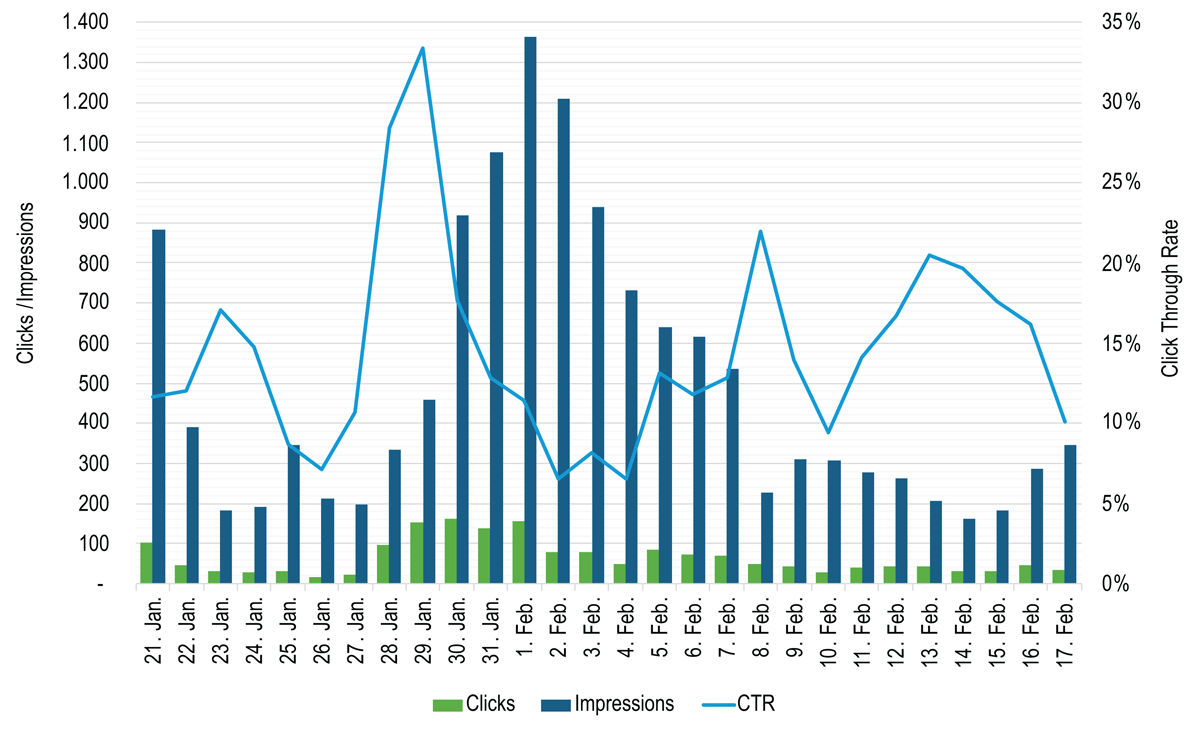
Figure 12
Google Search CTR values for the online tool “Gebäudecheck Wärmepumpe”.