
Introduction
Accounting for roughly 30% of national greenhouse gas emissions, Germany’s building sector is pivotal to achieving climate neutrality by 2045 (Umweltbundesamt 2026), particularly through decarbonising heat supply. The challenge extends across Europe, where heating and cooling account for a similar share of greenhouse gas (GHG) emissions and around 40% of total energy consumption (European Commission 2020), and more than 70% of building energy consumption still derives from fossil fuels (eurostat 2025). Decarbonising building heat is therefore central to the European target of reducing GHG emissions by at least 55% by 2030 relative to 1990 (European Commission 2026a). Heat pumps (HP) are recognised as a key technology for replacing fossil systems and reducing both emissions and dependency on imported fuels (European Parliament 2023).
Scenario analyses consistently show that HP will become the dominant heating technology, providing 55–80% of final energy for space heating in Germany under climate-neutral pathways (Agora Energiewende 2021; Brandes et al. 2021; Luderer, Kost & Sörgel 2021; Mellwig & Blömer 2024; Thamling, Rau & Kemmler 2022). While HP already account for 70–80% of heating systems in new buildings (bwp 2025), 78% of existing buildings are still heated by gas or oil (dena 2024), and 85% of EU buildings were constructed before 2000 (European Commission 2026b). The heat transition in the building stock therefore depends largely on retrofitting existing buildings with low-carbon heating technologies.
Heat pumps
Compression HPs extract thermal energy from an environmental source and deliver it to the heating circuit via a thermodynamic refrigeration cycle. Theoretical efficiency is described by the Carnot coefficient of performance (COP):
where TH and TC denote the absolute supply and source temperatures in Kelvin (Dohmann 2016). HPs in practical conditions achieve up to roughly 50% of COPcarnot; monitoring results in Günther et al. (2025) range from 32–52%. The seasonal performance factor (SPF) integrates this over the full heating season.
The COPcarnot establishes the fundamental principle that efficiency is inversely proportional to temperature lift: the lower the supply temperature, the more efficiently the HP operates. Thus, system performance is strongly influenced by required nominal heating circuit flow temperature of a building, and this becomes a practical proxy for both achievable performance and economic feasibility.
Many existing buildings can operate HP efficiently, as has been demonstrated in extensive field testing by Günther et al. (2020) across 56 existing buildings: at 55°C nominal supply temperature, air-source HPs achieve a mean SPF of ~2.7, ground-source systems ~3.1, rising to SPF 4 and above in well-retrofitted buildings with low-temperature distribution (Lämmle et al. 2023). Latest field measurements by Günther et al. (2025) in 77 buildings result in a mean SPF of 3.4 for air source and 4.3 for ground source HPs.
Low-temperature readiness (LT-ready)
Based on these findings, the low-temperature readiness (LT-ready) standard defines buildings capable of heating all rooms at design conditions (coldest winter days) with a maximum supply temperature of 55°C, achieved through targeted low-investment measures across the heating system, envelope and controls. Well-insulated buildings also prevent technical problems for HP, which operate optimally at low supply temperatures and high flow rates – conditions often unachievable in unrenovated buildings. From a systems perspective, only energy-efficient buildings provide sufficient thermal flexibility to limit disproportionate electricity demand peaks on cold winter days and thus avoid grid overload in a renewable energy system (Mellwig, Pehnt & Lempik 2021; Pehnt et al. 2023).
LT-readiness depends essentially on the balance between the heating load of each room and the output of its radiators. The required flow temperature of a building is often driven by a few thermally weak rooms with undersized radiators. Targeted low-investment measures such as selective radiator replacement can then reduce required flow temperatures substantially and improve HP performance (Lämmle et al. 2022). Approximating the HP suitability of a building therefore requires a room-wise rather than a building-level perspective.
Replacing radiators is the most efficient and cost-effective way to reduce supply temperature, whereas the main benefit of envelope retrofits lies in reduced heat losses and energy costs, with lower flow temperatures as a secondary effect. Figure 1 illustrates the qualitative relationship between effort and benefit of different measures.
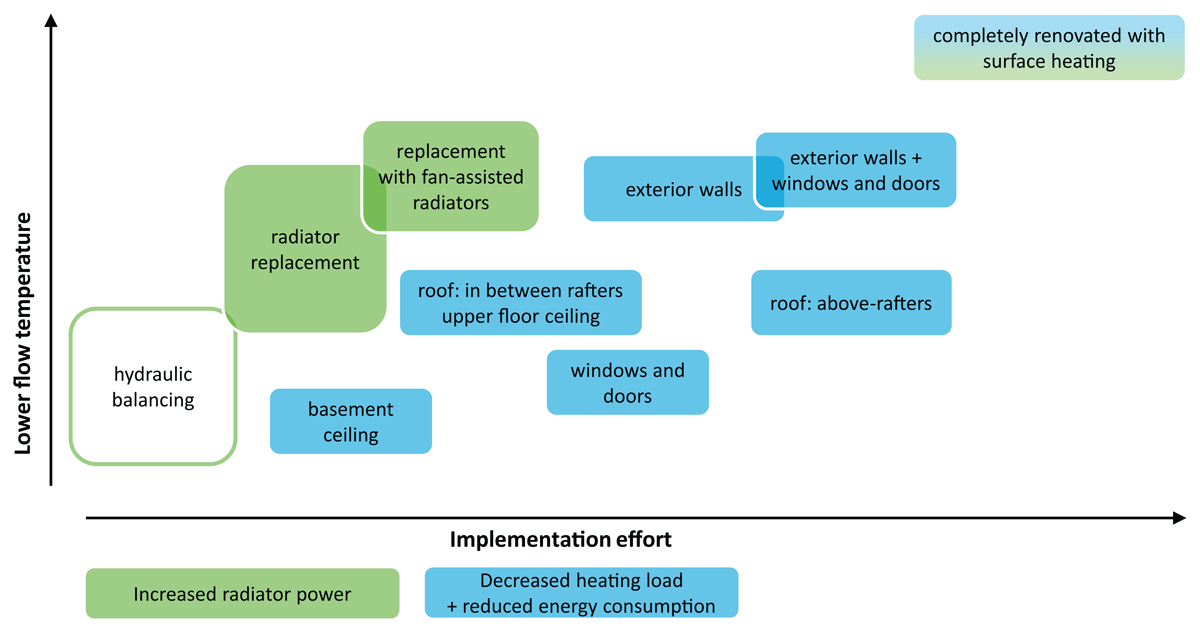
Figure 1
Influence and effort of measures and their impact on the supply temperature in the heating circuit, based on Mellwig, Pehnt & Lempik (2021).
Empowering building owners
Flow temperature assessment typically takes place during detailed planning and requires professional expertise (VdZ 2022). Building owners, however, face strategic decisions much earlier, often without technical support: whether their building is technically suitable for an HP, which adaptation measures are required and what costs arise – before obtaining quotations or entering formal planning and contracting. Perceived technical complexity, uncertainty about necessary measures and lack of accessible information remain major barriers to HP adoption (Stolte 2022).
Free online self-assessment tools provide only coarse, building-level estimates with limited detail (co2online 2026; FfE 2026; Zukunft Altbau 2026). Professional planning tools offer room-level assessment and higher precision, but require expert knowledge, are usually charged and not intended for early-stage self-assessment (autarc 2026; SHK INFO GmbH 2026). This creates a decision gap precisely where building owners need structured, comprehensible and technically robust guidance.
To address this early-stage barrier, this paper presents the open-source web application Gebäudecheck Wärmepumpe (English: “building heat pump check”): www.ifeu.de/gebaeudecheck-waermepumpe.
It operationalises a simplified room-level heating load and radiator evaluation framework applicable at varying levels of data availability. Instead of a binary pass/fail rating, it identifies room-specific limitations and derives specific recommendations for achieving LT-readiness with affordable measures. By lowering informational and analytical thresholds while preserving essential physical relationships, the approach empowers building owners to approximate their building’s capability for efficient HP operation independently. This supports informed self-directed decisions, improves homeowner–professional dialogue and reduces uncertainty – enabling a larger share of building owners to participate in the heat transition.
Beyond technical assessment, the approach addresses a central socio-technical dimension of the heat transition: households as active decision-makers. Heating system replacement is typically a once-in-decades investment with high financial stakes, long-term lock-in effects and significant informational asymmetries between homeowners and professionals. Uncertainty and perceived lack of control can then delay or prevent action, even where technically viable solutions exist. By translating complex thermodynamic relationships into understandable room-level indicators and actionable recommendations, the tool reduces cognitive barriers and strengthens users’ sense of competence and agency. Users can explore scenarios, understand trade-offs between radiator replacement and envelope measures and approximate the technical implications of their own building characteristics. The tool thus contributes to a broader understanding of the energy transition as a participatory process in which households shape investment decisions on transparent technical criteria.
The open-source licence (CC BY-SA 4.0) further enables adaptation, translation and contextualisation in different regulatory and climatic settings, thereby supporting scalable and transferable empowerment approaches across European building stocks.
Methodology
According to Renz & Hacke (2016), renovation measures are primarily economically motivated. Further drivers include the desire for more sustainable heating solutions and necessary maintenance; in owner-occupied buildings, improved comfort and lower operating costs also matter (Renz & Hacke 2016). Addressing these motivations requires accessible tools that allow building owners to assess their specific situation without relying solely on professional advice. Regarding the installation of a heat pump system, building owners typically raise three key questions:
Is my building suitable for (efficient) heat pump operation?
➔ Required for technical assessment: required supply temperature
Will a heat pump provide sufficient indoor comfort?
➔ Required for technical assessment: room-wise heating load and radiator sizing
Are building modifications necessary for heat pump operation?
➔ Required for technical assessment: radiator replacement and envelope retrofit measures
By structuring the tool around these questions, the assessment directly mirrors the decision-making perspective of building owners. Questions are answered based on a room-level heating load calculation according to a simplified DIN EN 12831 methodology as well as radiator evaluation following the hydronic balancing approach (German: “Hydraulischer Abgleich Verfahren B”) (VdZ 2022). Based on heat balance at 55°C (LT-ready) the tool focuses on:
heating load coverage of existing radiators per room
possible heating load coverage of an optimized replacement radiator per room by calculating a triple-panel triple-convector radiator
evaluation of room-specific heat losses
evaluation of component-specific heat losses per room
evaluation of radiator-suitability component-specific heat losses on building-level.
However, assessment of economic feasibility, heat source availability and domestic hot water production are not addressed. Further, the tool does not aim for a full building heating load calculation and is explicitly designed for non-expert users conducting preliminary self-assessment – empowering them to make informed decisions before engaging professionals.
Calculation workflow
The calculation methods were first implemented in MS Excel. For the online tool, the content was compiled as a TypeScript data model (see Ch. 3.4) and embedded in an Angular user interface (see Ch. 3.5). Figure 2 gives an overview of the process, including the Excel sheets underlying the web application. “2D” indicates that calculations are performed individually for each room (column-wise in Excel). Building data are entered once at the beginning. Users then define critical rooms1 for detailed assessment and may add further rooms. From the building- and room-level input (yellow), room-wise heating load, radiator output and load coverage are calculated (blue) using different data sources (grey, see Ch. 2.2). These results directly generate a room assessment (green). The final building evaluation aggregates all recorded room results.
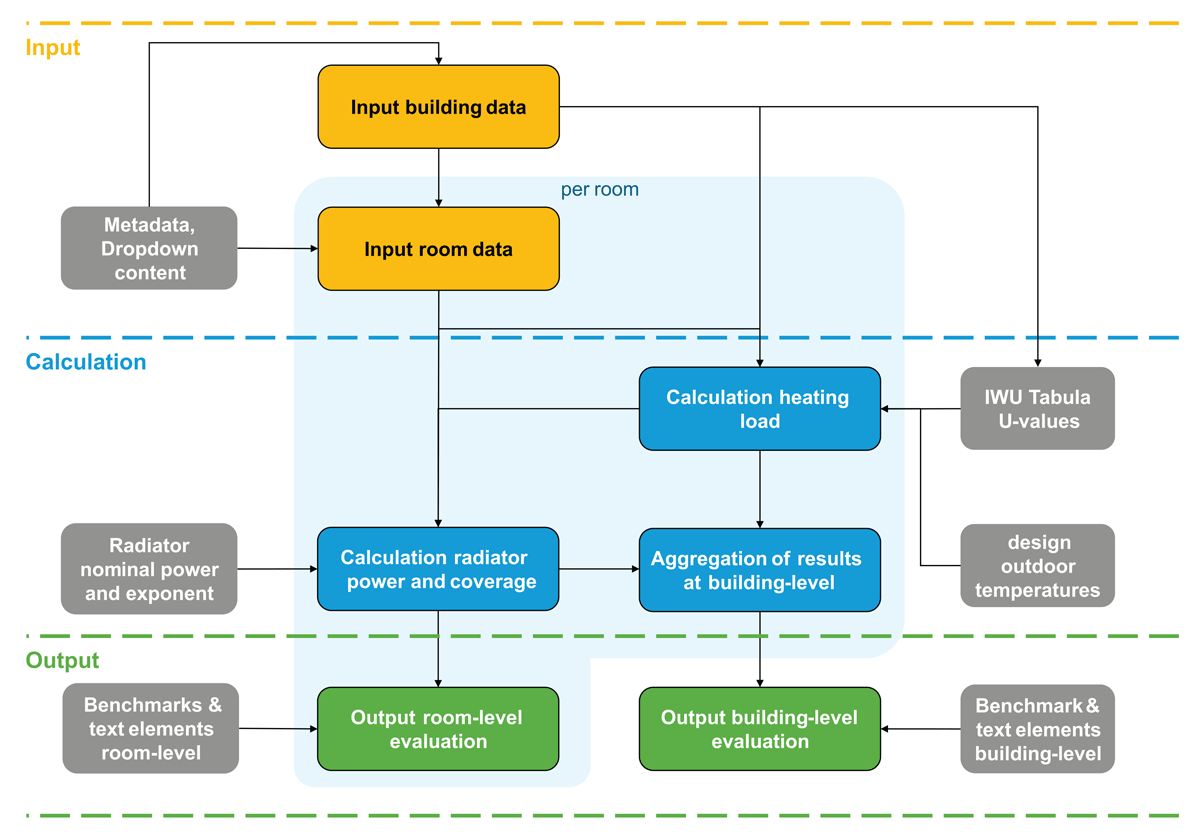
Figure 2
Overall workflow of the methodology for inputs (yellow), calculation steps (blue), outputs (green) and data sources (grey).
Focusing on critical rooms reflects the principle that a building is not LT-ready if at least one room fails the requirements and that measures at single rooms often are sufficient. Meanwhile the “critical room” principle keeps input effort manageable and reduces the methodological effort as no heat balance of non-heated rooms is calculated (see Ch. 4.1).
The modelling framework is an early-stage decision support approach, not a detailed engineering design tool. Conservative simplifying assumptions therefore balance input effort against methodological complexity. During data entry, the tool performs a preliminary heat pump suitability check based on building characteristics such as year of construction (>2002), efficiency class (B or better, i.e. ≤75 kWh/(m²a) in Germany) and heating system (surface heating only).
Renovation parameters can be specified individually at building level (roof, basement ceiling, upper ceiling), room level (exterior and interior walls) and component level (windows). These specifications feed the U-value estimation (see Ch. 3.1). Room geometry is derived from user inputs such as room height, total wall lengths, window and door dimensions and roof and upper ceiling dimensions, yielding component areas and enclosed volumes (for ventilation losses). Transmission heat losses are calculated from component areas, corresponding U-values, the user-entered indoor design temperature and normative outdoor temperatures. The room heating load is the sum of transmission and ventilation losses.
Roof spaces receive special modelling treatment, accounting for dormers, knee walls, roof inclination and their effects on heat loss surfaces (see Ch. 3.1 and Ch. 4.3).
Data base
The calculations draw on several databases. The TABULA database (‘Typology Approach for Building Stock Energy Assessment’) of the EU project EPISCOPE provides standardised model buildings, building typologies and energy-related characteristics for various European countries. For Germany, TABULA contains a residential building typology in which representative sample buildings are differentiated by building type (e.g. single-/two-family houses, terraced houses, multi-family houses) and age class. Central are the typical buildings, whose characteristics are statistically representative of building component properties, and which serve as reference for determining U-values and energy indicators and comparing them with the actual building stock (Loga et al. 2015). For the Gebäudecheck Wärmepumpe, TABULA provides the original-state U-values of exterior walls, roof, ceiling, windows and floor by building type and age class.
An analysis of heating load calculations for over 100 example buildings showed that TABULA U-values sometimes deviate significantly from actual practice; in these cases, they were corrected case by case (see Ch. 4.1).
Radiator heating capacity is derived primarily from the radiator data tables in Albers, Recknagel & Sprenger (2024), which contain differentiated standard heat outputs and radiator exponents for the geometries of the radiator types considered, subtypes I and II.
The heating load calculation uses the standard external temperature. It is determined from the postal code according to the national annex to DIN EN 12831 and corresponds to the lowest two-day mean air temperature reached ten times in the last 20 years. Insulation thicknesses and U-values for retrofitted building components are estimated taking into account the Building Energy Act (GEG) and its predecessors, the Energy Saving Ordinance (EnEV) and the Thermal Insulation Ordinance (WSVO).
Calculation of radiators
The tool calculates radiator power (panel heating is not included) by entering radiator type, subtype I, subtype II and dimensions into the frontend. Depending on the radiator type, different typical dimensions are requested:
Panel radiator: vertically profiled and smooth, varying no. of panels and convectors (width and height).
Column radiator: Cast iron and steel (height, depth and no. of columns).
Tubular radiator: steel (height, depth and no. of columns), window sill and towel rail (width and height).
Convector (width, depth and height).
Towel radiators are calculated based solely on their height hrad and width brad using a curve fit derived formula for easier data entry:
In addition to the current radiator’s output, a vertical profiled triple-panel triple-convector radiator (Type 33/K3) of identical width and height is always calculated for comparison and later recommendations.
Using radiator data tables in MS Excel, the standard radiator output under standard conditions (75°C flow temperature, 65°C return temperature, 20°C room temperature) according to EN 442 and the radiator exponent n are determined. The radiator output at a 55°C flow temperature (as derived in Mellwig, Pehnt & Lempik 2021) is then calculated with the rearranged second radiator equation from EN 442, which combines the standard output and the logarithmic mean temperature difference under both standard (constant at 49.83 K) and design conditions. The latter depends on design flow, design return and design room temperature.
Building heat losses
The room heating load is calculated from the standard transmission heat losses following DIN EN 12831. The transmission heat loss of each component enclosing the room is calculated individually from its area, heat transfer coefficient, thermal bridge correction and adjacent environment, i.e. outdoor air, unheated spaces or ground.
Thermal bridge corrections follow DIN 4108 Appendum 2: depending on envelope quality, the correction is 0.05 W/(m²K) for good-quality envelopes and 0.10 W/(m²K) otherwise. Temperature correction factors – aligned with the simplified procedure in DIN EN 12831 – are applied for components adjacent to outdoor air (1.0), unheated spaces (0.5) or ground (0.3). The standard transmission heat loss of the room follows from the heat flow and the temperature difference between interior and adjacent environment. The default indoor temperature is 20°C but can be set per room.
Standard ventilation heat losses are calculated with the simplified method from DIN EN 12831, incorporating the standard indoor–outdoor temperature difference, room volume, minimum air change rate, air density and specific heat capacity of air. For simplification, the latter three are treated as constants, the minimum air change rate taking the typical residential value of 0.5 h–¹ given in the standard.
Implementation
Building on the methodological framework established in Chapter 2, the following chapter describes the practical implementation of the assessment tool. It outlines the key simplifications applied to the DIN EN 12831 calculation procedure, the recommendations logic, the user-focused decision framework and the underlying software architecture.
Methodological simplifications
The tool deliberately deviates from a full DIN EN 12831 calculation in several respects to reduce data entry effort while maintaining conservative results. Key simplifications are:
Scope limited to critical rooms: Not all heated rooms are assessed. Heat exchange between rooms (heated or unheated) through inner walls is neglected.
No internal or solar gains: In line with DIN EN 12831, internal heat sources and solar gains are excluded, representing conservative design conditions.
Inner dimensions as input: Users measure rooms from the inside. The tool adds fixed allowances to estimate outer dimensions: +30 cm to wall height for ceilings, +50 cm to wall width for two external walls with 25 cm thickness each.
Simplified recording of components: External walls are entered as a single cumulative length; room-level efficiency deviations can only be specified for exterior walls and windows. Uniform wall heights are assumed per room. External doors are treated as windows. Default U-value 2.0 W/(m²K) for inner walls. Mixed adjacency conditions at horizontal components are not supported.
Variable level of detail for U-value estimation: Building-level U-values are approximated using the IWU TABULA database (see Ch. 2.2) based on construction year and component type. For refurbished components, U-values can be adjusted using user-defined information:
- Retrofit confirmed (yes/no) ➔ Forecast insulation thickness by year of construction (see below).
- Retrofit year specified ➔ insulation thickness by associated regulatory standards (see below).
- Insulation thickness entered directly ➔ U-value calculated from stated thickness with thermal conductivity 0.04 W/(mK).
Estimated renovation year: Modernisation period 1995–2002 for year of construction before 1978/period 2003–2008 for year of construction from 1978.
Retrofit U-values estimated from regulation history: For retrofitted components, insulation thickness and U-values are derived from the applicable regulatory standard at the time of modernisation (WSVO, EnEV, GEG), using a fixed thermal conductivity of 0.04 W/(mK).
Heating load correction for efficient buildings: Since DIN EN 12831 systematically overestimates heating load in well-insulated buildings by neglecting thermal mass and dynamic effects, a tiered correction is applied: 30% reduction for specific heating loads below 50 W/m², 20% for 50–70 W/m² and 5% for 70–90 W/m², based on the consumption-demand reconciliation approach in BBSR (2019) and Loga, Swiderek & Grafe (2019).
Roof rooms require particular attention given the geometric complexity of pitched roofs, dormers, knee walls and jamb walls. The tool distinguishes four roof configurations:
one pitched roof surface,
two symmetric pitched roof surfaces,
a complex roof surface with user-defined total areas or
a flat roof.
For pitched roofs, gable wall area, roof area and floor area are approximated from the user inputs roof length, roof height, horizontal ceiling width, number of gable walls and jamb or knee wall height. The approximation uses right-triangle geometry with a uniform roof inclination as specified in the building input (flat, 25°, 40°, 55°).
A key geometric distinction is made between knee and jamb walls. A knee wall is a solid wall section between the upper floor ceiling and the start of the roof surface; here the visible room geometry directly reflects the actual heat loss surfaces. A jamb wall is a lightweight partition placed in front of an inaccessible roof void behind which both roof surface and floor continue. The tool accounts for these heat loss surfaces but excludes the void volume from ventilation heat losses, which depend only on the habitable room volume. Room volume in attic spaces is reduced by a fixed factor of 70% to reflect the lower average height under a pitched roof.
Dormers are captured with a Boolean input. Their additional heat losses are estimated with a curve-fit factor for the total U-value of the roof:
derived from a systematic analysis of typical dormer geometries, room layouts and U-values, and applied as a multiplier to the roof heat loss. The undisturbed roof area is reduced proportionally for the dormer opening. For an uninsulated roof (U ≈ 2.0 W/(m²K)) the multiplier is about 1.3; for a well-insulated roof (U ≈ 0.3 W/(m²K)) it rises to about 2.3, reflecting the increasing relative contribution of dormer glazing as roof insulation improves. Systematic errors may arise where dormers are very small relative to the roof area or where their insulation quality deviates substantially from the main roof; both cases are considered atypical in the German residential building stock.
Benchmarks and recommendations logics
The results are generated on a per-case basis using various calculation parameters. Quality is assessed uniformly across all subject areas using a four-category system. Assessments are produced at both room level and building level, each covering three thematic blocks:
heat pump readiness,
radiator replacement potential and
building envelope quality.
Room-level assessment is carried out in three subject areas, for each of which corresponding recommendation text blocks are generated.
Heat pump readiness is evaluated based on the ratio frad,act of the heating capacity of the radiators at 55°C flow temperature to the heating load of the room. Output is a text block and a graphic with four-level gauge progress bar (see Figure 4) according to Table 1.
Table 1
Output rating of LT-ready evaluation.
| RATING | USER OUTPUT | COVERAGE RATIO FRAD,ACT |
|---|---|---|
| LT-ready | Optimized efficiency | ≥100% |
| Nearly LT-ready | 70–100% | |
| Partial deficit | 40–70% | |
| Not yet LT-ready | Low efficiency | <40% |
Radiator replacement potential is assessed based on a virtual flat radiator with a high specific capacity (type 33). Output is a text block and a dynamic radiator icon.
Building envelope quality is evaluated based on the specific heating load per living space area. Output is a text block and a four-level progress bar, rating low (≤ 50 W/m²), moderate (50–70 W/m²), above average (70–90 W/m²) and high losses (> 90 W/m²) as well as dynamic icons for the individual components with benchmarks according to Table 2.
Table 2
Evaluation thresholds for opaque components and windows, based on (dena 2025).
| RATING | EXTERIOR WALL | ROOF | FLOOR | CEILING | WINDOWS |
|---|---|---|---|---|---|
| Red | >0.8 | >0.8 | >0.8 | >0.8 | >2.7 |
| Orange | 0.5–0.8 | 0.5–0.8 | 0.5–0.8 | 0.5–0.8 | 2.1–2.7 |
| Yellow | 0.35–0.5 | 0.3–0.5 | 0.4–0.5 | 0.3–0.5 | 1.5–2.1 |
| Green | ≤0.35 | ≤0.3 | ≤0.4 | ≤0.3 | ≤1.5 |
For the building-level assessment, the individual room results are aggregated and displayed in the following thematic blocks:
Assessment of heat pump readiness: aggregation with regard to low-temperature readiness and radiator replacement is based on the percentage of rooms exceeding or falling below the coverage thresholds and on the absolute number of rooms. A building is not considered low-temperature ready if at least one room fails the criterion. Output is a text block and a linear four-point progress bar; the aggregated results of a potential radiator replacement are shown in the same place.
Room-by-room dashboard: overview of heating load, worst component, radiator output and coverage ratio as well as the radiator replacement potential per room. Output is a text block and dynamic icons for heating load and radiators, including a building-level summary of radiator replacement potential.
Building envelope efficiency evaluation, differentiated by component: exterior wall, windows, roof, ceiling, lower building envelope. This assessment is more detailed at building level than at room level and contains explicit recommendations for the individual components, since retrofit decisions are typically made at building rather than room level. Opaque components are assessed in simplified form via the area-weighted mean U-value of the individual rooms. In addition, each component’s share of the total transmission heat losses of all rooms is determined, enabling prioritisation by practical retrofit potential. This share is output as a characteristic value; recommendations for modernisation or replacement are suppressed where it falls below 15%.
User journey and input-output structure
The tool guides users through data entry via a structured pathway of numeric inputs, toggle switches and single-choice selections (radio buttons or dropdowns). Layered depth of detail allows either more precise input or use of the tool without detailed knowledge of the building characteristics. Mandatory and optional fields are distinguished and, where useful, in-line or pop-up help texts are provided. These help non-expert users to choose the applicable option (e.g. single- vs. two-pipe heating system), measure the correct dimensions (e.g. window vs. window reveal) or identify critical rooms via guided questions:
Does the room often remain too cold in winter?
Does the room have high exposure to outdoor air (via external walls, roof, or windows)?
Is the room located above or below unheated spaces, or directly adjacent to outdoor air?
Does the room have a large window area?
The room-level pathway adapts dynamically to user inputs: attic room entry differs from standard floor rooms, and the radiator type selected filters the subsequent dimension queries. Graphical elements support radiator type identification, which is particularly challenging for non-specialists (see Figure 3). For attic spaces, a “knock test” prompt helps users distinguish knee wall from jamb wall without prior technical knowledge.
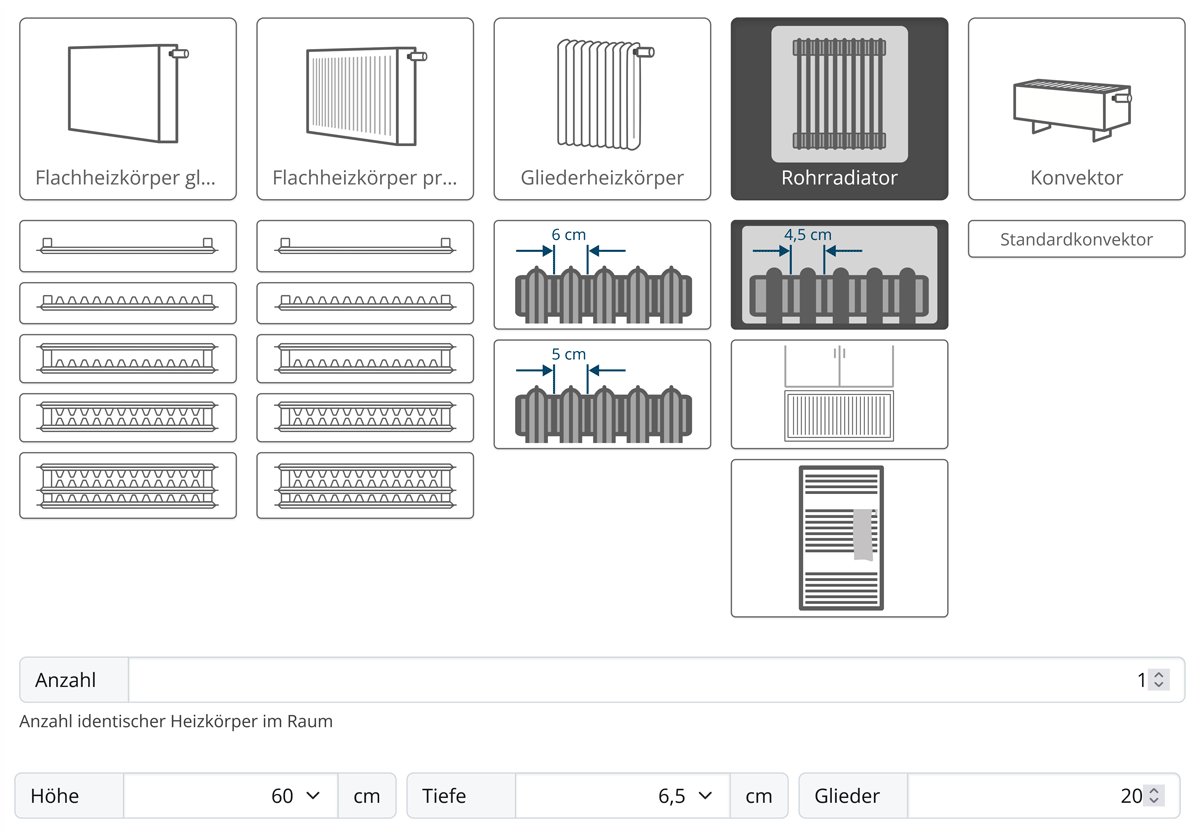
Figure 3
Screenshot of graphical radiator selection and input of required measures. Translation from left to right: flat radiator sleek/profiled, ribbed radiator, tubed radiator, convector.
After each room, interim results on LT-readiness, radiator coverage in current and upgraded state and envelope quality are displayed (see Figure 4) before the user proceeds to the next room. This direct feedback supports understanding and maintains engagement.
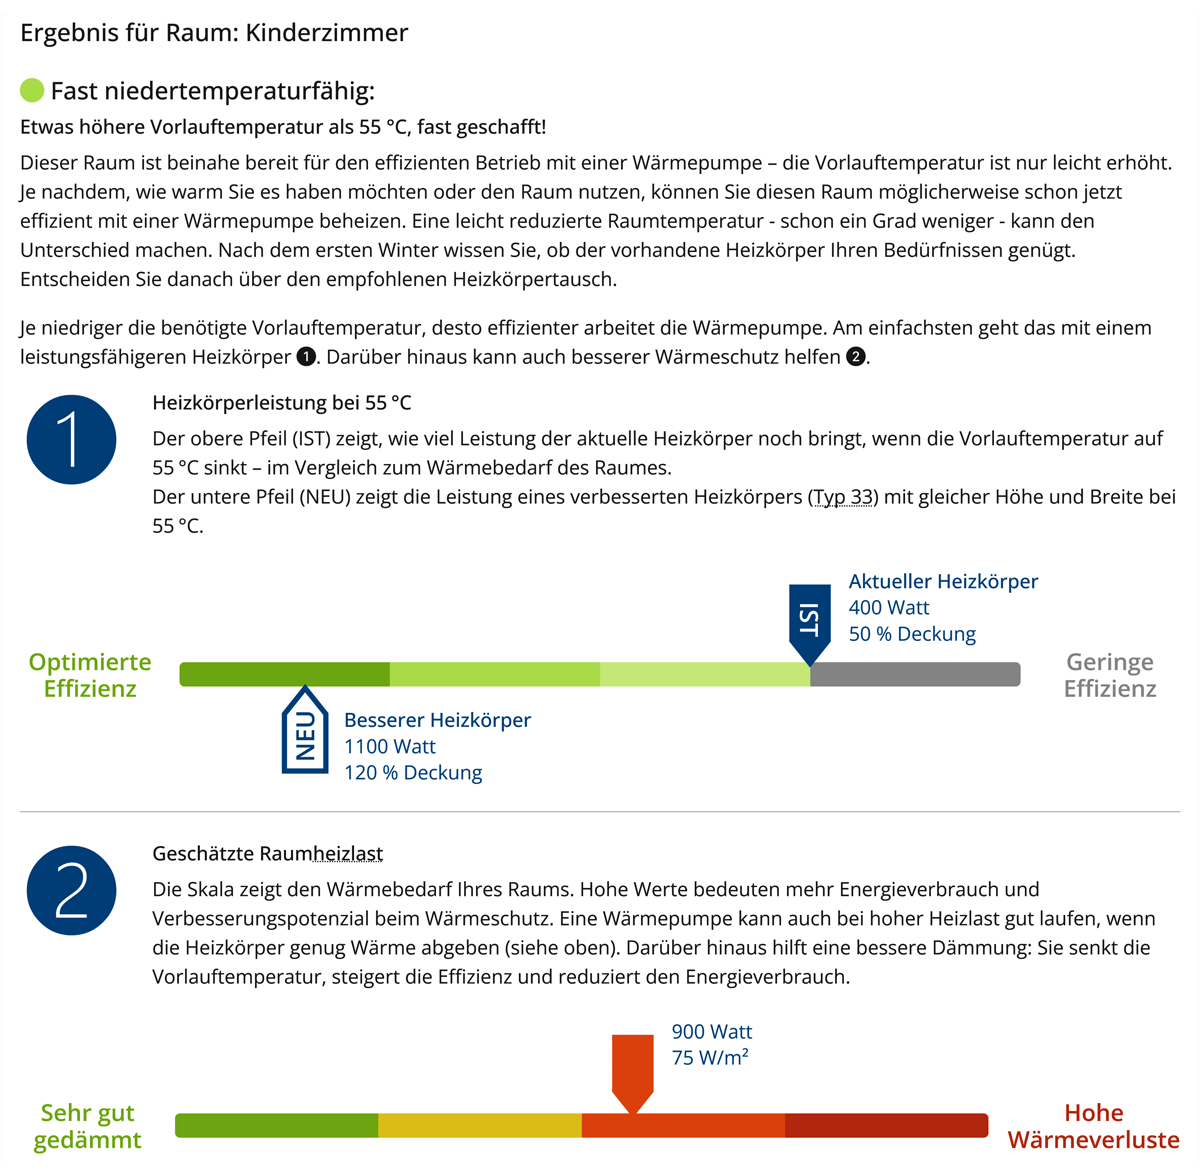
Figure 4
Screenshot: result display on room-level with output on LT-readiness and rating of heat pump efficiency and specific room heat losses (in German).
Typescript data model
The tool’s calculation logic is built on a TypeScript data model, which is directly based on the original excel spreadsheet implementation (mapping sheets, cells, scalar values, simple formulas and references directly). Due to their complexity, calculation formulas are then manually re-implemented in TypeScript (Bierman, Abadi & Torgersen 2014; Mauroy 2025). The structure interaction of excel methodology basis, TypeScript data model and Angular dynamic user interface (UI) is shown in Figure 5.
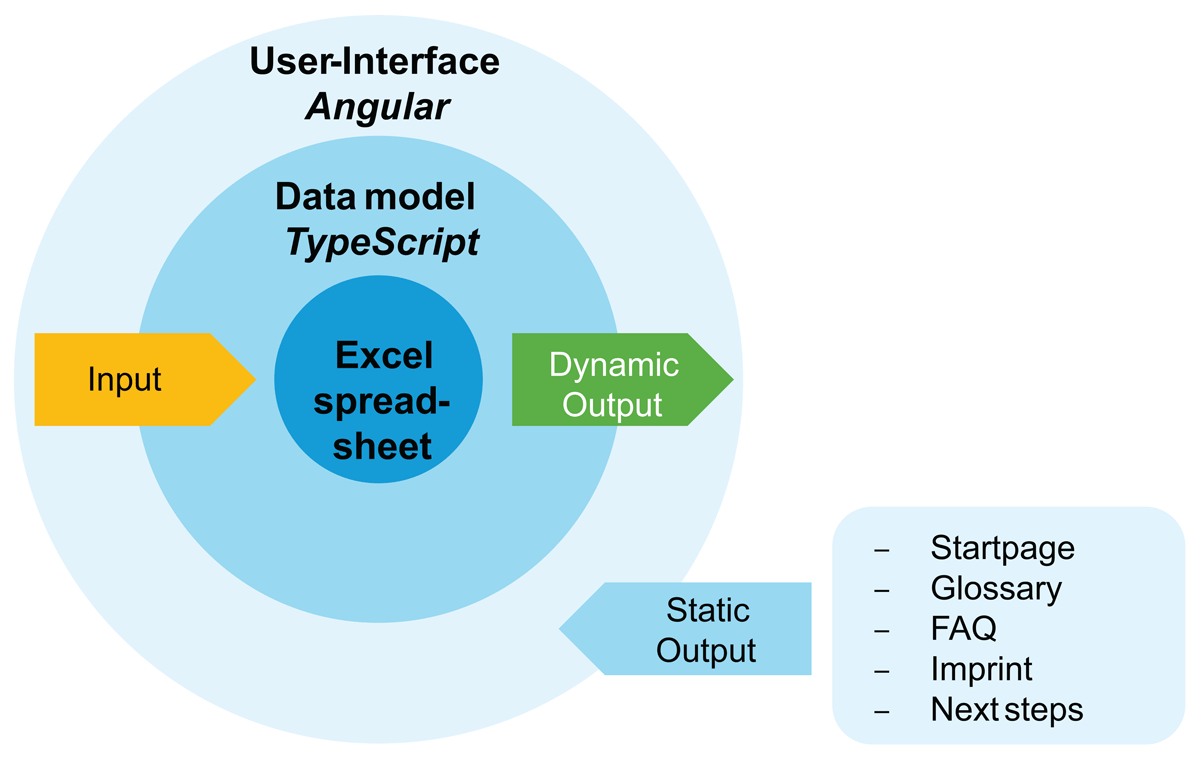
Figure 5
Interfaces between Excel, Typescript and Angular for input data, calculation and dynamic output.
By strictly mirroring the spreadsheet’s structure, the model inherits both its advantages and its disadvantages: it is entirely deterministic and stateless. The main advantage is that calculations are straightforward, reliable and independent of the order of user input. This allows the TypeScript version to be tested and formally verified against the spreadsheet. A disadvantage of the strictly stateless architecture is that certain more complex user experience (UX) patterns cannot be mapped directly onto this approach and would require a further level of abstraction.
Angular user interface
The UI is built with Angular, a framework tailored to interactive interfaces with direct data bindings. An architectural characteristic is that the entire application runs within the user’s web browser; no external servers or backends are required to process inputs and calculations (Seshadri 2018).
The interface connects to the stateless data model through unidirectional data bindings, mirroring the model’s determinism and making the application predictable and stable. Alongside reliability and technical performance, accessibility was a major focus: the interface is largely accessible by design, offering screen reader support, full keyboard navigation and high-contrast visuals.
Open source
To encourage collaboration and reuse, the complete web application is open-source and under the CC BY-SA 4.0 license. It allows anyone to use and adapt the tool, provided subsequent changes are shared under the same terms. The complete source code is publicly hosted on GitHub (a popular online platform for collaborative software development, run by Microsoft) at https://github.com/ifeu-ggmbh/gebaeudecheck-waermepumpe.
This open repository contains the application code, the authoritative calculation spreadsheet, the scripts used to convert its data tables, build scripts to directly build a runnable version and short technical documentation.
Results and discussion
The following chapter presents and discusses the results of the tool’s development and plausibility assessment against professional DIN EN 12831 calculations, drawing on a dataset of 191 existing residential buildings. It examines the distribution of room-specific heat losses as a basis for critical room identification (see Ch. 4.1), the accuracy of underlying U-value data (see Ch. 4.1) and the plausibility of geometric simplifications for attic rooms (see Ch. 4.3). Further initial evidence of market reception is discussed.
Inequality of room-specific heat losses
As the nominal flow temperature depends on the worst-performing room, the distribution of heating loads across rooms is central to identifying critical rooms. To investigate this, DIN EN 12831 heating load data from 191 single-zone residential buildings were analysed at room and component level. Most were built between 1970 and 2009, with floor areas of 100–300 m² and a median specific heating load of 45 W/m², a comparatively good energy standard.
Figure 6 shows the distribution of specific room heating loads per building as a boxplot, differentiated by floor plan geometry. The interquartile range varies substantially: for 75% of buildings the spread stays below 25 W/m²; for the upper quartile it exceeds 37 W/m², indicating strongly uneven distributions in a significant share of the stock.
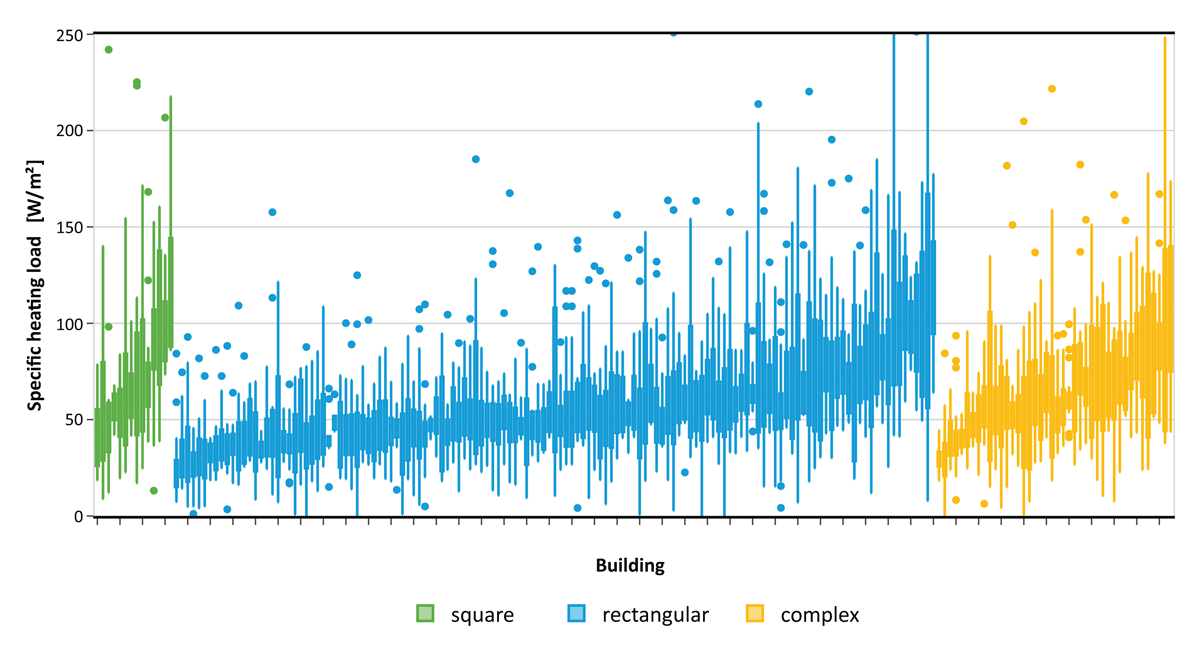
Figure 6
Distribution of specific space heating load per individual building for square (green), rectangular (blue) and complex (yellow) floor plans.
Figure 7 reveals a clear positive correlation (r = 0.59) between a building’s overall specific heating load and this spread: buildings with poorer thermal performance show more pronounced heating load inequality and are therefore more amenable to targeted single-room interventions. Contrary to initial expectations, floor plan complexity shows no clear additional effect.
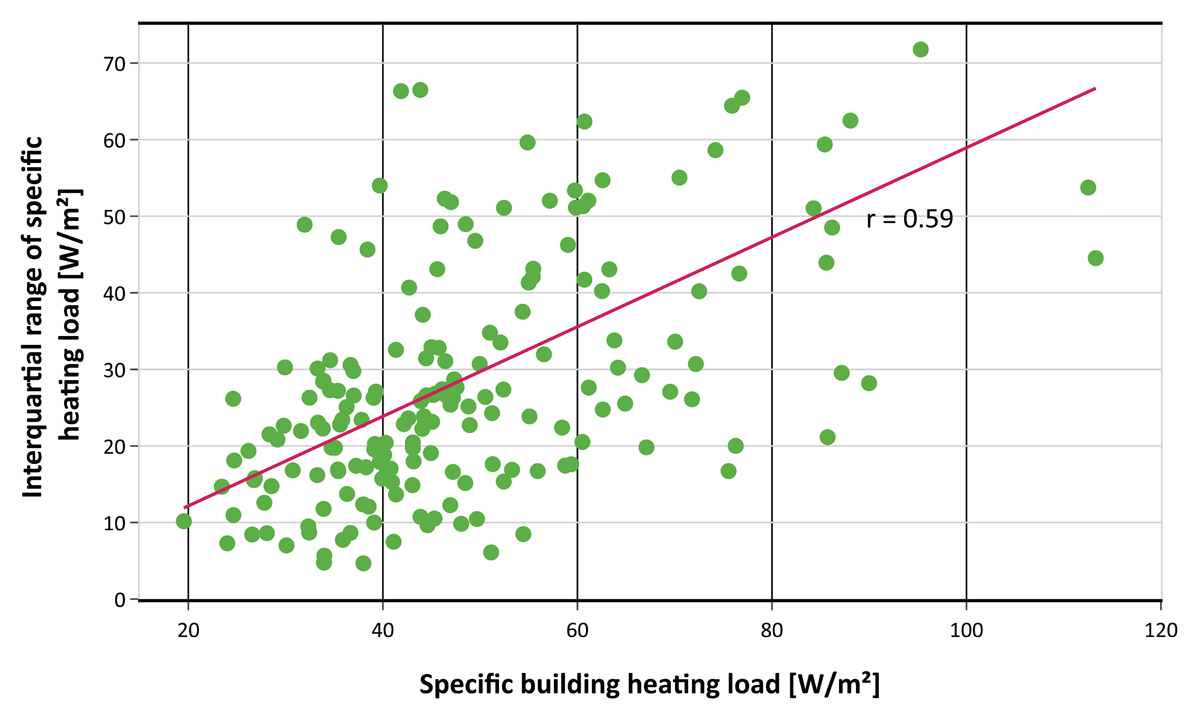
Figure 7
Dependence of the uneven distribution of space heating load on the specific building heating load based on the interquartile range of the specific space heating load per building.
U-values: standard assumptions vs. practice
Generic U-values based on year of construction and building type (see Ch. 2.2) are the primary source of uncertainty in the tool’s heating load calculation. To assess their validity, TABULA values were compared against U-values from 122 professional DIN EN 12831 calculations with known construction year, excluding retrofitted components. The reference U-values were determined from component specifications with the software Ubakus following DIN EN ISO 6946.
The comparison reveals component-specific patterns. For exterior walls, TABULA agrees well with practice for buildings after 1984 but increasingly overestimates U-values for older buildings. For windows, agreement is good from 1995 onwards; for earlier buildings TABULA values are notably higher than observed, possibly reflecting unrecorded window replacements. A particular outlier is the window U-value of 4.3 W/(m²K) for 1979–1983, which the reference data do not support and which was corrected to 2.57 W/(m²K). For roofs and upper floor ceilings, TABULA consistently underestimates U-values across nearly all construction periods; the constant 0.22 W/(m²K) assumed from 1995 onwards reflects neither built practice nor the regulatory requirements of that era (see Figure 8). Roof and ceiling U-values for 1984–2008 were therefore adjusted to WSVO and EnEV levels: 0.45 (1984–1994), 0.30 (1995–2002) and 0.275 W/(m²K) (2003–2008). For floors, agreement is good overall, with one correction for 1995–2002 (0.5 instead of 0.3 W/(m²K)). These targeted corrections reduce systematic bias while preserving the simplicity of database-driven input.
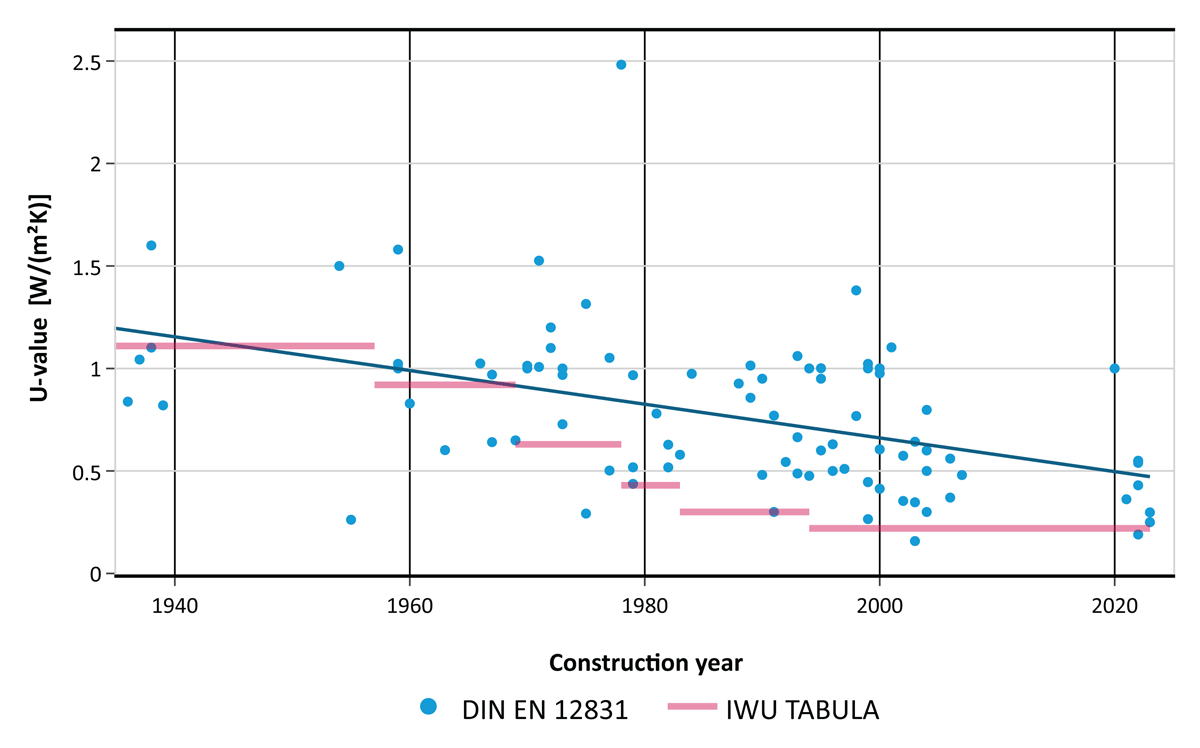
Figure 8
U-values (vertical) by construction year (horizontal) for the ceiling component calculated according to DIN EN 12831 (blue) and generic U-values according to TABULA (red).
Since deviations exceeding 100% occur for individual components and periods, U-values remain the largest single uncertainty in the tool. Where users specify retrofit insulation thickness, this uncertainty is substantially reduced, as the added layer dominates the resulting U-value. Optional manual adjustment of heat transfer coefficients would improve accuracy, but the required knowledge is not usually available to non-experts and would add complexity, so this level of detail was omitted.
Accuracy of simplifications
The accuracy of the tool is benchmarked against full DIN EN 12831 calculations and hydronic balancing Method B. The radiator coverage ratio as key output depends linearly on component U-values, effective component areas, adjacent temperature differences and radiator output. Radiator output introduces negligible error where type and dimensions are entered correctly, as it uses the same method and database as Method B. Temperature correction factors follow DIN EN 12831 Table B.11 and agree well for components adjacent to outdoor air, ground or rooms below 15°C; deviations arise only where room temperatures within the building differ substantially, a configuration the tool does not resolve because interior walls to heated areas are neglected. Component areas and U-values thus remain the dominant uncertainty sources.
For standard floor rooms without roof surfaces, area estimation is straightforward and introduces minimal error. The plausibility assessment therefore focuses on attic rooms as the structural weak point of the simplification approach (see Ch. 3.1) – a deliberate trade-off to keep data entry feasible for non-experts. Two demanding examples are examined, one with a cross-gable and one with a dormer (see Figure 9). Given the small sample, the results are a qualitative plausibility assessment rather than a statistically robust validation; systematic validation against a larger and more diverse sample remains future work.
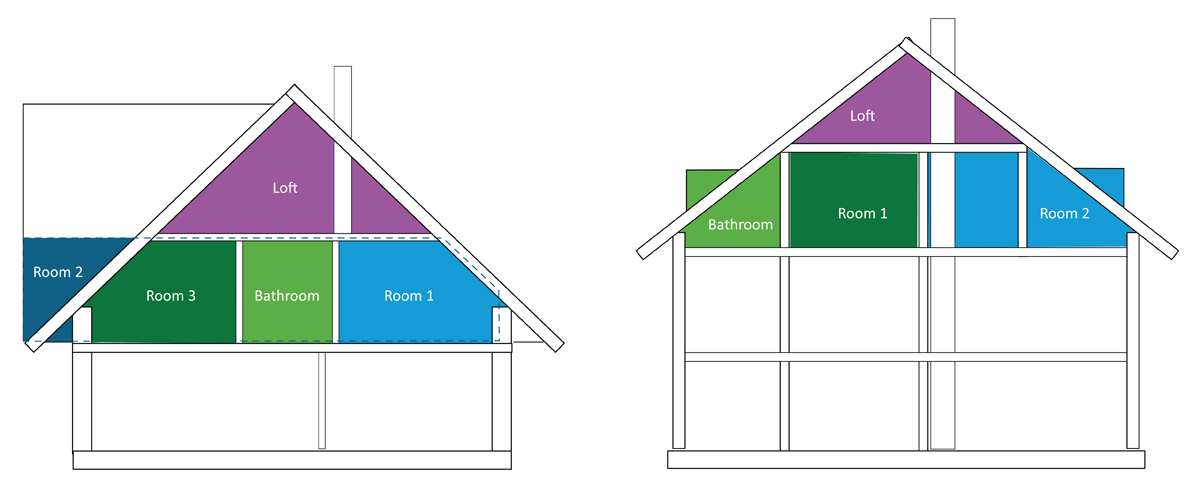
Figure 9
Schematic drawing of building “cross-gable” (left) and “dormer” (right).
Building “cross-gable” features a large cross-gable and three attic rooms. Figure 10 illustrates a representative well-performing attic room (room 3), where component areas and heat losses are reproduced with an overall deviation of -13%, driven mainly by lower U-values and slightly underestimated ventilation losses from the generalised reduction factor. Room 2, spanning the full building width including the cross-gable, shows the limits of simplified attic room capture: because it has an asymmetric roof and associated gable wall, the exterior wall area is overestimated by ~60% and the roof area underestimated by ~30%. These errors compensate, resulting in near-identical total heat losses (-3%). The bathroom represents a structurally challenging edge case: the tool underestimates the room heating load by 45%, as heat losses of 260 W through interior walls to an adjacent unheated corridor cannot be captured.
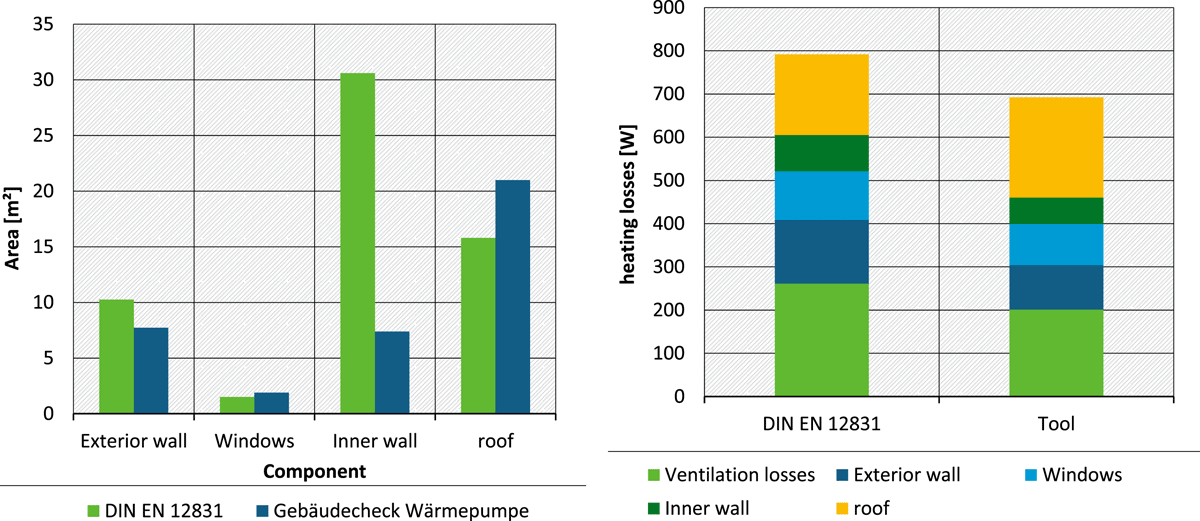
Figure 10
Gross component area (left) and heat losses (right) from DIN EN 12831 calculation and “Gebäudecheck Wärmepumpe” assessment for room 3 in building “cross-gable”.
Building “dormer” features a gable roof with one dormer per roof side. U-value agreement is substantially better than for the first building, with exterior wall and roof values matching almost exactly. For rooms with dormers, Figure 11 shows a systematic overestimation of heat losses by roughly 30%, driven by the U-value-dependent dormer loss factor, which proves conservative for the relatively small dormer in this building. The deviation in exterior wall area appears to stem from overly large knee and gable wall areas in the DIN calculation. For the simple gable roof room without dormer, roof heat losses are reproduced with only small deviation, confirming the reliability of the pitched roof geometry in the absence of dormers. Overall, the building shows a systematic overestimation of 20%, mainly attributable to the dormer correction factor.
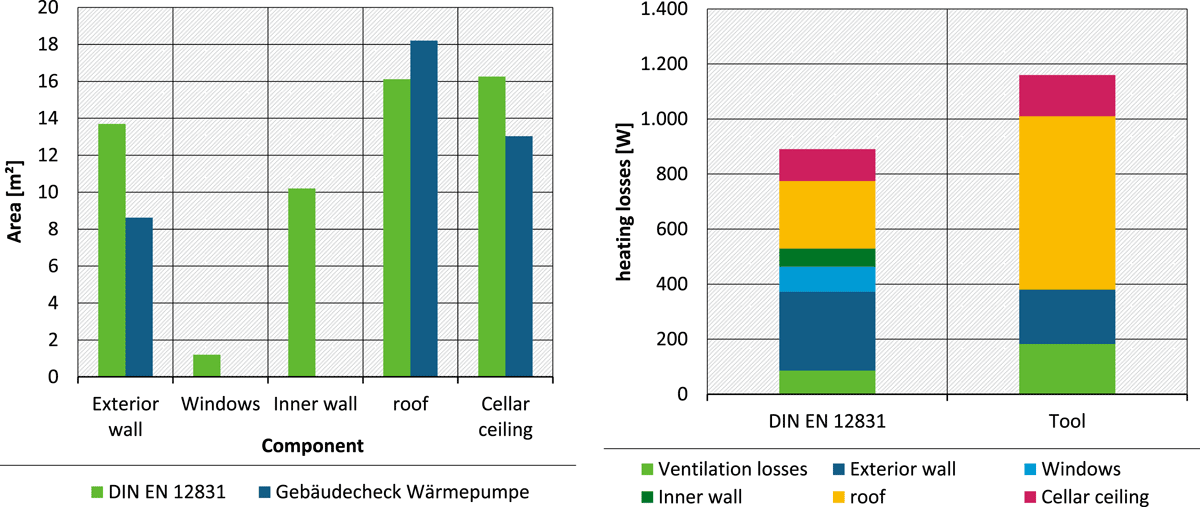
Figure 11
Gross component area (left) and heat losses (right) from DIN EN 12831 calculation and “Gebäudecheck Wärmepumpe” assessment for bathroom in building “dormer”.
Across both example buildings, attic rooms perform well for geometrically straightforward configurations, with typical deviations around ±20%. The most pronounced deviations arise in rooms with small dormers, where the generalised loss factor introduces both simplicity and uncertainty, and in rooms adjoining spaces at substantially different temperatures, as illustrated by the bathroom case.
Standard floor rooms, by contrast, require no geometric approximation and are reproduced with high accuracy. Given their higher share and accuracy, the total deviation across a full building assessment is considerably lower, which puts the attic-room deviations into perspective.
The comparison itself carries inherent uncertainty: component areas in the DIN EN 12831 reference calculations are derived from plans and subject to their own measurement and interpretation errors, potentially contributing to the observed deviations.
As a user-centred tool, the input scope is deliberately limited to data that non-expert users can realistically provide, prioritising accessibility over exhaustive data collection. A review of comparable professional tools indicates that even fee-based planning software does not necessarily capture more geometric detail for attic rooms than implemented here, suggesting that accuracy under user-provided input is inherently bounded.
Market reception
The tool was launched on 17 December 2025 and promoted via social media and newsletters, mainly by members of the project consortium (see Acknowledgement) and the German Federal Environment Agency. Owing to several DDoS attacks on the ifeu website, consistent click and page impression figures are not available since launch. An analysis was therefore conducted using Google Search Console, which was activated for the tool on 21 January 2026; the figures below apply only from that date. Until 6 March 2026, the tool gained 16,942 impressions and 2,082 clicks.
99% of clicks and 91% of impressions came from IP addresses in Germany; 4% of impressions came from abroad and may originate from the DDoS attacks. 37% of impressions were generated by searches for “heat pump” and a further 22% by searches for the tool name (“Gebäudecheck Wärmepumpe”) or variants. Clicks came mainly from PCs (45%) and mobile phones (40%), impressions from PCs (52%) and mobile phones (44%). Tablets account for a minor share of clicks (9%) and impressions (4%). This equals an average click-through rate (CTR) of 14.5%, peaking in late January and mid-February.
SEO specialist Sistrix analysed 80 million keywords and derived CTR benchmarks by search type (Beus 2020). For sitelinks searches, first-ranked results showed an average CTR of 47%, dropping sharply for second-ranked results (14%). Against these benchmarks, the tool’s CTR can be rated good: users searching for it have a high chance of finding it, and impressions translate into clicks.
Figure 12 shows impressions, clicks and CTR over the analysed period. Clicks and CTR peak in the week of 26–31 January 2026, impressions a few days later as a result. These peaks followed immediately after the tool was mentioned in the Federal Ministry of Economic Affairs and Energy’s newsletter on energy transition topics. The tool was also mentioned in various online and print articles.
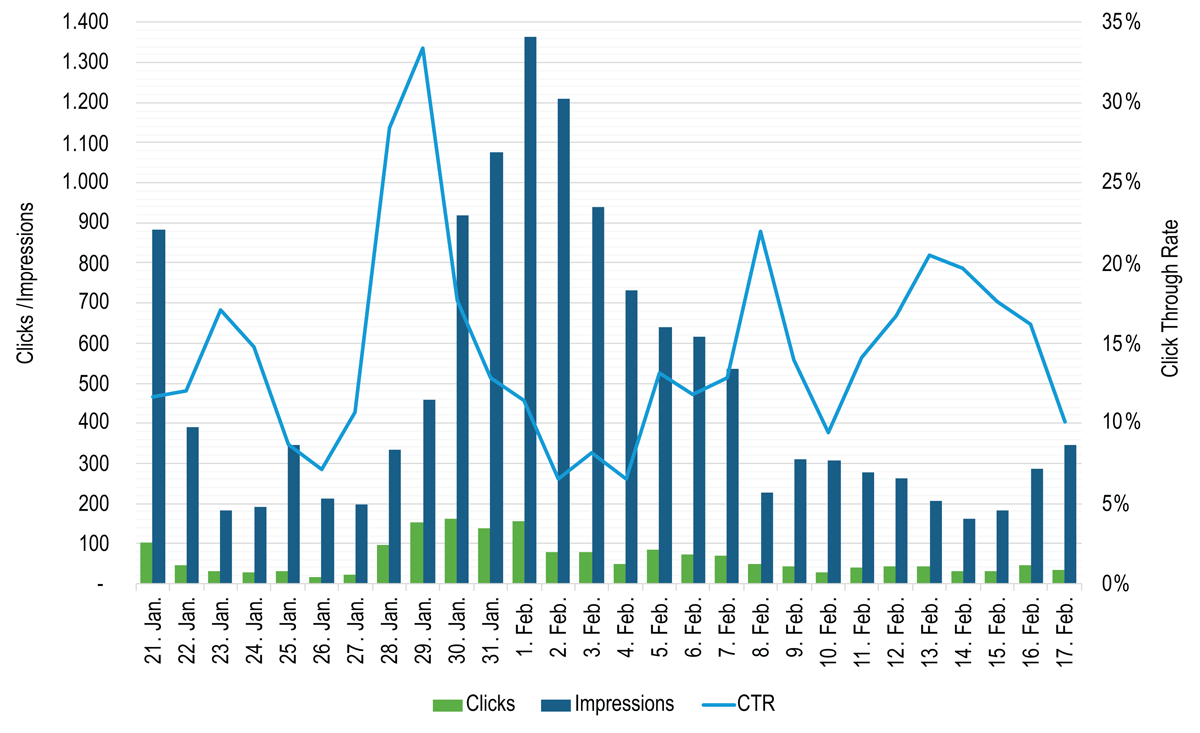
Figure 12
Google Search CTR values for the online tool “Gebäudecheck Wärmepumpe”.
Media coverage generated substantial use of the tool and, with it, user enquiries: around 70 emails with questions and remarks were received. They indicate that non-professional users are both able and willing to engage in the required detailed data collection, particularly where questions are phrased in simple, intuitive terms and require no prior technical knowledge. Users also appear more engaged where the purpose and background of each input parameter are clearly explained.
Conclusion
To address the early-stage decision barrier ahead of a planned heating system replacement, the open-source web application Gebäudecheck Wärmepumpe (English: “building heat pump check”) was developed. It closes a critical gap in heat pump adoption: building owners must decide on heating system replacement before professional planning begins, yet accessible self-assessment tools with sufficient technical depth have been lacking. By combining a simplified DIN EN 12831 heating load calculation with radiator output assessment at 55°C, the tool enables non-experts to evaluate their building’s heat pump suitability at room level and to identify targeted measures.
This room-level perspective mirrors how building owners actually decide, translating complex thermodynamic relationships into understandable indicators and actionable recommendations. It allows owners to explore trade-offs between radiator replacement and envelope retrofit, understand their building’s characteristics and enter professional planning with a better-informed starting point.
The plausibility assessment confirms high calculation accuracy for standard floor rooms. For attic rooms, geometric simplifications introduce average deviations of ±20%, with larger deviations for rooms with small dormers or strongly inhomogeneous temperatures. TABULA U-value assumptions agree well for most components and construction periods; targeted corrections were applied for roofs, ceilings and windows in periods with systematic deviations. Analysis of 191 DIN EN 12831 datasets confirms that buildings with poorer thermal performance show more pronounced inequality in room-level heating loads.
Future work could provide systematic validation against a larger dataset, allowing attic room approximations to be refined with minimal additional input. Optional interior wall recording and user-defined U-values would improve accuracy for inhomogeneous buildings. Extending the assessment beyond 55°C to report the nominal flow temperature for full coverage would add guidance, pending implementation of an iterative calculation. A more comprehensive data export, including tabulated background values such as assumed U-values, would strengthen the interface with downstream planning trades. As an open-source tool, the Gebäudecheck Wärmepumpe is available for further development by third parties, supporting broader heat pump adoption.
Additional File
The additional file for this article can be found as follows:
Display session poster
Poster relating to this article. DOI: https://doi.org/10.66506/essp.1-118-26.s1
Acknowledgements
We thank the German Environment Agency (Umweltbundesamt, UBA) for its substantive guidance throughout the project; our project partners Markus Heckmann for his expertise in professional heating load calculation and co2online for their knowledge in developing, disseminating and evaluating user-oriented online tools; and the project’s advisory board for its critical review of the tool and constructive support throughout its development.
eceee paper ID
1-118-26