
1. Introduction
The hospitality and catering industry, collectively referred to as the HORECA sector, is a significant contributor to energy consumption and greenhouse gas (GHG) emissions. European hotels and restaurants account for approximately 2–3% of final national energy demand, with laundry services representing one of the most energy-intensive support activities within hotels, spas, and catering operations. A standard mid-size hotel generating 200–400 kg of linen daily may require multiple washing and drying cycles, resulting in substantial electricity, thermal energy, and water consumption. Consequently, outsourced urban laundries serving HORECA customers represent an important node in the decarbonisation of the hospitality value chain (Marchi et al., 2024), and offer significant opportunities for improving environmental performance and reducing operational emissions (Marchi and Zanoni, 2017).
Commercial laundry operations are characterised by the intensive and simultaneous use of thermal, electrical, and hydraulic resources. Thermal energy, primarily required for water heating and drying processes, typically accounts for 60–80% of total energy consumption in facilities equipped with gas-fired systems. Previous studies have reported energy intensities ranging from 0.3–0.8 kWh of electricity and 0.2–0.5 kWh of thermal energy per kilogram of processed linen, depending on equipment characteristics, loading conditions, and operating practices (Pakula and Stamminger, 2010; Laitala et al., 2011; Kruschwitz et al.,2014). Given the energy-intensive nature of these activities, improving the efficiency and sustainability of commercial laundry services can contribute significantly to the decarbonisation of the broader HORECA supply chain.
The transition towards low-carbon technologies is further supported by evolving European policy frameworks. The Fit for 55 package (European Commission, 2021a), the revised Renewable Energy Directive (RED III) (Directive (EU) 2023/2413), and the Energy Efficiency Directive (EED 2023/1791) establish ambitious targets for reducing greenhouse gas emissions and increasing renewable energy deployment. In addition, the Corporate Sustainability Reporting Directive (CSRD, 2022/2464) extends sustainability reporting requirements across value chains, increasing attention towards indirect emissions associated with outsourced services such as commercial laundry operations. These developments create both regulatory pressure and strategic opportunities for small and medium-sized enterprises operating in energy-intensive service sectors. Among the available decarbonisation options, heat pumps (HP) and photovoltaic (PV) systems are considered among the most readily deployable technologies. Heat pumps can displace fossil gas consumption for water heating, which typically represents over 80% of the thermal energy budget of a gas-fired dryer fleet. At the same time, PV can offset purchased electricity for washing machines, ancillary equipment, and HP operation. However, investment decisions in small commercial laundries remain challenging due to (i) high upfront capital requirements relative to thin operating margins; (ii) lack of multi-dimensional environmental performance data to support business cases; (iii) uncertainty over energy price trajectories and technology performance; and (iv) absence of rigorous combined economic and Life Cycle Assessment (LCA) analysis tailored to their operational context.
LCA is widely recognised as a robust methodology for evaluating the environmental performance of products, services, and technologies. Previous LCA studies of laundry operations have predominantly focused on domestic washing machines, with particular attention to the role of detergent chemistry, water temperature, and electricity source (Pakula and Stamminger, 2010; Laitala et al., 2011). Several studies have confirmed that operational energy dominates the life cycle impact of laundry appliances (typically 70–85% of GWP), with machine manufacturing contributing 5–15% and detergents 5–20% depending on system boundary and product category (Pakula and Stamminger, 2010). For gas-fired commercial dryers, natural gas combustion can represent over 90% of GWP per functional cycle. Studies investigating PV systems have generally reported short environmental payback periods (1.5–4 years for GWP in central European climates, with southern European locations with higher irradiance achieving break-evens as short as 0.8–1.5 years) and significant reduction in climate change impacts, particularly in regions with high solar irradiation (Beccali et al., 2012; Frischknecht et al., 2015; Frischknecht et al., 2020). Similarly, heat pump assessments have demonstrated substantial environmental benefits when operating within increasingly decarbonized electricity systems, although performance remains strongly dependent on electricity carbon intensity and system efficiency (BIO Intelligence Service, 2012; Greening and Azapagic, 2012; Famiglietti et al., 2022).
While conventional LCA provides a comprehensive environmental assessment, it does not explicitly account for the timing of environmental impacts. This limitation becomes particularly relevant when comparing technologies characterized by higher manufacturing impacts but lower operational emissions, such as PV systems and HP, with conventional fossil-fuel-based alternatives. Discounted LCA (DLCA) has been proposed as an extension of traditional LCA capable of incorporating the temporal dimension of environmental impacts through the application of a Social Discount Rate (SDR) (Levasseur et al., 2010). This approach enables a more consistent comparison between upfront environmental burdens and future operational benefits, an approach particularly suited to the assessment of capital-intensive technologies with front-loaded manufacturing burdens (Levasseur et al., 2010; Hellweg et al., 2003).
Despite growing academic interest in environmental assessment methodologies and energy transition strategies, limited evidence is available regarding small urban commercial laundries serving the HORECA sector. In particular, studies combining monitored operation data, detailed life cycle assessment, economic appraisal, and discounted environmental analysis within a unified framework remain scarce. Furthermore, while domestic laundry LCA is well-established (Pakula and Stamminger, 2010; Laitala et al., 2011; Kruschwitz et al.,2014), studies addressing professional coin-operated HORECA laundry facilities are scarce, and the interaction between PV generation and HP electrification in this operational context has not been assessed in the peer-reviewed literature.
To address these gaps, this study presents a comprehensive environmental and economic assessment of alternative decarbonisation pathways for a commercial laundry facility located in northern Italy. Based on twelve months of monitored utility consumption data, the study evaluates the environmental and economic performance of PV and HP technologies under different investment scenarios. The methodological combination adopted is motivated by three considerations. First, ISO 14044-compliant LCA across 18 midpoint categories is used rather than a single GHG metric because energy transition pathways involving HP and PV technologies entail burden-shifting across multiple impact categories, notably from climate change to toxicity and resource depletion, which a carbon-only analysis would conceal. Second, the DLCA extension is adopted because the manufacturing burden of capital-intensive technologies is concentrated at installation (t = 0), while operational benefits accrue over 15–25 years; a static LCA therefore systematically overstates the net environmental burden at the time of the investment decision. Third, the SDR is derived via a PESTEL framework rather than assumed arbitrarily, because the appropriate rate depends on the economic, regulatory, and risk context of the project, and a structured multi-criteria derivation provides transparency and reproducibility that an assumed rate does not.
The study is guided by three research questions: (RQ1). What is the environmental performance of PV and HP energy transition pathways for a commercial coin-operated laundry facility, assessed across a comprehensive set of LCA midpoint categories? (RQ2). What are the temporal dynamics of environmental break-even under a DLCA framework, and how sensitive are these to the choice of SDR? (RQ3). Under what conditions are these pathways economically viable, and which combined scenario offers the most favourable joint environmental-economic outcome? The specific contributions of this work are: (i) machine-level consumption disaggregation from twelve months of monitored operational data; (ii) separate LCA of washing and drying operations across multiple scenarios and environmental impact categories; (iii) comprehensive economic evaluation using standard investment indicators; (iv) application of a DLCA framework using a PESTEL-derived SDR; and (v) assessment of the standalone and combined deployment of HP and PV technologies in commercial laundry operations.
2. Methodology
2.1 System Description and Data Collection
The case study facility is a commercial coin-operated laundromat located in Brescia, northern Italy, operating daily from 07:00 to 23:00. The facility serves both private customers and HORECA supply chain clients. The machine fleet comprises thirteen appliances: five front-loading washing machines (capacities: 10, 13, 16, 20, and 25 kg), six gas-fired rotary dryers (capacities: 16, 23, and 35 kg across three size classes, plus one 35 kg unit), one pet-grooming washing machine (10 kg, electrically heated), and one pet-grooming gas dryer. The total annual cycle count is 35,772 cycles per year, comprising 11,596 washing cycles and 24,176 drying cycles for the reference year considered. This value is representative of typical annual operation, with only marginal variations observed across the other years analysed.
Utility consumption was monitored using monthly invoices, including electricity (single-phase supply, metered monthly), natural gas (monthly meter readings), and water (quarterly municipal billing), over the period May 2024–April 2025. Annual consumption amounted to 17,524 kWh of electricity from the grid, 10,888 Sm3 of natural gas (equivalent to 114,853 kWh, LHV basis), and 1,787 m3 of water. Based on prevailing tariffs, annual energy costs were €6,996 for electricity (average unit cost €0.400/kWh, including standing charges and energy component), €14,255 for natural gas (average €1.300/Sm3), and €5,461 for water, resulting in a total energy expenditure of €21,252 per year. This corresponds to 14.7% of total facility turnover (€144,766/year). The remaining cost structure comprises rent (€14,400; 9.9%), detergents (€7,060; 4.9%), and miscellaneous expenses (€3,000; 2.1%), while labour accounts for the residual share (€93,594; 64.7%).
A bottom-up consumption disaggregation model was developed to allocate total metered utility consumption to individual machines. Machine-level parameters, including cycle duration, rated electrical power from manufacturer datasheets, gas consumption per cycle from technical specifications calibrated against meter readings, and water consumption per cycle from equipment documentation, were combined with estimated annual cycle frequencies derived from operational usage logs. Electricity and gas consumption were reconstructed using calibrated load factors. For drying operations, natural gas consumption was estimated from dryer rated thermal capacities, cycle durations, and calibrated load factors. The remaining gas consumption was attributed to hot-water production for washing operations and distributed among washing machines according to their estimated hot-water demand, based on water consumption per cycle and annual cycle frequency. Load factors were subsequently calibrated iteratively to ensure consistency with total annual utility consumption. It is acknowledged that the iterative load factor calibration is not uniquely determined: in principle, alternative combinations of per-machine load factors could reproduce the same aggregate totals. No independent sub-metering data were available to validate individual machine estimates. The practical impact on the LCA scenario comparisons is limited because results are driven by aggregate gas and grid electricity substitution, which are metered directly; the machine-level allocation affects only the baseline characterization, not the relative scenario rankings.
The remaining electricity demand (5,287 kWh/year) was attributed to fixed facility loads, including HVAC systems (2,725 kWh/year for cooling and 1,670 kWh/year for heating), as well as lighting, point-of-sale equipment, a coffee machine, and monitoring instrumentation. A detailed breakdown of the resulting machine-level energy, water consumption, and cost estimates derived from the disaggregation model is reported in Table 1, which summarises annual per-machine consumption values and associated operational metrics for the monitoring period (May 2024–April 2025). To preserve commercial confidentiality, all operational, financial, and technical data were anonymised and aggregated prior to analysis, preventing attribution of the reported results to a specific business entity.
Table 1
Annual per-machine consumption estimates disaggregated from utility monitoring (May 2024–April 2025).
| MACHINE ID | CAPACITY (kg) | CYCLES/YEAR | ELECTRICITY (kWh/y) | GAS (Sm3/y) | WATER (m3/y) | COST/CYCLE RANGE (€) |
|---|---|---|---|---|---|---|
| W-5 | 10 | 2,121 | 680 | 359 | 212 | 0.21–0.29 |
| W-6 | 13 | 2,213 | 710 | 374 | 221 | 0.21–0.31 |
| W-7 | 16 | 2,161 | 1,387 | 621 | 367 | 0.29–0.46 |
| W-8 | 20 | 2,315 | 1,485 | 665 | 394 | 0.29–0.50 |
| W-9 | 25 | 2,051 | 1,795 | 763 | 451 | 0.35–0.62 |
| W-16 (pet) | 10 | 735 | 221 | 99 | 59 | 0.21–0.30 |
| D-10 | 23 | 2,123 | 1,030 | 1,560 | — | 0.45–1.15 |
| D-11 | 23 | 1,627 | 390 | 791 | — | 0.45–0.97 |
| D-12 | 16 | 3,928 | 825 | 1,115 | — | 0.37–0.62 |
| D-13 | 16 | 5,464 | 832 | 1,125 | — | 0.37–0.62 |
| D-14 | 16 | 3,962 | 832 | 1,125 | — | 0.37–0.62 |
| D-15 | 16 | 6,563 | 1,378 | 1,864 | — | 0.37–0.62 |
| D-17 (pet) | 16 | 509 | 356 | 0 | — | 0.28–0.45 |
| Fixed loads | — | — | 5,287 | 0 | 83 | — |
| TOTAL | — | 35,772 | 17,524 kWh | 10,888 Sm3 | 1,787 m3 | — |
2.2 Scenario Definition
Four scenarios are evaluated in this study:
S0 – Baseline: current operating conditions relying on Italian grid electricity and natural gas–fired dryers, with no renewable energy investment considered.
S1 – PV (12 kWp): installation of a 12 kWp rooftop crystalline silicon photovoltaic system. The system is estimated to generate 15,757 kWh/year based on PVGIS-SARAH3 data (2023) (tilt 38°, azimuth +5°, system losses 14%). Total investment cost is €14,500, including installation. Surplus electricity is exported to the grid at €0.07/kWh, while fixed grid connection charges of €112/month are maintained.
S2 – PV + HP (18 kWp + 6 kW HP): combined deployment of an 18 kWp PV system and a 6 kW air-to-water heat pump (COP = 3.3), replacing gas-based water heating in the drying process. Total investment is €33,500 (€20,000 for PV and €13,500 for the heat pump). The heat pump lifetime is assumed to be 15 years, requiring replacement at year 15 with an equivalent unit at an assumed nominal replacement cost of €13,500 (same as initial investment, no real cost escalation assumed), discounted to present value at the applicable SDR in the NPV calculation, while the PV system lifetime is 30 years.
S3 – HP only (no PV): installation of a 6 kW heat pump operating exclusively on grid electricity, without on-site renewable generation. Total investment cost is €13,500. This scenario is included to isolate and assess the standalone viability of heat pump electrification.
2.3 Life Cycle Assessment
LCA was conducted in accordance with ISO 14040 and ISO 14044 standards. The functional unit was defined separately as (i) one washing cycle at average machine loading and (ii) one drying cycle at average machine loading. Two separate functional units are used rather than a single per-kg-linen unit because washing (electricity-dominated) and drying (gas-dominated) have structurally distinct impact profiles; a combined unit would obscure this asymmetry. The choice is consistent with the scenario design, in which PV and HP affect washing and drying differently. System boundaries follow a cradle-to-gate approach for direct material and energy inputs, including Italian grid electricity (ecoinvent v3.9 market for electricity, medium voltage, IT) (Wernet et al., 2016), natural gas combustion (ecoinvent v3.9, natural gas combustion), machine manufacturing (generic commercial washing machine and tumble dryer datasets from ecoinvent v3.9, allocated per cycle over a 15-year lifetime), detergent use (0.075 kg per washing cycle) and fabric softener (0.040 kg per cycle), laundry sanitizer (0.020 kg per cycle), municipal water supply and wastewater treatment, and transport of consumables. The ecoinvent v3.9 database used for consumable are: detergent – ‘Soap, at plant’ (RER); fabric softener – ‘Textile softener, liquid, at plant’ (RER); laundry sanitizer – ‘Disinfectant, at plant’ (RER); water supply – ‘Tap water, at user’ (IT); wastewater – ‘Wastewater, average, unpolluted’ (IT). For scenarios S1 and S2, the inventory was expanded to include the manufacturing of the photovoltaic system (crystalline silicon modules, aluminium mounting structure, and inverter) and the heat pump system (copper, steel compressor components, and refrigerant R32), based on ecoinvent v3.9 datasets and allocated over assumed lifetimes of 30 years for PV and 15 years for the heat pump. The impact assessment was performed using the ReCiPe 2016 Midpoint (H) v1.09 method (World, 2010 H), covering 18 midpoint impact categories.
2.4 Discounted LCA and Social Discount Rate Derivation
The Discounted LCA framework applies a Social Discount Rate to future environmental impact flows in analogy with financial discounting. The core argument for discounting in LCA is that future environmental impacts are less certain and less immediately harmful than present-period impacts; a ton of CO2 avoided in year 20 may be less valuable than a ton avoided today if technology or policy conditions change. Conversely, discounting can be criticised for systematically undervaluing long-term environmental costs such as climate damage (Hellweg et al., 2003). The SDR choice is therefore a critical methodological decision that should be derived from transparent, context-specific criteria rather than arbitrary selection.
The appropriate value of the SDR is itself the subject of a longstanding debate in welfare economics. Low-rate positions, most prominently advanced by Stern (2007), argue that discounting future environmental damages at market rates is ethically indefensible when long-term harms such as climate change are concerned, and advocate for rates in the range of 1.4–2.5%. Higher-rate positions, notably those of Nordhaus (2008) and the DICE model tradition, hold that market-observed rates better reflect empirical time preferences and opportunity costs of capital, yielding SDRs of 4–7%. Intermediate approaches, including the gamma discounting framework proposed by Weitzman (2001), suggest that deep uncertainty over the appropriate rate justifies a declining discount rate over long time horizons. In the specific context of LCA, Hellweg et al. (2003) examined the ethical and economic arguments for and against discounting future environmental impacts, concluding that discount rates close to zero may be more appropriate when intergenerational equity is prioritised, a conclusion broadly consistent with low-rate welfare-economic positions. The three-point sensitivity analysis conducted in this study at r = 3%, 5%, and 8% is designed to bracket the range of positions represented in this debate, ensuring that the conclusions drawn from the DLCA are robust across the spectrum from Stern-type to Nordhaus-type discount philosophies.
The PESTEL (Political, Economic, Social, Technological, Environmental, Legal) framework provides a structured multi-criteria basis for SDR derivation that incorporates stakeholder-relevant risk dimensions. Previous applications of PESTEL-based SDR in LCA contexts have proposed rates ranging from 2.5% to 9%, broadly consistent with the European Commission’s recommended social discount rate of 3–5% depending on Member State context, and standard practice of testing alternative discount rates in sensitivity analysis (European Commission, 2021b). The present study applies this framework to the specific context of Italian urban commercial laundry investment, contributing a sector-specific PESTEL-derived SDR estimate to the literature. A recent application of the PESTEL framework to energy investment appraisal in power generation contexts is provided by Paravano et al. (2025), who demonstrate its utility in deriving context-specific social discount rates for Italian infrastructure projects, further validating the approach adopted in the present study. The sub-rate assigned to each PESTEL dimension follows a four-level ordinal scale anchored to the European Commission Better Regulation Toolbox (European Commission, 2021b) reference range of 3–8%: low risk = 3.5%; low-moderate risk = 4.5%; moderate risk = 5–6%; high risk = 7–7.5%.
The DLCA framework weights annual LCA impact flows with a time-discounting factor (1 + r)–t, where r is the Social Discount Rate and t is the year of impact occurrence, summed over the 25-year assessment horizon. The PESTEL-based SDR derivation considered six dimensions, each assigned a sub-component rate reflecting current Italian and EU conditions:
Political (P): EU energy policy stability, commitment to RED III and ETS extension – assessed as low political risk → sub-rate 3.5%.
Economic (E): Italian energy price volatility, general inflation, risk-free rate (~3.5% ECB corridor) – moderate-high risk → sub-rate 6.0%.
Social (S): Public health sensitivity to air quality (PM2.5, NOx), public support for energy transition – moderate urgency → sub-rate 5.0%.
Technological (T): Grid decarbonisation trajectory (Italian electricity mix projected to reach a majority renewable share by 2030 under current PNIEC scenarios), HP and PV learning curves – low-moderate risk → sub-rate 4.5%.
Environmental (E): Social cost of carbon (€130–180/tCO2 range cited in EU ETS), ecosystem tipping point risk – high urgency → sub-rate 7.5%.
Legal (L): EU ETS expansion to buildings/transport (ETS2, 2027), CSRD compliance requirements – moderate-high risk → sub-rate 7.0%.
Weighted equally, these sub-rates yield a composite PESTEL SDR of 5.58% (Table 2), rounded to r = 5% for the base case analysis, consistent with European Commission guidance (3–8% range). Sensitivity analyses were conducted at r = 3%, r = 5%, and r = 8%.
Table 2
PESTEL-derived SDR derivation matrix.
| PESTEL DIMENSION | RISK/URGENCY ASSESSMENT | RISK LEVEL | SUB-RATE (%) | WEIGHT |
|---|---|---|---|---|
| Political (P) | EU energy policy stability (RED III, ETS2, Fit for 55); Italian regulatory framework | Low | 3.5% | 1/6 |
| Economic (E) | Italian energy price volatility; gas-electricity price ratio; ECB reference rate 3.5%; SME access to capital | Moderate-High | 6.0% | 1/6 |
| Social (S) | Public health urgency (PM2.5, NOx); public support for energy transition; HORECA sector awareness | Moderate | 5.0% | 1/6 |
| Technological (T) | Grid decarbonisation rate; HP/PV learning curves; ecoinvent inventory update cycles | Low-Moderate | 4.5% | 1/6 |
| Environmental (E) | Social cost of carbon (€130–180/tCO2); climate tipping points; R32 refrigerant end-of-life | High | 7.5% | 1/6 |
| Legal (L) | EU ETS2 (from 2027); CSRD Scope 3 obligations; Energy Efficiency Directive (EU) 2023/1791 | Moderate-High | 7.0% | 1/6 |
| Composite SDR | Arithmetic mean of six equal-weighted sub-rates | – | 5.58% | – |
The equal-weighting assumption is acknowledged as a simplification; alternative weighting schemes (e.g., principal-component weighting, expert-elicitation weights) could yield a different composite rate, which is why the three-point sensitivity analysis at r = 3%, 5%, and 8% is central to the interpretation of results rather than supplementary. The choice to apply a unified SDR to both the environmental DLCA discounting and the financial NPV analysis merits explicit justification: under a social welfare framework, the SDR reflects society’s time preference for both monetary and environmental outcomes, and applying a common rate ensures methodological coherence between the two assessment streams. This is consistent with the approach recommended in the European Commission Better Regulation Toolbox (European Commission, 2021b) and with the broader DLCA literature (Hellweg et al., 2003). Where a decision-maker holds a different view on the appropriate rate for environmental discounting, the sensitivity results at r = 3% and r = 8% bracket the plausible range. The 25-year assessment horizon was chosen to match the design life of the photovoltaic system (the longest-lived technology in the portfolio); impacts and cash flows associated with the heat pump (15-year lifetime) assume one replacement cycle within the horizon, the capital cost of which is included in the scenario S2 and S3 cash flows.
3. Results
3.1 Baseline Energy Profile and Seasonal Patterns
The monitored baseline reveals a strongly gas-dominated energy cost structure. Natural gas for drying constitutes 67.1% of total energy expenditure (€14,255/year), while grid electricity accounts for 32.9% (€6,996/year). Within the electricity budget, the five washing machines and one pet washer collectively consume 12,237 kWh/year (69.8% of metered electricity), with fixed facility loads (HVAC, lighting, POS) consuming the remaining 5,287 kWh/year (30.2%). Average cost per washing cycle ranges from €0.21 (small 10 kg washer, short programme) to €0.62 (25 kg HORECA machine, full thermal cycle). Average cost per drying cycle ranges from €0.37 to €1.15, with the highest-capacity gas dryer (D-10, 23 kg) exhibiting the highest unit cost.
Figure 1 presents the monthly energy balance comparing electricity consumption against PV production under S1 (12 kWp) and S2 (18 kWp). The seasonal asymmetry is pronounced: PV production peaks in May–June (1,628–1,679 kWh/month for S1; 2,468–2,554 for S2) while electricity demand peaks in July–August (1,814–2,054 kWh/month) due to air conditioning and elevated customer volumes. Under S1, net surplus months are limited to May, June, March, and April; deficits occur in all other months. Under S2, the 18 kWp array extends the surplus window and nearly eliminates net grid purchases in May, June, March, and April, while substantially reducing the deficit in July–August by approximately 45% compared to S0.
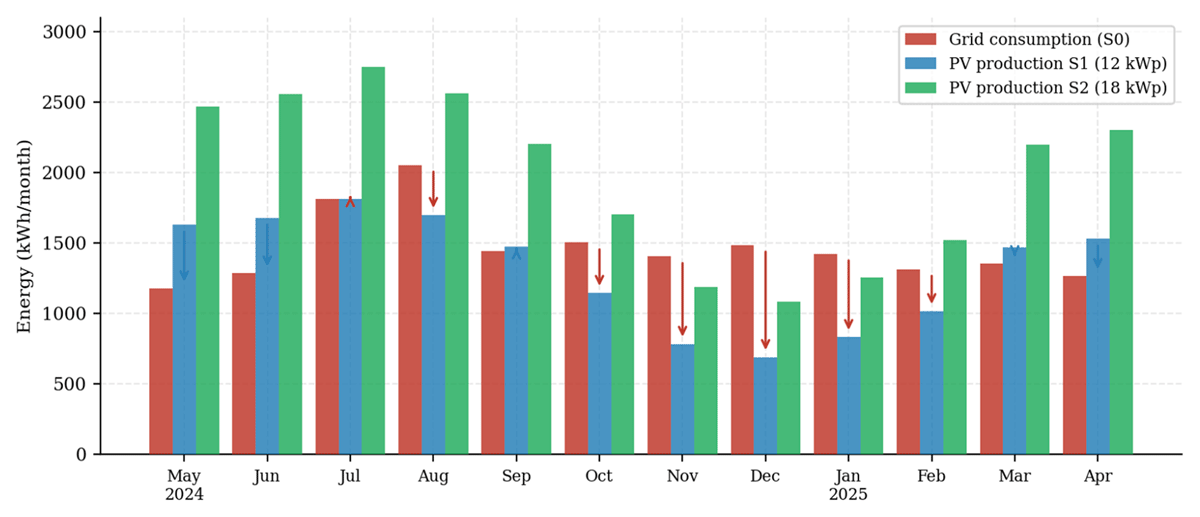
Figure 1
Monthly electricity consumption (S0 baseline) vs. PV production under S1 (12 kWp) and S2 (18 kWp). Arrows indicate net surplus (upward) and deficit (downward) periods for S1.
3.2 LCA Results: Washing Operations
Figure 2 compares GWP per cycle for washing and drying operations across all four scenarios, while Table 3 reports the full ReCiPe 2016 results for washing. The baseline washing cycle GWP of 0.816 kg CO2 eq is dominated by natural gas combustion (59.7% of total, from gas water heating shared with the dryer fleet), grid electricity (14.3%), detergents and softeners (10.8%), machine manufacturing (2.5%), and sanitizer (5.2%). The PV scenario (S1) reduces grid electricity to near-zero for the washing operation but leaves gas consumption unchanged, achieving only an 11.7% GWP reduction (0.720 kg CO2 eq). The HP-alone scenario (S3) eliminates gas from both washing water heating and dryer operation, achieving a 51.0% GWP reduction (0.400 kg CO2 eq). The combined S2 scenario achieves the maximum reduction of 66.5% (0.273 kg CO2 eq), with residual emissions principally from detergent supply chains (21.1%) and machine manufacturing (7.4%). The relative contribution of individual emission sources across scenarios is further detailed in the breakdown presented in Figure 3, which highlights the shift in dominant impact drivers following electrification measures.
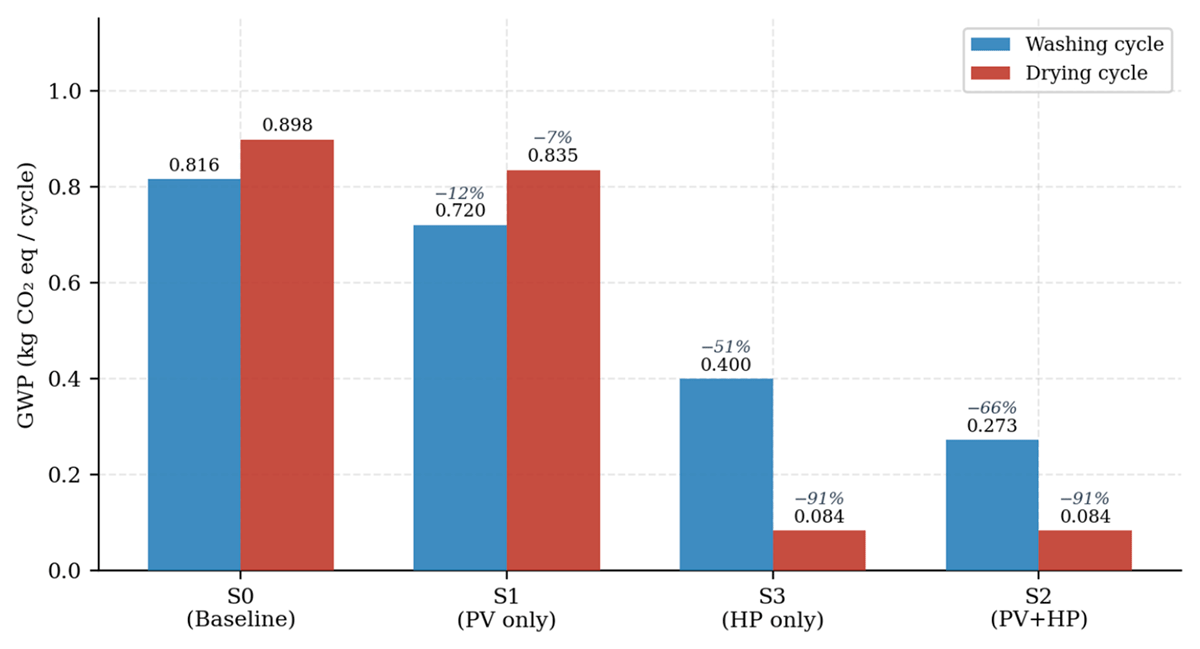
Figure 2
Global Warming Potential per cycle for washing and drying operations across all four scenarios. Percentage reductions relative to S0 baseline indicated above bars.
Table 3
Full ReCiPe 2016 Midpoint LCA results per washing cycle across all scenarios.
| IMPACT CATEGORY (UNIT) | S0 | S1 (PV) | S3 (HP ONLY) | S2 (PV+HP) | S0→S2 CHANGE (%) |
|---|---|---|---|---|---|
| Global warming (kg CO2 eq) | 0.8157 | 0.7200 | 0.3995 | 0.2730 | –66.5% |
| Stratospheric ozone depletion (kg CFC11 eq × 10–7) | 4.548 | 4.082 | 4.699 | 3.628 | –20.2% |
| Ionising radiation (kBq Co-60 eq × 10–2) | 3.085 | 1.923 | 11.790 | 1.728 | –44.0% |
| Ozone formation – health (kg NOx eq × 10–4) | 9.433 | 8.072 | 6.858 | 5.690 | –39.7% |
| Fine particulate matter (kg PM2.5 eq × 10–4) | 4.704 | 3.996 | 4.701 | 4.035 | –14.2% |
| Terrestrial acidification (kg SO2 eq × 10–3) | 1.208 | 0.984 | 1.236 | 0.984 | –18.5% |
| Freshwater eutrophication (kg P eq × 10–4) | 6.129 | 6.016 | 6.216 | 6.146 | –0.7% |
| Marine eutrophication (kg N eq × 10–4) | 6.718 | 6.710 | 6.673 | 6.665 | –0.8% |
| Terrestrial ecotoxicity (kg 1,4-DCB) | 7.408 | 7.188 | 6.492 | 6.374 | –14.0% |
| Freshwater ecotoxicity (kg 1,4-DCB × 10–2) | 4.542 | 4.176 | 6.997 | 5.571 | +22.6% ↑ |
| Marine ecotoxicity (kg 1,4-DCB × 10–2) | 6.338 | 5.865 | 9.163 | 7.420 | +17.1% ↑ |
| Human carcinogenic toxicity (kg 1,4-DCB × 10–1) | 1.293 | 1.240 | 1.051 | 0.976 | –24.5% |
| Human non-carcinogenic toxicity (kg 1,4-DCB × 10–1) | 7.601 | 7.107 | 9.902 | 8.400 | +10.5% ↑ |
| Land use (m2 a crop eq × 10–2) | 4.796 | 4.445 | 5.498 | 4.372 | –8.8% |
| Mineral resource scarcity (kg Cu eq × 10–3) | 2.219 | 2.081 | 2.717 | 2.200 | –0.9% |
| Fossil resource scarcity (kg oil eq × 10–1) | 2.848 | 2.524 | 1.111 | 0.820 | –71.2% |
| Water consumption (m3 × 10–3) | 8.557 | 7.213 | 15.322 | 8.284 | –3.2% |
| Ozone formation – ecosystems (kg NOx eq × 10–3) | 1.052 | 0.904 | 0.744 | 0.617 | –41.4% |
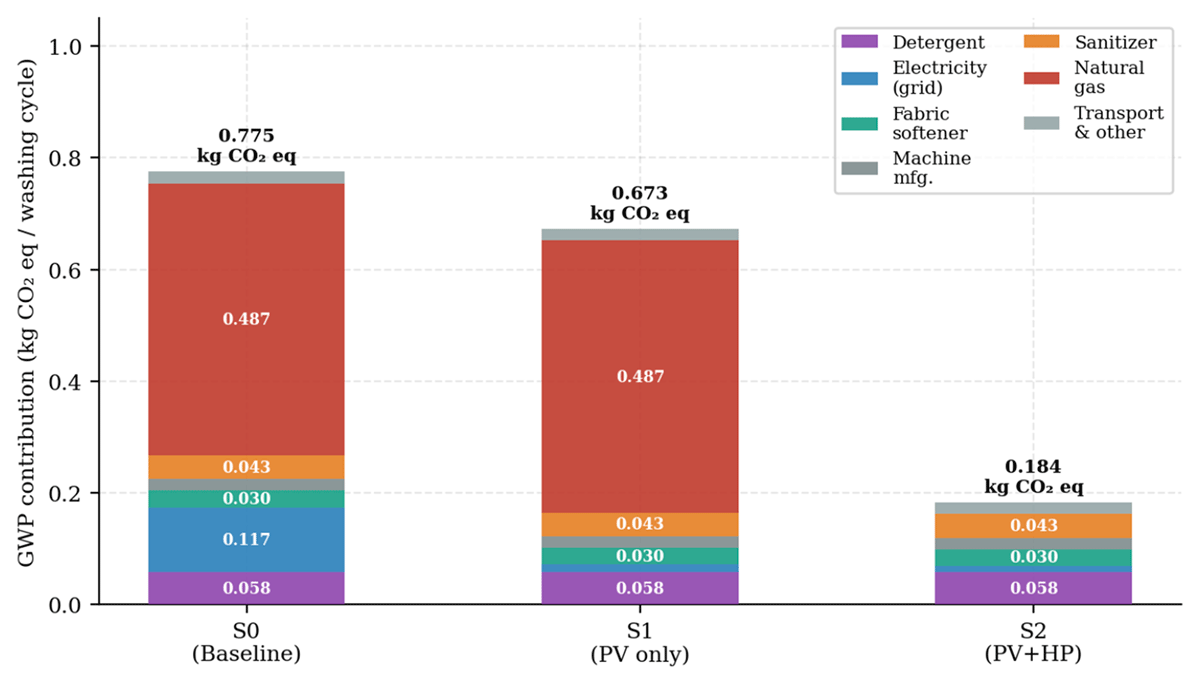
Figure 3
Stacked GWP contribution breakdown per washing cycle by emission source: S0 (baseline), S1 (PV only), and S2 (PV+HP). Values in kg CO2 eq per cycle.
Figure 4 presents a normalised radar plot of eight selected impact categories, providing a holistic multi-dimensional comparison across all scenarios. The S3 scenario (orange) reveals the burden-shifting associated with HP-only deployment: while GWP and fossil resource scarcity fall substantially, ionizing radiation increases to 3.82x baseline (driven by increased grid electricity demand from the Italian mix) and water consumption reaches 1.79x baseline (HP manufacturing and operation). The S2 scenario (green) occupies the smallest area across climate and resource indicators, confirming multi-criteria superiority over S0 and S1. The radar reveals an important nuance: for freshwater ecotoxicity, S2 exceeds S0 (normalised value ~1.23 vs. reference 1.0) due to HP manufacturing burden. This trade-off is visible in Table 3 and is discussed in Section 4.
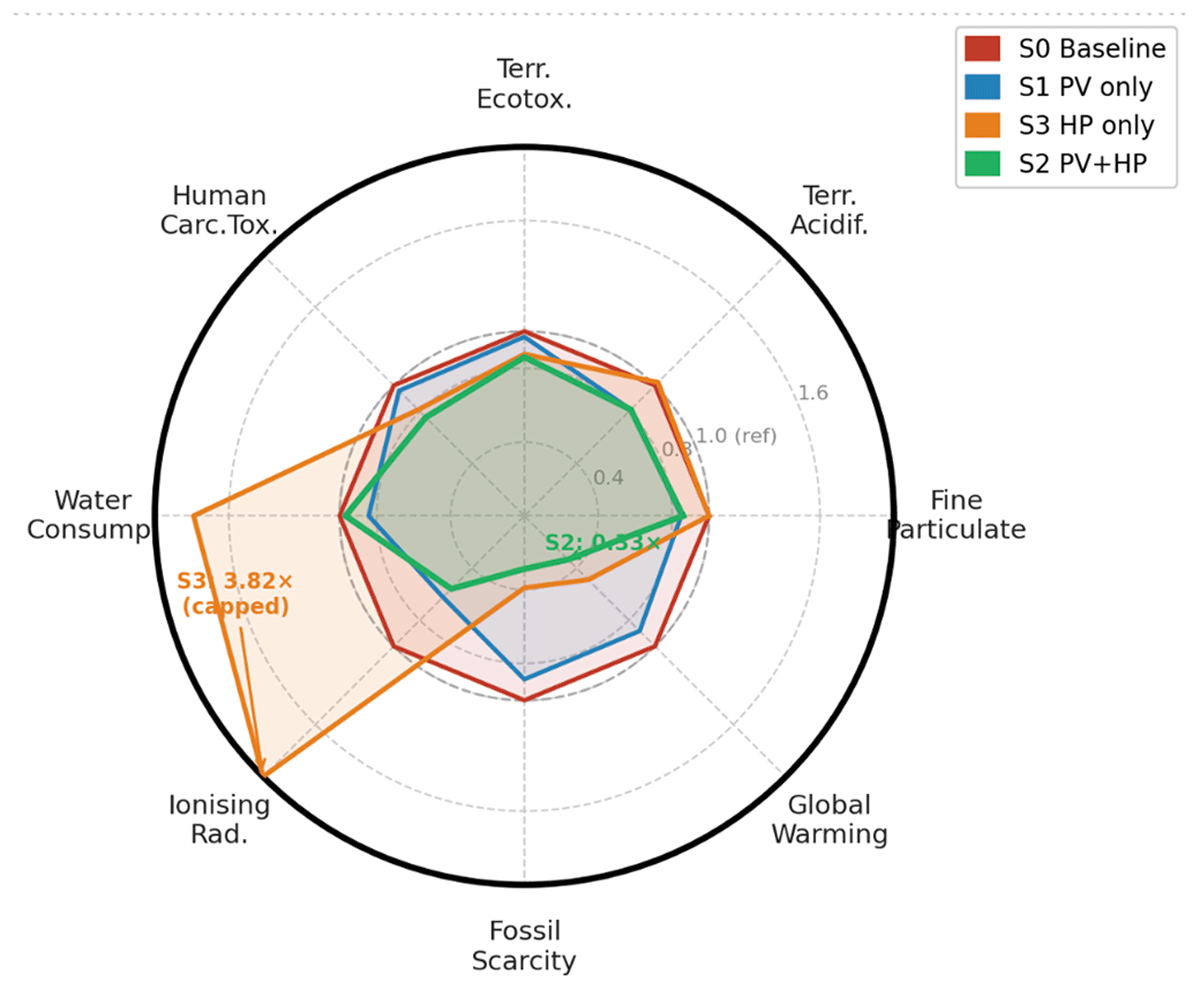
Figure 4
Normalised ReCiPe 2016 radar plot for eight impact categories (washing cycle). S0 = 1.0 reference. Values above 1.0 indicate higher impact than baseline; values below 1.0 indicate environmental improvement.
3.3 LCA Results: Drying Operations
Figure 5 illustrates the contribution of natural gas, grid electricity, and dryer manufacturing to the 18 ReCiPe 2016 midpoint categories under the baseline scenario (S0). The results reveal that the environmental profile of the drying process is largely driven by natural gas consumption, which dominates most impact categories. This finding is important for interpreting the effects of the technology scenarios, as the environmental benefits of PV integration are expected to be limited in categories primarily associated with thermal energy demand, whereas HP integration has the potential to substantially alter the impact profile through the replacement of natural gas. Table 4 reports the impact categories most relevant for discussing the environmental implications of the investigated technology scenarios.
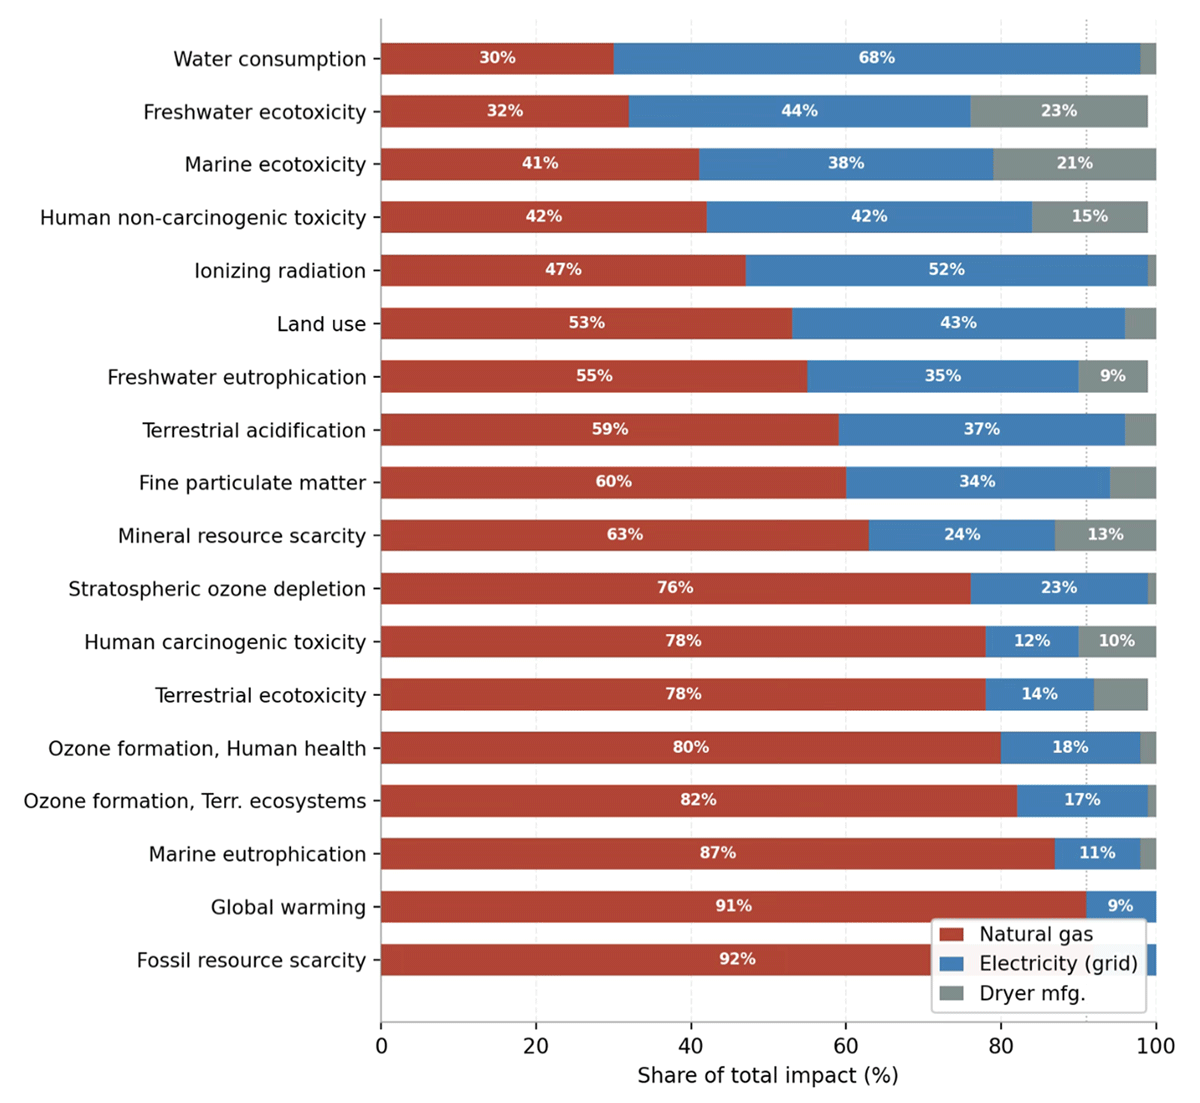
Figure 5
S0 baseline impact source breakdown per emission category – drying cycle (18 ReCiPe 2016 midpoint categories).
Table 4
LCA results per drying cycle: baseline and PV scenarios with natural gas contribution analysis.
| IMPACT CATEGORY | S0 BASE | S1 (+PV) | S3 (+HP) | S2 (+PV+HP) | S0→S1 CHANGE | S0→S3 CHANGE | S0→S2 CHANGE |
|---|---|---|---|---|---|---|---|
| Global warming (kg CO2 eq) | 0.8980 | 0.8354 | 0.3280 | 0.0840 | –7.0% | –63.5% | –90.6% |
| Fossil resource scarcity (kg oil eq) | 0.3269 | 0.3056 | 0.1275 | 0.0820 | –6.5% | –61% | –74.9% |
| Fine particulate matter (kg PM2.5 eq × 10–4) | 2.298 | 1.835 | 2.2965 | 1.9712 | –20.2% | –0.1% | –14.2% |
| Terrestrial acidification (kg SO2 eq × 10–4) | 5.784 | 4.318 | 5.9181 | 4.7115 | –25.3% | +2.3% | –18.5% |
| Terrestrial ecotoxicity (kg 1,4-DCB) | 3.888 | 3.744 | 3.4072 | 3.3453 | –3.7% | –12.4% | –14% |
| Water consumption (m3 × 10–3) | 2.119 | 1.240 | 3.7942 | 2.0514 | –41.5% | +79.1% | –3.2% |
| Human carcinogenic toxicity (kg 1,4-DCB × 10–1) | 7.187 | 6.842 | 5.8419 | 5.4250 | –4.8% | –18.7% | –24.5% |
| Ionising radiation (kBq Co-60 eq × 10–2) | 1.669 | 0.909 | 6.3784 | 0.9349 | –45.5% | +282.2% | –44% |
Table 4 presents the ReCiPe 2016 midpoint results for the drying cycle under the four technology scenarios. The results confirm that natural gas consumption is the principal environmental hotspot of the baseline configuration, accounting for 91.1% of baseline GWP. Consequently, the PV-only scenario (S1) produces only modest improvements, as dryers rely predominantly on thermal energy rather than grid electricity. In contrast, scenarios incorporating heat pump technology (S3 and S2) achieve substantial reductions across most impact categories due to the replacement of natural gas. The combined PV and HP configuration (S2) delivers the best overall environmental performance, reducing GWP from 0.898 to 0.084 kg CO2 eq per drying cycle (–90.6%) and fossil resource scarcity from 0.327 to 0.082 kg oil eq (–75%). The impact categories reported in Table 4 were selected because they provide the most meaningful differentiation among the technology scenarios and highlight environmental trade-offs that are not fully captured by climate-change indicators alone. Figure 6 presents a normalised radar for all four scenarios across the eight reported categories, providing a multi-dimensional visual comparison analogous to Figure 4 for the washing operation.
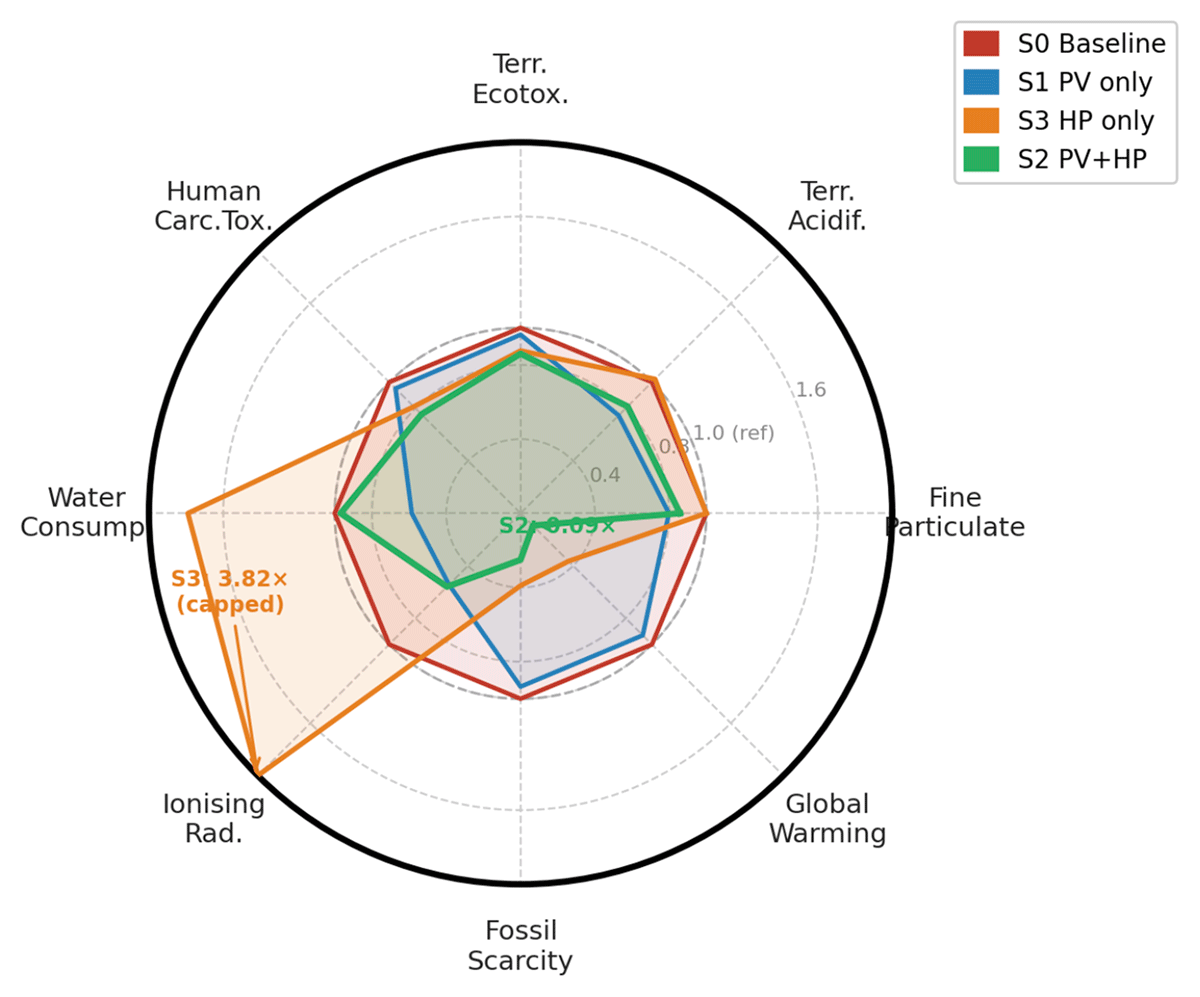
Figure 6
Normalised ReCiPe 2016 radar plot for eight impact categories (drying cycle). S0 = 1.0 reference. Values above 1.0 indicate higher impact than baseline; values below 1.0 indicate environmental improvement.
Annual CO2 emission reductions attributable to the full machine fleet under S2, combining washing and drying operations, are estimated at approximately 6,297 kg CO2/year from washers and 19,679 kg CO2/year from dryers, for a total of approximately 25,976 kg CO2/year. This corresponds to the annual emissions of roughly 9–10 average European passenger vehicles (EEA, 2023). By comparison, annual reductions under S1 are substantially lower, amounting to approximately 1,113 kg CO2/year from washers and 1,523 kg CO2/year from dryers, for a total of 2,636 kg CO2/year. These results highlight the dominant contribution of thermal energy substitution in the drying process, indicating that electrification via heat pumps, particularly when coupled with on-site renewable generation, represents the primary driver of emission reductions in commercial laundry operations.
The conversion from per-cycle to annual metrics is traceable via the annual cycle counts reported in Section 2.1 (11,596 washing cycles/year; 24,176 drying cycles/year) and the per-cycle GWP values in Tables 3 and 4. Table 5 summarises the per-cycle GWP values, annual cycle counts, and resulting annual fleet-wide GWP reduction for all scenarios.
Table 5
Per-cycle GWP, annual cycle counts, and annual fleet-wide GWP reductions by scenario and operation type (S0 = baseline).
| OPERATION/SCENARIO | ANNUAL CYCLES | GWP PER CYCLE (kg CO2 eq) | Δ VS S0 (kg CO2/CYCLE) | ANNUAL GWP REDUCTION (kg CO2) |
|---|---|---|---|---|
| Washing — S0 | 11,596 | 0.816 | — | — |
| Washing — S1 (+PV) | 11,596 | 0.72 | 0.096 | 1,113 |
| Washing — S2 (+PV+HP) | 11,596 | 0.273 | 0.543 | 6,297 |
| Washing — S3 (+HP) | 11,596 | 0.3995 | 0.416 | 4,824 |
| Drying — S0 | 24,176 | 0.898 | — | — |
| Drying — S1 (+PV) | 24,176 | 0.835 | 0.063 | 1,523 |
| Drying — S2 (+PV+HP) | 24,176 | 0.084 | 0.814 | 19,679 |
| Drying — S3 (+HP) | 24,176 | 0.328 | 0.570 | 13,780 |
| TOTAL fleet — S1 | 35,772 | — | — | 2,636 |
| TOTAL fleet — S2 | 35,772 | — | — | 25,976 |
| TOTAL fleet — S3 | 35,772 | — | — | 18,604 |
3.4 Economic Analysis
Figure 7 illustrates the cumulative discounted cash flows over 30 years for all three investment scenarios. The HP-alone scenario (S3, dashed orange) remains permanently negative throughout the analysis horizon, confirming its economic non-viability at current Italian energy prices. The critical mechanism, as noted in Section 3.1, is the near-parity of gas and heat pump–based thermal energy costs. At a coefficient of performance (COP) of 3.3 and a grid electricity price of €0.40/kWh, the heat pump delivers thermal energy at an effective cost of €0.121/kWhth, compared to €0.123/kWhth for natural gas, resulting in a marginal annual saving of approximately €166. This limited cost differential explains the relatively weak economic performance of the HP-only scenario (S3), despite its substantial emissions reduction potential. In the absence of lower electricity prices or higher gas costs, the economic case for electrification remains constrained, underscoring the importance of coupling heat pump deployment with on-site renewable generation, as in S2, to improve overall cost-effectiveness. The COP break-even (minimum COP for economic parity) was calculated at COP = 3.25, leaving only a 1.5% margin above the nominal COP. Real-world Seasonal COP for air-to-water HP in the northern Italian climate (Brescia, HDD 2,250, CDD 480) is estimated at 2.8–3.2 under winter operating conditions, meaning the HP routinely operates below the break-even COP from November to March. The economic assessment presented in this study is based on a constant COP assumption (COP = 3.3) and does not explicitly model seasonal performance variations. Consequently, the reported economic indicators should be interpreted as representative of nominal operating conditions, while actual savings may be lower during periods when the heat pump operates below the break-even COP.
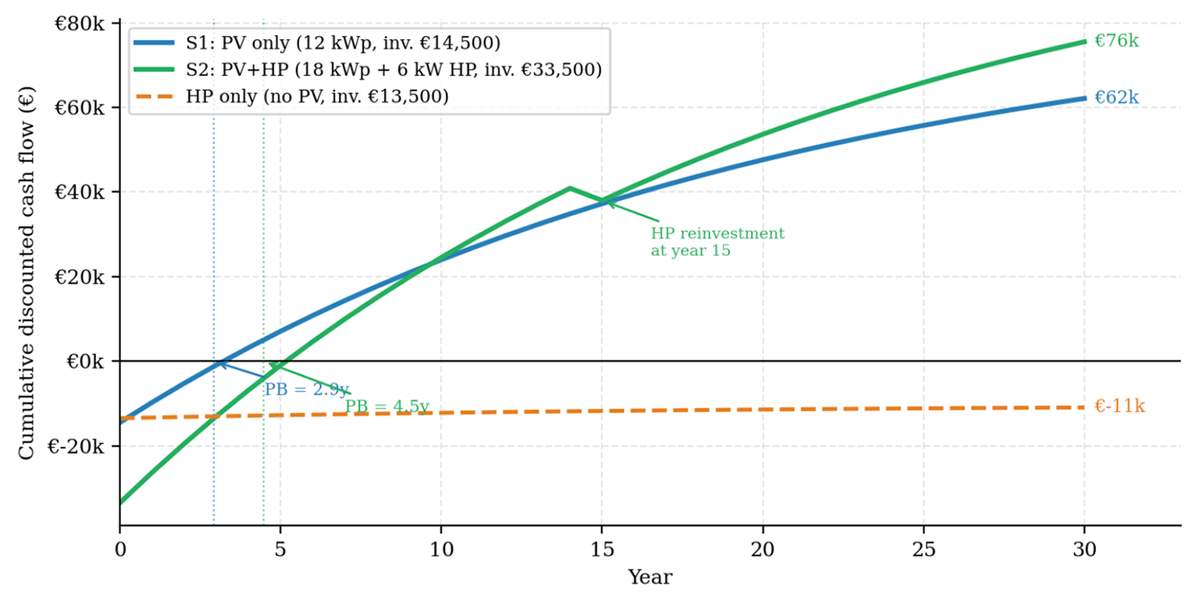
Figure 7
Cumulative discounted net present value (r = 5%) over 30 years for three investment scenarios.
S1 (PV only) delivers the highest profitability index (PI = 3.64) and the shortest payback period (2.91 years), reflecting the favourable economics of PV self-consumption under high Italian electricity prices. S2 (PV+HP) achieves the highest absolute net present value (NPV = €75,547), albeit with a longer payback period (4.46 years), representing an NPV premium of €22,795 over S1 at the cost of an additional €19,000 investment. The incremental internal rate of return (IRR) associated with the additional investment in S2 relative to S1 is approximately 16%, well above the 5% hurdle rate, thereby confirming S2 as the preferred option for operators with sufficient access to capital. Sensitivity to the discount rate is moderate: at r = 8%, the NPV of S2 remains strongly positive at €55,200, indicating robustness across the range of social discount rates typically considered in European policy appraisal. A comprehensive summary of the economic performance indicators for all scenarios is provided in Table 6 (r = 5%, 30-year analysis horizon).
Table 6
Summary of economic performance indicators (r = 5%, 30-year horizon).
| INDICATOR | S1: PV (12 kWp) | S2: PV+HP (18 kWp + 6 kW HP) | S3: HP ONLY | UNIT |
|---|---|---|---|---|
| Total investment | 14,500 | 33,500 | 13,500 | € |
| Annual savings | 4,986 | 7,516 | 166 | €/year |
| Simple PB | 2.91 | 4.46 | ∞ | years |
| Discounted PB | 3.22 | 5.16 | ∞ | years |
| NPV (30 years) | 52,752 | 75,547 | –11,775 | € |
| NPV at r = 3% | ~72,100 | ~104,500 | ~ –9,900 | € |
| NPV at r = 8% | ~37,800 | ~55,200 | ~ –13,400 | € |
| Profitability Index | 3.64 | 2.26 | –0.87 | — |
| Est. IRR | ~34% | ~22% | <0% | % |
Figure 8 presents a tornado chart showing the NPV sensitivity of Scenario 2 to six key uncertain parameters: discount rate, gas price (including an ETS2 scenario at €1.80/Sm3), electricity price, COP, capital cost, and PV yield. The chart confirms that S2 NPV remains positive across the full range tested.
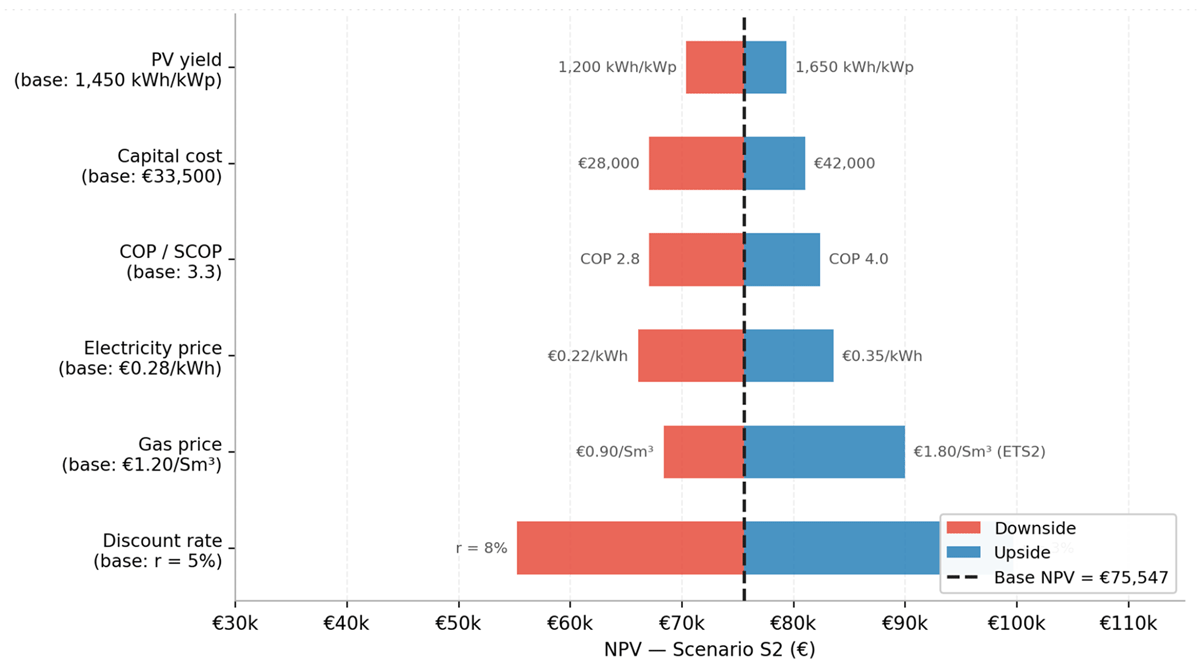
Figure 8
Tornado chart: NPV sensitivity for Scenario 2 (PV+HP) to key uncertain parameters.
3.5 Monthly PV Balance Analysis
Detailed monthly PV energy balance analysis provides important insights into grid interaction patterns. Under S1, annual PV generation covers nearly 90% of total electricity demand, with an effective self-consumption rate of 80.8%, while a residual share is exported, and some grid electricity remains necessary due to temporal mismatches. Under S2, total PV generation increases to 23,780 kWh/year, of which 16,286 kWh are self-consumed (68.5%), and 7,494 kWh are exported, with residual grid imports of 3,225 kWh/year concentrated in winter months. These results highlight the trade-off between PV system sizing and self-consumption efficiency, as larger systems increase absolute renewable generation but also lead to higher surplus exports. At the same time, the persistence of seasonal mismatches, particularly winter deficits, underscores the structural limits of PV-only strategies and the importance of demand flexibility or complementary technologies to maximise system efficiency and economic performance.
This monthly analysis reveals that increasing PV capacity from 12 to 18 kWp improves absolute self-consumption by 3,554 kWh/year (+28%) but reduces the self-consumption ratio from 80.8% to 68.5%, as the marginal electricity generated by the additional capacity increasingly coincides with periods of surplus production. For commercial laundries considering PV system sizing, these results suggest that installations in the range of 12–15 kWp tend to maximise self-consumption efficiency. Larger systems, such as the 18 kWp configuration analysed here, are economically justified primarily when the additional generation can be absorbed by flexible or electrified loads, such as heat pumps, rather than exported to the grid at comparatively low feed-in tariffs.
3.6 Discounted LCA Temporal Analysis
Figure 9 presents the cumulative discounted GWP for washing operations over 25 years under the dynamic LCA (DLCA) framework (r = 5%). The S0 baseline accumulates emissions at a constant annual rate, reaching approximately 145 t CO2 eq by year 25, as no upfront embodied impacts are considered. S1 (PV only) introduces a limited upfront manufacturing burden (approximately 350 kg CO2 eq for the 12 kWp PV system), but benefits from reduced operational emissions, resulting in an early environmental break-even at around 1.2 years. S2 (PV+HP) entails a higher initial impact (approximately 850 kg CO2 eq for the combined PV and heat pump systems) yet exhibits a steeper divergence from the baseline due to significantly lower per-cycle emissions, reaching its break-even point at approximately 2.1 years. Beyond the crossover point, S2 delivers the greatest cumulative emissions savings over the system lifetime, confirming that the higher upfront embodied impacts are rapidly offset by operational gains. This highlights the relevance of dynamic LCA approaches in capturing the temporal trade-offs between initial investment impacts and long-term decarbonisation benefits.
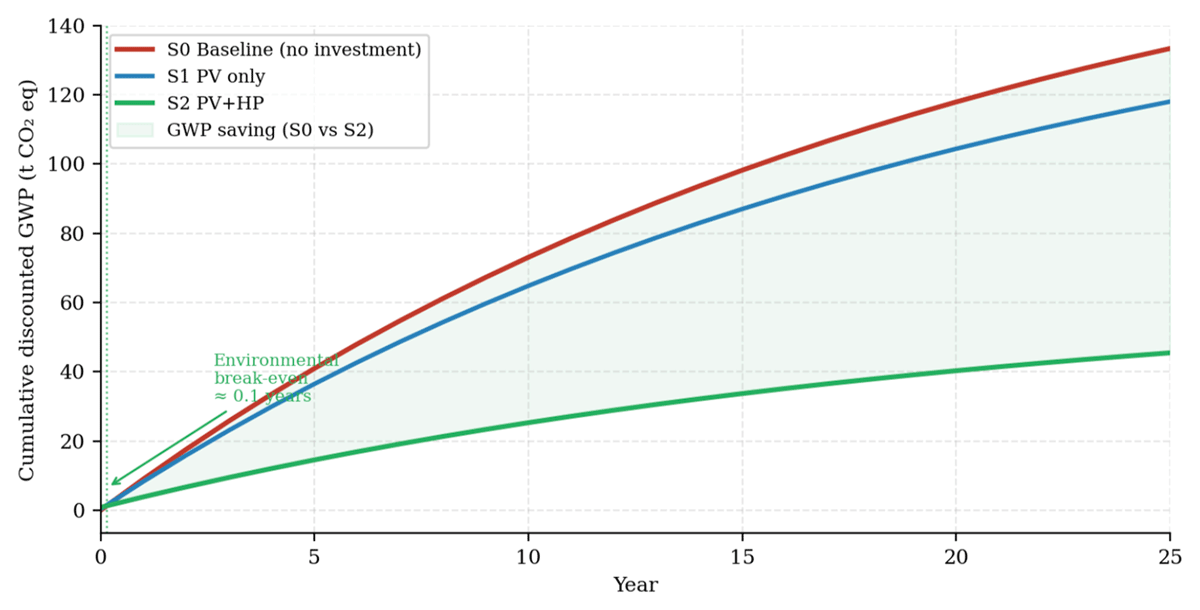
Figure 9
Discounted LCA: cumulative discounted GWP for washing operations over 25 years (r = 5%). Shaded area represents cumulative GWP saving of S2 relative to baseline.
Sensitivity of the environmental break-even to SDR is modest: at r = 3%, the S2 crossover advances to 1.9 years; at r = 8%, it is delayed to 2.4 years. This robustness arises because the break-even is determined primarily by the ratio of upfront embodied burden to annual operational impact reduction, a ratio governed by physical quantities rather than financial parameters. For fossil resource scarcity, break-even is even more rapid (approximately 1.6 years), since the HP eliminates gas consumption almost entirely. For freshwater ecotoxicity and water consumption, categories where S2 exhibits higher impacts than S0, no crossover occurs within the 25-year horizon at any tested SDR, reflecting the persistent copper-related manufacturing burden of HP equipment.
4. Discussion
4.1 The PV-HP Synergy: A Critical Investment Design Insight
The finding that HP deployment without PV is economically non-viable at current Italian energy prices (NPV = – €11,775) is the most practically significant result of this study, and one that, to the authors’ knowledge, has not been quantitatively demonstrated with real-world operational data for small Italian commercial laundries in the prior literature. The mechanism is the thin margin between gas and heat pump-based heating costs: at a COP of 3.3 and under current Italian tariff structures, the cost advantage of HP heating over gas is approximately €0.002/kWhth, corresponding to only 1.6%. This differential is insufficient to recover a capital investment of €13,500 within any realistic technical lifetime of the equipment. As a result, the standalone electrification scenario (S3) remains economically unattractive despite its strong environmental performance. Heat pump viability in this context is structurally dependent on electricity-gas price parity, capital subsidies, or on-site renewable integration, conditions that current Italian tariff structures do not satisfy without policy support.
This finding challenges a common policy narrative that frames heat pump adoption as broadly cost-effective for commercial heating applications. The analysis demonstrates that cost-effectiveness is highly context-dependent and critically sensitive to the gas-electricity price ratio. In the Italian context, where gas prices are moderate relative to northern European benchmarks, HP economics require either: (i) electricity sourced substantially below grid tariff (i.e., self-generated PV, as in S2); (ii) direct capital grants covering at minimum 60–70% of HP cost; or (iii) gas prices rising above approximately €1.70/Sm3 at current electricity prices. Policy mechanisms such as the Italian Conto Termico (providing capital grants of up to approximately 65% for heat pump installations) and the forthcoming EU ETS2 (Directive (EU) 2023/959, which is expected to increase the effective cost of natural gas through carbon pricing, are therefore key enablers for heat pump adoption in this sector.
Conversely, the combined PV+HP scenario (S2) remains robustly attractive across all tested discount rates and energy price assumptions. The key mechanism is the strong coupling between photovoltaic generation and heat pump operation, which substantially reduces the effective cost of electricity used for thermal production. In this configuration, PV-generated electricity allocated to HP operation leads to an effective electricity cost of approximately €0.012/kWh (based on residual grid purchases and system balancing), compared to €0.40/kWh for grid electricity. This markedly improves the economics of heat pump operation: at an effective electricity cost of €0.012/kWh and a COP of 3.3, the resulting heating cost is approximately €0.004/kWhth, corresponding to a reduction of about 97% relative to natural gas at €0.123/kWhth. The PV–HP interaction is therefore not merely additive but synergistic, as photovoltaic generation simultaneously displaces high-cost grid electricity and enhances the cost-effectiveness of electrified thermal loads.
4.2 Multi-Dimensional Environmental Trade-offs and Burden Shifting
The radar charts (Figures 4 and 6) and detailed impact tables (Tables 3, 4) reveal important burden-shifting dynamics that would be missed in a single-indicator analysis. Three impact categories show increases under S2 relative to S0: freshwater ecotoxicity (+22.6%), marine ecotoxicity (+17.1%), and human non-carcinogenic toxicity (+10.5%). These increases are attributable primarily to copper use in HP heat exchangers and compressor windings, and to refrigerant R32 production. Per functional unit, these increases represent approximately 0.011 kg 1,4-DCB eq (freshwater ecotoxicity) and 0.078 kg 1,4-DCB eq (human non-carcinogenic toxicity) per washing cycle, modest in absolute terms. For marine ecotoxicity and human non-carcinogenic toxicity, partial offsetting occurs within the 25-year horizon; however, for freshwater ecotoxicity, no DLCA crossover is observed within 25 years at any tested SDR, reflecting the persistent copper-related manufacturing burden of the heat pump. This distinction is important for a complete characterisation of the environmental trade-offs associated with heat pump deployment.
Terrestrial ecotoxicity, dominated by detergent and fabric softener supply chains, shows a modest 14.0% improvement under S2, confirming findings from prior LCA literature that chemical inputs represent the largest single contributor to ecosystem toxicity in laundry operations, independent of energy source. This finding suggests that complementary interventions, enzymatic detergent formulations, cold-wash programmes for lightly soiled HORECA linen, and reusable sanitizer dispensing systems, should be prioritised alongside energy system upgrades to achieve comprehensive environmental improvement.
The observed increase in ionising radiation under the HP-only scenario (S3: +282%, from 0.031 to 0.118 kBq Co-60 eq/cycle) requires explicit interpretation. This effect arises from the Italian electricity mix, which includes a share of imported electricity with nuclear generation upstream (notably from France and Switzerland), contributing to higher ionising radiation impacts per kWh. When heat pump operation is fully supplied by grid electricity, this contribution becomes the dominant source of ionising radiation, outweighing the low baseline associated with gas-based operation. Under S2, where electricity for the heat pump is largely supplied by on-site PV generation, this contribution is substantially reduced, leading to a 44% decrease relative to the baseline (0.017 kBq Co-60 eq/cycle). These results highlight that the environmental performance of heat pump electrification is strongly dependent on the upstream electricity mix, particularly with respect to impact categories sensitive to nuclear and imported electricity contributions.
4.3 Implications for HORECA Decarbonisation Policy and Practice
The Brescia laundromat represents a typology, coin-operated commercial urban laundry, operating in a northern Italian climate, serving HORECA clients at SME scale, that is widely observed across hundreds of municipalities in Italy and in comparable urban contexts in France, Spain, Germany, and other Central European countries. The methodology developed in this study is therefore potentially transferable to comparable contexts, subject to context-specific calibration of local energy tariffs, climate conditions, and machine fleet composition, requiring only 12 months of metered utility data (typically available from standard energy and water invoices), manufacturer datasheets for machine characterisation, and publicly accessible PVGIS solar irradiance data. The integrated LCA-DLCA-economic framework can thus be applied as a standardised decision-support tool for assessing and planning energy transition strategies in the commercial laundry sector.
From the perspective of HORECA clients, the energy cost savings quantified in this study, €7,516/year under S2, translate to meaningful supply chain cost reduction opportunities. At 35,772 cycles/year, average per-cycle cost falls by €0.21 under S2. For a hotel generating 50 large-load HORECA laundry cycles daily (18,250 cycles/year), this saving would represent approximately €3,833/year, or approximately €0.21/room/night for a 200-room hotel. While individually modest, aggregate across a hotel chain’s laundry supply chain, such savings become material and will be reportable under forthcoming CSRD Scope 3 accounting requirements.
The DLCA-SDR framework represents a methodological advancement with applicability beyond the present case study. It explicitly incorporates temporal discounting and the derivation of the social discount rate transparently, offering a unified metric that integrates environmental impacts, financial performance, and policy-related uncertainty. The PESTEL-based SDR estimation is inherently dynamic and can be updated in response to changes in energy policy, macroeconomic conditions, and market developments. In this way, the framework operates as a continuously adaptable assessment tool rather than a static evaluation snapshot.
4.4 Limitations
Several limitations of the present study should be acknowledged to contextualise the findings appropriately. First, the techno-economic model applies a constant annual COP of 3.3 throughout the analysis horizon, despite acknowledging that real-world Seasonal COP (SCOP) in the northern Italian climate is estimated at 2.8–3.2 during winter months. The constant-COP assumption therefore slightly overestimates HP energy savings in winter and underestimates them in summer; a seasonal COP profile would improve the accuracy of annual savings estimates, particularly for the HP-only scenario (S3). Second, the cash-flow model does not incorporate dynamic energy price escalation in the base-case analysis. Although an ETS2-related gas-price scenario was explored through the NPV sensitivity analysis for Scenario S2, a corresponding assessment was not performed for the HP-only scenario (S3). Consequently, the economic results reported for S3 rely on baseline energy-price assumptions. Given the central role of future fuel-price trajectories in determining the competitiveness of electrification pathways, future work should explicitly evaluate the sensitivity of S3 viability to ETS2 pass-through under plausible carbon-price scenarios. Third, the LCA system boundary is cradle-to-gate and excludes end-of-life treatment of PV modules, heat pump components, and refrigerant R32 (GWP100 ≈ 675). End-of-life refrigerant leakage in commercial HP systems can be material and should be addressed in future assessments. Fourth, the PESTEL-based SDR derivation involves qualitative-to-quantitative mappings and an equal-weighting assumption that are inherently subjective; the composite SDR of 5.58% should be interpreted as an indicative central estimate consistent with European Commission guidance, rather than a precisely calibrated value. The sensitivity analysis at r = 3%, 5%, and 8% partially addresses this uncertainty but does not explore alternative weighting schemes. Because all PESTEL dimensions are equally weighted, any reassignment of an individual sub-rate directly propagates to the composite SDR estimate. Fifth, the study is based on a single case-study facility, and the headline economic findings are sensitive to Italian-specific gas-electricity price ratios, grid carbon intensity, and incentive schemes (Conto Termico). Transferability to other European contexts requires context-specific recalibration of these parameters. Finally, operation and maintenance costs for PV and HP systems are not explicitly itemised in the cash-flow model; standard O&M estimates (typically 1–2% of capital cost per year for PV, and periodic servicing for HP) would refine the NPV calculations, though their exclusion is not expected to materially alter the ranking of scenarios.
5. Conclusions
This study provides a highly granular, empirically grounded assessment of life cycle environmental impacts and economic performance of energy transition pathways for a commercial HORECA laundry system. The analysis integrates 12 months of machine-level utility monitoring, a full ReCiPe 2016 Midpoint LCA across 18 impact categories for both washing and drying operations, a comprehensive techno-economic evaluation, and a discounted LCA (DLCA) framework incorporating a PESTEL-derived social discount rate (SDR).
Three principal findings emerge from the analysis. First, PV self-consumption is economically robust under current Italian tariff conditions and represents a viable first-stage decarbonisation investment, with capital recovery achievable within three years without dependence on capital subsidies. Second, standalone HP deployment is structurally unviable at prevailing Italian gas-electricity price ratios: the economic case requires either PV integration, significant capital support through schemes such as Conto Termico, or the progressive EU ETS2 carbon price pass-through from 2027. This constraint has direct implications for incentive scheme design beyond the specific case study. Third, the integrated PV+HP scenario achieves the strongest joint environmental–economic outcome and remains robustly positive across the full SDR sensitivity range tested, making it the preferred pathway for operators with adequate capital access.
Two methodological contributions of broader applicability are also noted. The PESTEL-derived SDR framework provides a structured, reproducible approach to context-specific discount rate selection for environmental appraisal, applicable beyond the laundry sector. The DLCA results further demonstrate that static LCA systematically overestimates the net environmental burden of front-loaded capital investments: at r = 5%, GWP break-even is achieved within 2.1 years, and the temporal profile of burden-shifting in toxicity categories diverges substantially from the static picture. Future work should extend this framework to portfolio-level assessments across multiple facility typologies and investigate sensitivity to projected grid decarbonisation under Italy’s NECP.
The PESTEL-based SDR of 5.58% lies within the range recommended in European Commission appraisal guidelines and demonstrates robustness across sensitivity scenarios. Overall, the integrated LCA-DLCA-economic framework developed in this study is potentially applicable to comparable commercial laundry typologies across Italy and broader Southern and Central European urban contexts, subject to context-specific calibration of local tariff structures, climate, and machine fleet parameters. Its application requires only standard utility billing data, equipment specifications, and publicly available solar resource datasets (e.g., PVGIS). Wider adoption of this methodological approach could support the standardisation of decision-making tools for decarbonisation in the HORECA laundry sector, providing an evidence base aligned with CSRD Scope 3 reporting requirements and energy efficiency obligations under Directive (EU) 2023/1791.
Nomenclature
| Symbol/Abbrev. | Definition |
|---|---|
| COP | Coefficient of Performance (dimensionless) |
| CSRD | Corporate Sustainability Reporting Directive (EU 2022/2464) |
| DLCA | Discounted Life Cycle Assessment |
| DPB | Discounted Payback Period (years) |
| FRS | Fossil Resource Scarcity (kg oil eq) |
| GWP | Global Warming Potential (kg CO2 eq) |
| HORECA | Hotels, Restaurants, and Catering |
| HP | Heat Pump |
| IRR | Internal Rate of Return (%) |
| LCA | Life Cycle Assessment |
| LHV | Lower Heating Value (kWh/Sm3) |
| NPV | Net Present Value (€) |
| PB | Simple Payback Period (years) |
| PESTEL | Political, Economic, Social, Technological, Environmental, Legal (analytical framework) |
| PI | Profitability Index (dimensionless) = (NPV + Investment)/Investment |
| PV | Photovoltaic (solar electricity generation system) |
| r | Social Discount Rate (%) |
| SDR | Social Discount Rate |
| SCOP | Seasonal Coefficient of Performance |
| SME | Small and Medium-Sized Enterprise |
Data Accessibility Statement
The aggregated data underlying the results presented in this study are included within the manuscript. Due to commercial confidentiality constraints, more granular operational and financial data cannot be publicly disclosed. However, additional non-sensitive information may be made available from the corresponding author upon reasonable request, subject to confidentiality considerations.