
Table 1
Data sources and spatial resolution.
| DATABASE | DESCRIPTION | SPATIAL RESOLUTION |
|---|---|---|
| GRDF customer database | Customer-level records from the main French gas distribution network operator | Address |
| National Building Database (BDNB, 2024) | National Building Database: comprehensive registry of building characteristics compiled by CSTB | Building/address |
| EPC/DPE database (ADEME, 2024) | National repository of energy performance certificates issued for French dwellings | Address |
| Population census (INSEE, 2022) | National population and housing census providing socioeconomic and demographic household characteristics | IRIS/municipality |
| Enerter residential model (Energies Demain, 2022) | Bottom-up residential model combining dwelling, household and energy demand data | IRIS/municipality |
| Local energy data – DLE (SDES, 2024) | Aggregated energy consumption by carrier published by the French energy statistics service | IRIS |
| France Chaleur Urbaine (FCU, 2025) | National registry of district heating networks providing geolocation, network characteristics and connection availability | Address/network segment |
Table 2
Description of variables and their sources in the final database.
| VARIABLE GROUP | VARIABLES | SOURCE |
|---|---|---|
| Geographic identifiers | Intermunicipal cooperative structure (EPCI, Établissement Public de Coopération Intercommunale) code, INSEE municipality code, IRIS code, BAN address identifier | BDNB/BAN |
| Building characteristics | Construction period, dwelling category, number of dwellings in building, dwelling type, floor area | BDNB/EPC/RP 2022 |
| Heating system | Current heating energy, heating system, installation type, generator type, estimated installation year | EPC/ENERTER/RP 2022 |
| Energy performance certificate (EPC) | EPC label, EPC number, assessment method, EPC version, last modification date | EPC |
| EPC energy estimates | Heating demand, total energy consumption (5 uses, primary and final), heating consumption (primary and final), consumption per m², total and heating costs | EPC/ENERTER |
| Gas metering | GRDF meter identifier, normalised gas consumption (1-year and 3-year), number of gas metering points | GRDF DATABASE |
| Other energy networks | Number of electricity/gas/district heating metering points, district heating network identifiers and type, distance to district heating network | GRDF/DLE/FCU |
| Household profile | Number of persons, occupancy status, dwelling weight in sample | RP 2022/ENERTER |
| Socio-economic indicators | Income category, energy poverty indicators (TEE, TEL), net income, disposable income, living standard, conventional and actual housing expenditure | RP 2022/ENERTER |
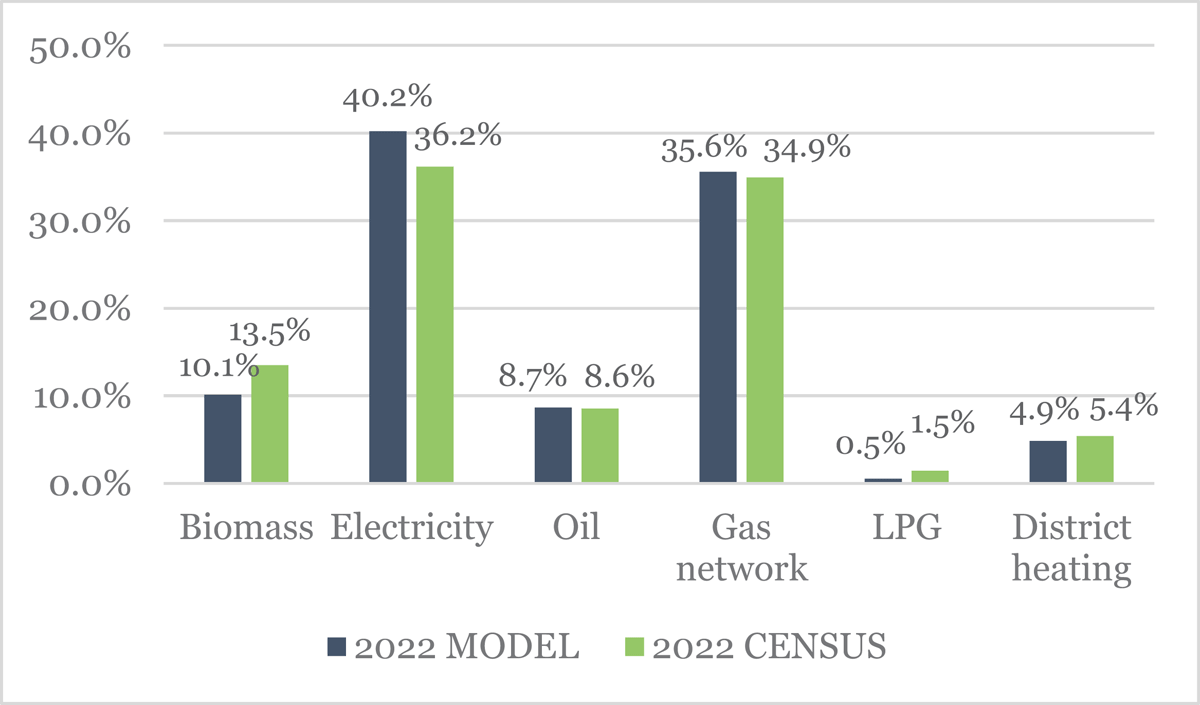
Figure 1
France energy mix in number of dwellings per heating energy source diagram.
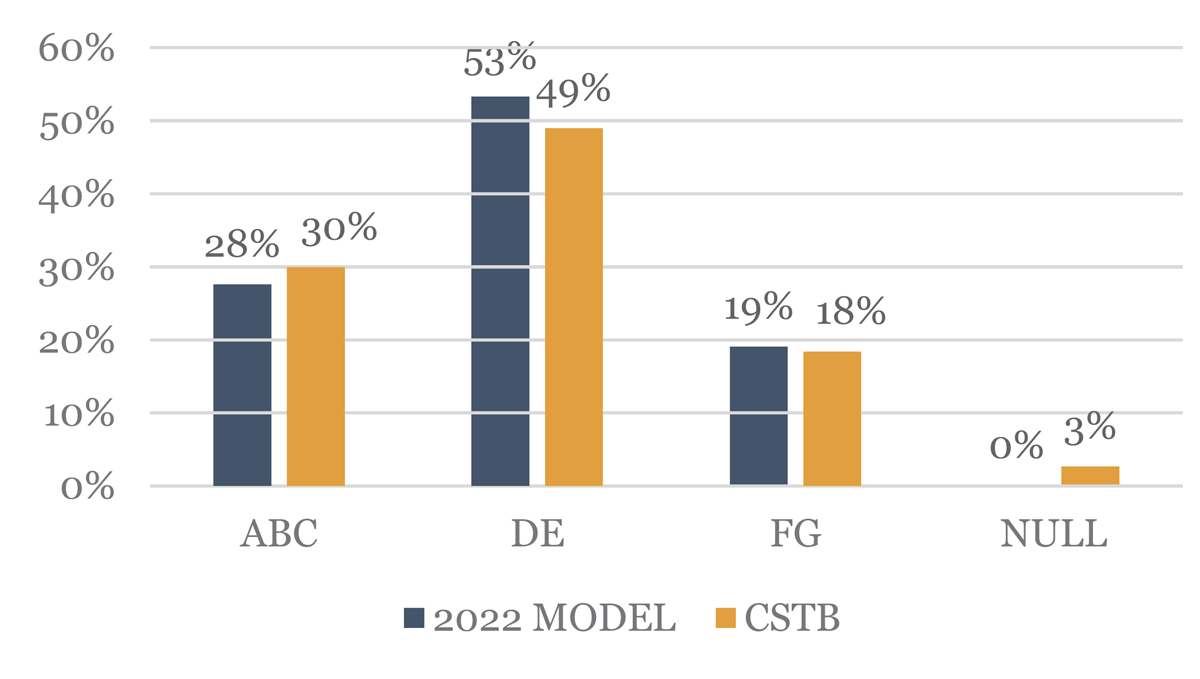
Figure 2
French distribution of EPCs (Energy Performance Certificate) classes.
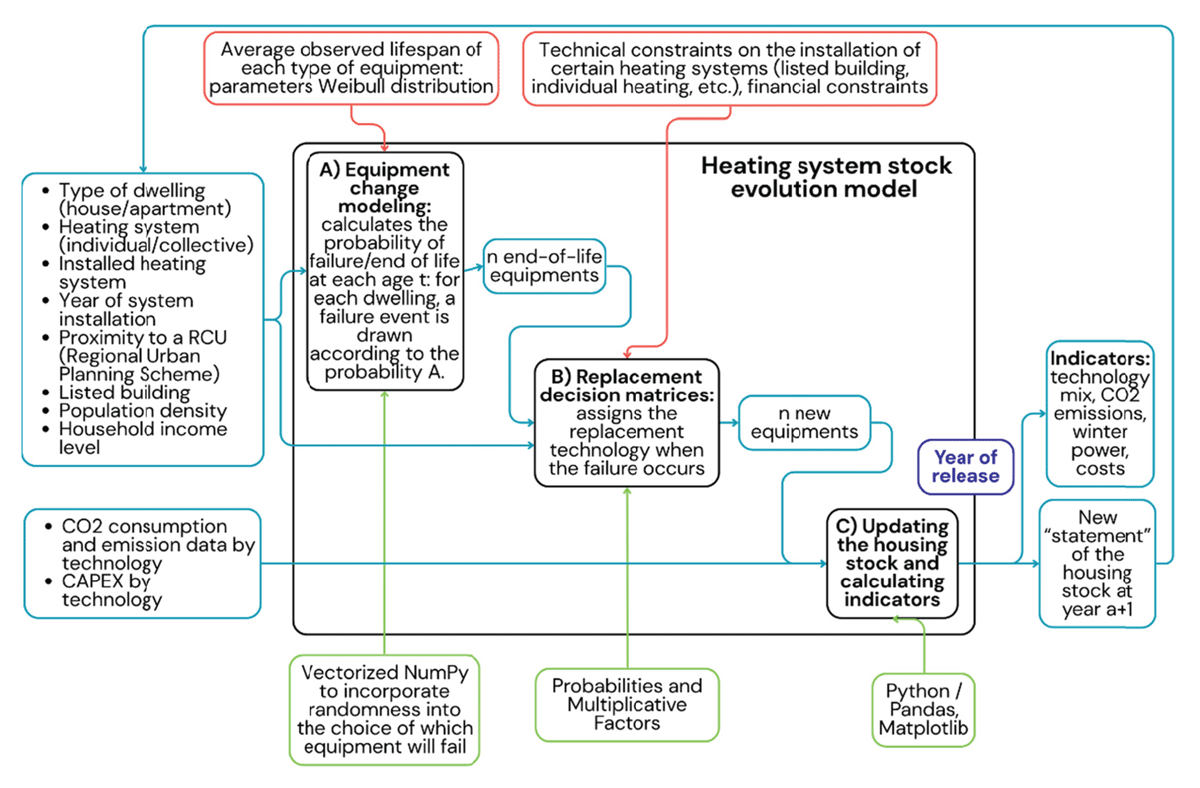
Figure 3
Building heating system stock evolution model diagram.
Table 3
Performance coefficients used for each heating technology.
| TECHNOLOGY | PERFORMANCE PARAMETER | SOURCE |
|---|---|---|
| High-efficiency gas boiler | η = 0.92 | Pouget/ADEME (2021) |
| Standard gas boiler | η = 0.60 | Pouget/ADEME (2021) |
| Oil boiler | η = 0.7 | Pouget/ADEME (2021) |
| Biomass boiler | η = 0.75 | Pouget/ADEME (2021) |
| Wood stove/insert | η = 0.65 | Pouget/ADEME (2021) |
| Electric resistance heating | COP = 1.0 | Pouget/ADEME (2021) |
| Air-to-air heat pump | COP = 2.9 | ADEME (2025a) |
| Air-to-water heat pump | COP = 2.6 (H1), 3.0 (H2), 3.4 (H3) | ADEME (2025a) |
| Ground-source heat pump | COP = 4.1 | ADEME (2025a) |
| District heating | η = 1.0 | Pouget/ADEME (2021) |
[i] Note: A single representative value is retained per technology for tractability at national scale. Future work will differentiate performance coefficients by renovation status and heating system type (individual vs. collective), following the full parameter tables of Pouget/ADEME (2021).
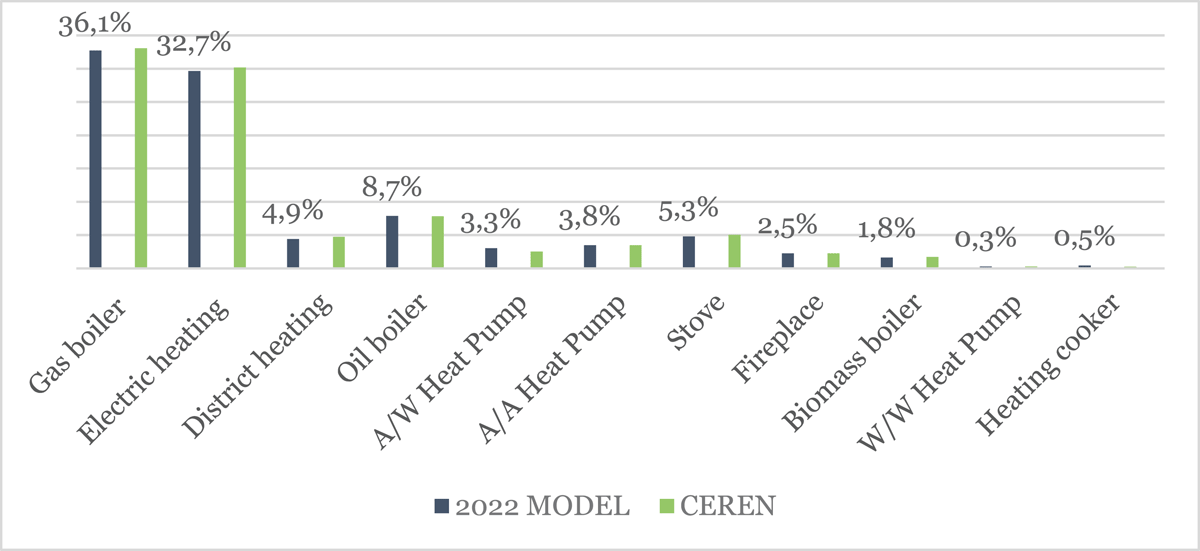
Figure 4
Distribution of main residential heating systems in 2022 (modelled database vs. CEREN reference).
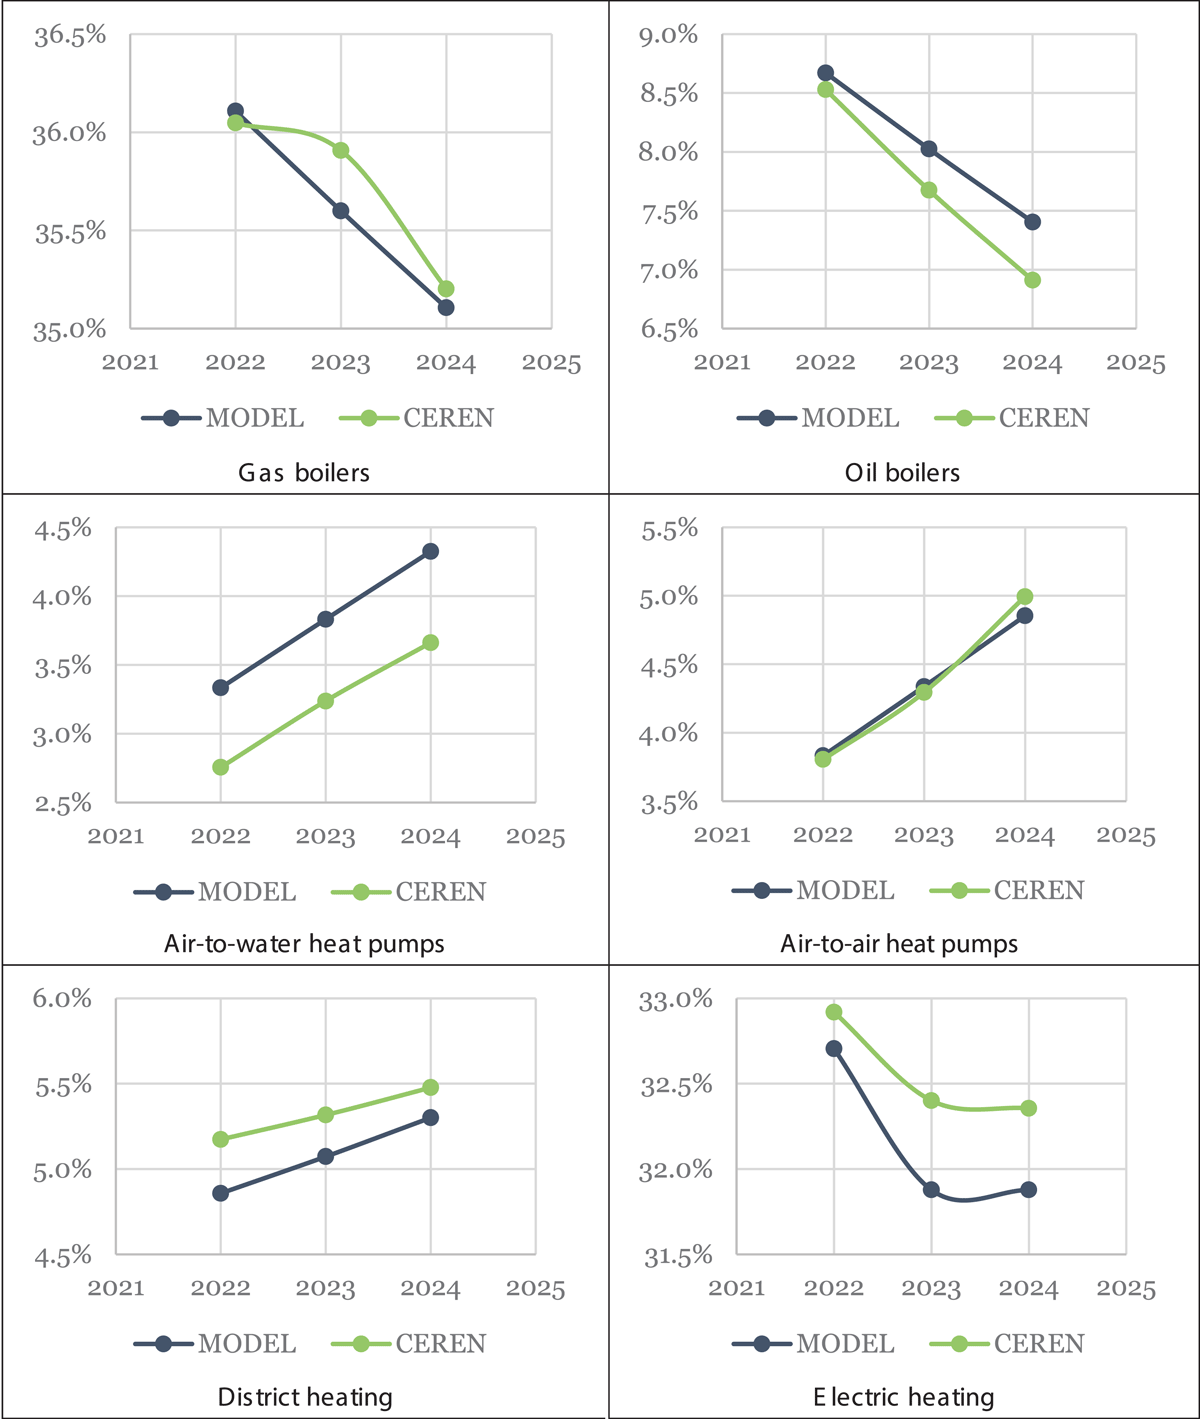
Figure 5
Evolution of the market share by technology (comparison between the model and CEREN data between 2022 and 2024).
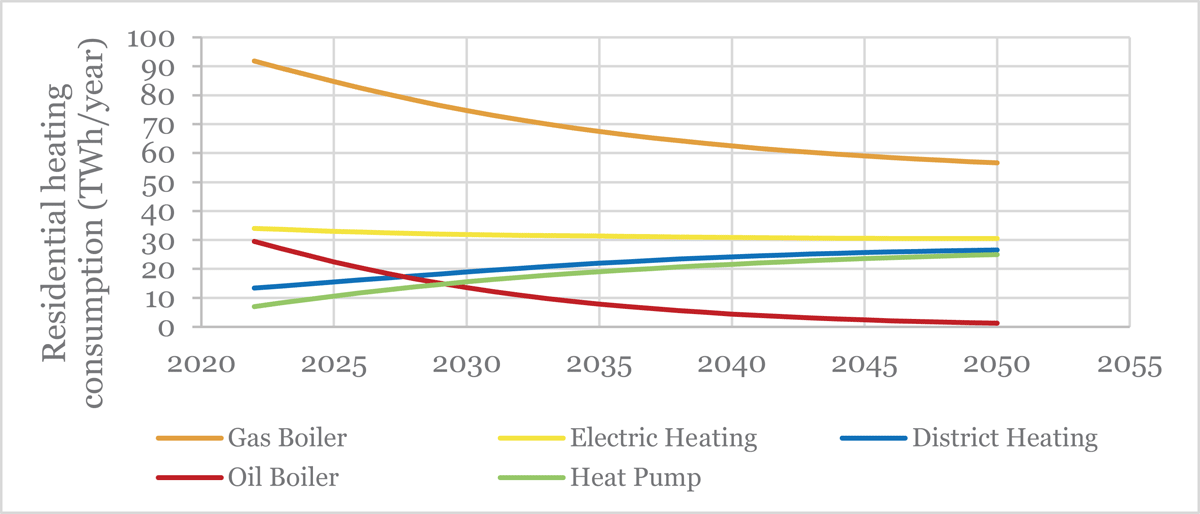
Figure 6
Evolution of residential heating consumption by technology up to 2050.
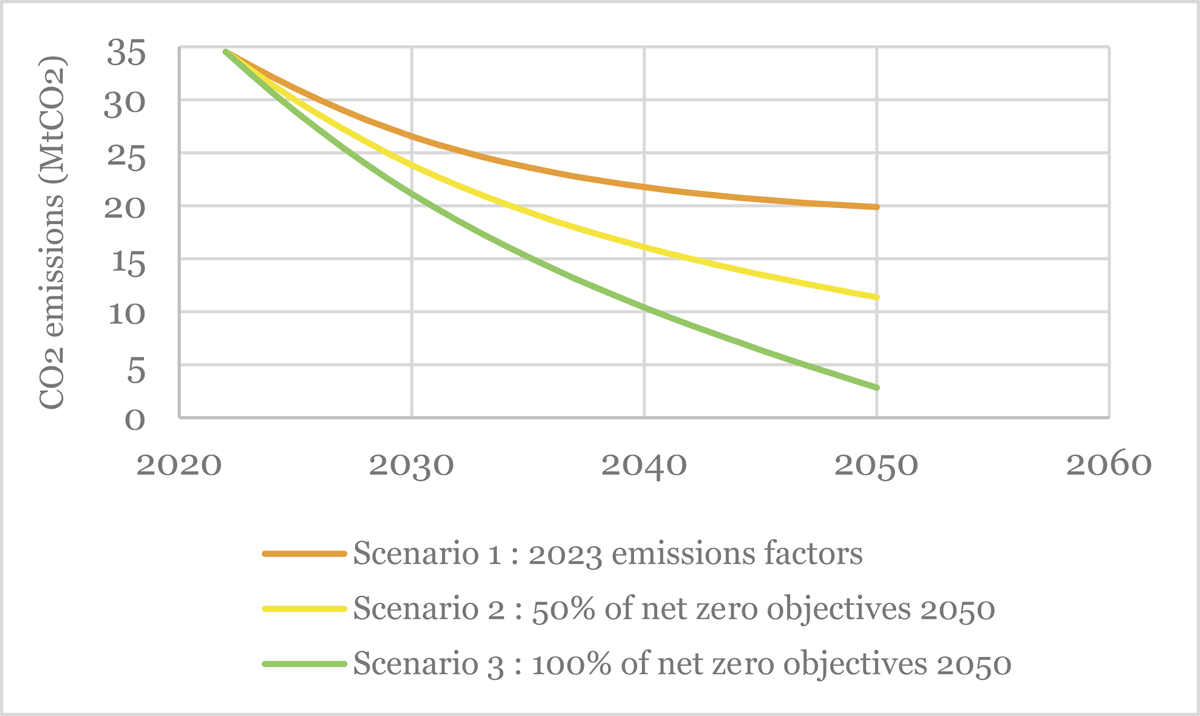
Figure 7
Evolution of CO2 emissions from residential heating up to 2050.
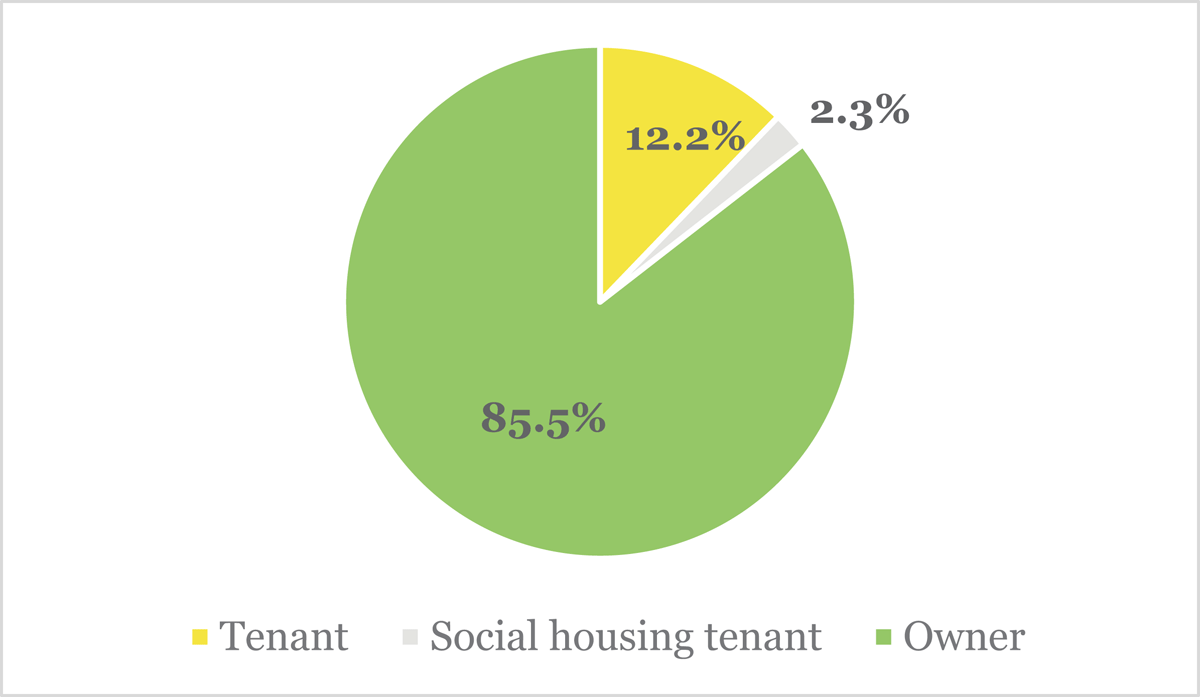
Figure 8
Who installs heat pumps? Share by tenure status (reference scenario).
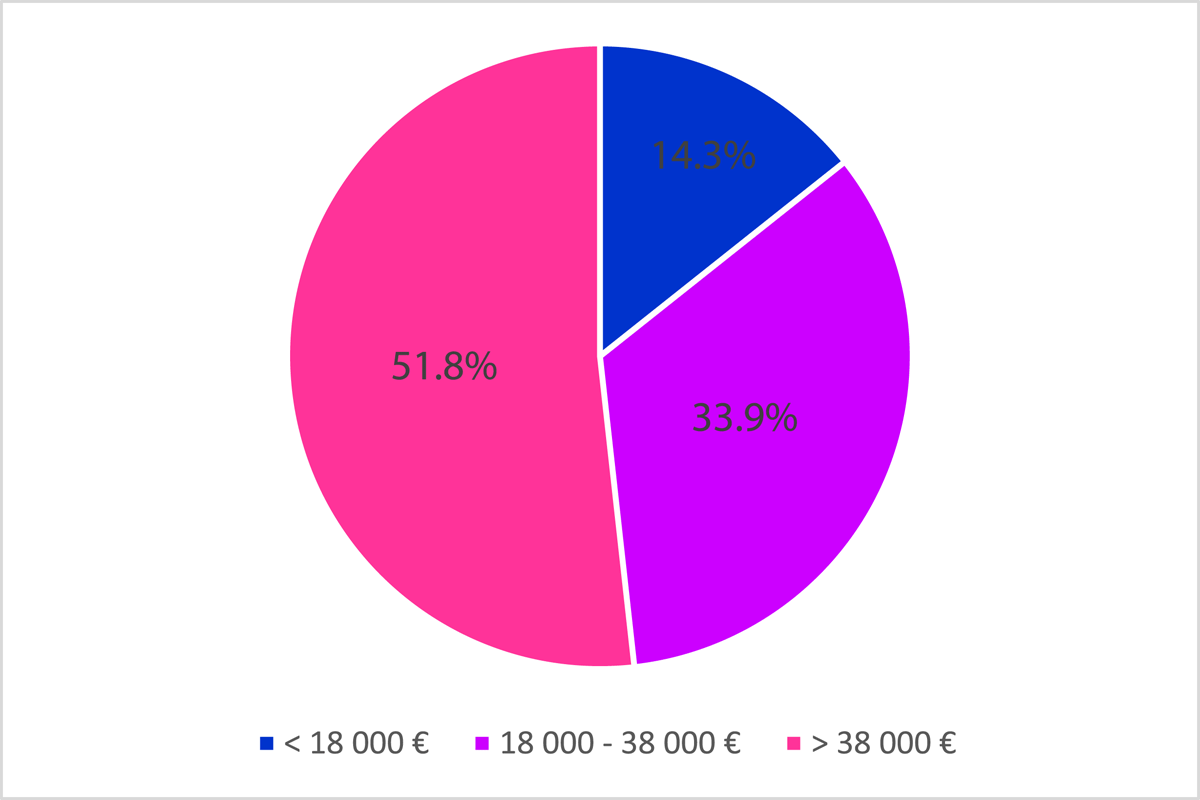
Figure 9
Distribution of owner-occupiers replacing their heating system with a heat pump, by income.
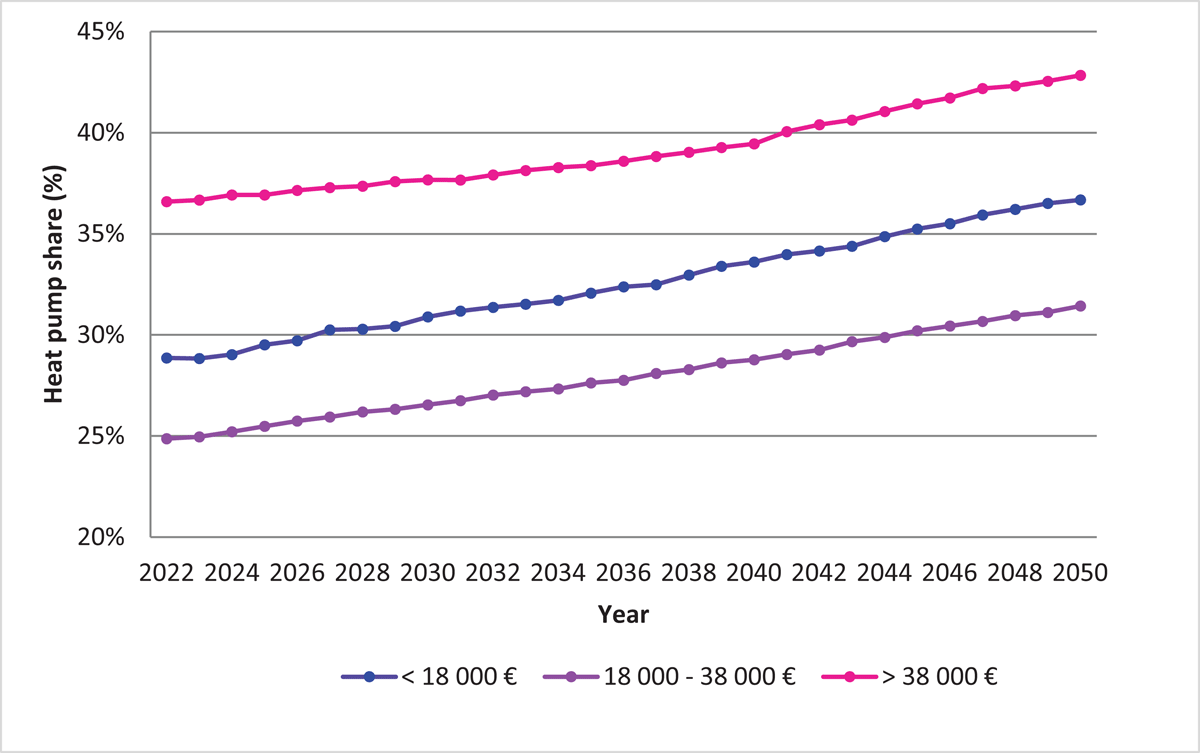
Figure 10
Heat pump share among replacements, by income bracket (homeowners, 2022–2050).