
Introduction
Space heating as a key lever for decarbonisation
Residential space heating accounts for a substantial share of final energy consumption and greenhouse gas emissions in the French residential sector. As such, it plays a central role in national and territorial decarbonisation strategies aiming at carbon neutrality by 2050. Energy and climate planning documents assign a pivotal role to the transformation of residential heating systems in achieving these long-term objectives.
The decarbonisation of space heating relies on several complementary levers: building renovation and the renewal of heating equipment with more efficient systems as well as changing energy carriers. Among these, heating system replacement is a critical issue, as it directly shapes the energy and carbon trajectories of the existing stock, even in the absence of deep renovation.
Assessing these trajectories requires predicting how public policies influence household investment decisions. Decarbonisation instruments (financial incentives, energy performance regulations, connection obligations to district heating networks, or progressive bans on specific technologies) shift the economic and technical trade-offs between heating systems faced by households at the time of their replacement. These decisions, taken at the dwelling scale, have an impact at municipal to national levels on the energy mix, final energy demand, greenhouse gas emissions, peak loads, and overall system costs.
The necessity to understand articulation between micro-economic decisions and macro-energy trajectories motivates the development of a dynamic model of the residential heating system stock, explicitly representing equipment ageing, failure events, and replacement choices under the combined influence of public policies and structural constraints.
Building on these considerations, a dynamic prospective model of the French residential heating stock, centred on heating system replacement at the dwelling level turns out to be useful to analyse the impact of policy incentives and constraints and to forecast decarbonisation pathways.
Positioning with respect to existing modelling approaches
The literature on residential energy systems reveals three broad families of modelling approaches, which can be characterised along five dimensions: the scale of resolution (national or aggregate versus individual dwelling, a granularity required to capture heterogeneity in the building stock and in renovation trajectories, and to allow linkage with dwelling-level data sources), the socio-economic characteristics of households, in particular income and tenure status (owner-occupier versus tenant), the explicit modelling of equipment end-of-life and replacement, applicability at a sub-national territorial scale, and data requirements. These criteria are used throughout this section to situate the approach developed in the present work.
Techno-economic optimisation models
The first family includes approaches designed to identify, over the long term and at national or multinational scale, the least-cost mix of investments consistent with climate targets. These models minimise a discounted social cost subject to physical or regulatory constraints, varying sectoral investment trajectories across time. Borasio and Moret (2022), in their survey of models used for deep decarbonisation studies, identify three representative members of this family among the nine models capable of handling cross-sector energy interactions: the TIMES family (MARKAL/TIMES, EU-TIMES), which optimises the technology and fuel mix over long horizons under various policy scenarios; EnergyPLAN, focused on comparing investment strategies for renewable energy systems; and PRIMES, developed and extended by Capros et al. (2019) with the explicit aim of modelling structural breaks in energy trajectories rather than extrapolating existing reduction pathways.
These approaches have well-documented limitations relative to the objectives of this work. Their national or supranational resolution requires working with aggregate representations of the building stock, based on average technology penetration rates and renewal matrices, which make it impossible to model decisions at the level of individual dwellings. More importantly, household behaviour is represented through a single rational agent with perfect information, implying that every investment decision corresponds to the techno-economic optimum. As Trutnevyte et al. (2019) argue, this treatment of demand through exogenous demographic and economic assumptions calls into question the realism of the decision-making representation. Concretely, this limits the capacity of these models to capture mechanisms that are decisive for residential decarbonisation, such as the landlord-tenant dilemma, liquidity constraints among low-income households, threshold effects related to fixed installation costs, or heterogeneous responses to targeted policy instruments.
Urban building energy models (UBEM)
The second family, commonly referred to as Urban Building Energy Models, covers bottom-up approaches that estimate the energy needs and consumption of an entire building stock at the scale of a neighbourhood, city or urban area, combining urban geometry, building archetypes and usage assumptions. These models typically produce hourly consumption profiles and are used to assess renovation scenarios for aggregate urban-scale indicators. Reinhart and Cerezo Davila (2016) provide a reference synthesis of this field, highlighting the capacity of these approaches to spatialise energy consumption by accounting for urban morphology and building typology.
The key limitation of UBEM for the present purposes is methodological. As Ferrando et al. (2020) demonstrate, these tools are primarily designed as physical simulation instruments rather than as models of individual decision-making. They identify the energy savings achievable under given renovation or technology substitution scenarios, but do not represent the mechanisms that govern when and why households actually replace their heating equipment. Replacement dynamics are driven by exogenous assumptions on adoption rates and renovation schedules, not by an endogenous representation of equipment ageing and individual choice.
Micro-simulation models of the residential building stock
The third family, to which the present work belongs, encompasses approaches that explicitly represent equipment decisions at the dwelling or household level and update the stock year by year according to individual adoption rules. Two methodological orientations can be distinguished within this family.
The first is the economic-behavioural approach, of which Res-IRF, initially developed by Giraudet et al. (2012), is one of the most developed examples for the French context. Res-IRF is a dynamic micro-simulation model of space heating demand in the French residential building stock, built to improve the behavioural realism that integrated energy demand models typically lack. It simulates the evolution of energy consumption through three endogenous processes: dwelling construction and demolition, thermal renovation and fuel switching, and heating infrastructure utilisation adjustments after renovation. Investment decisions are modelled through discrete-choice functions incorporating economic costs and benefits, with frictions calibrated empirically (credit constraints, landlord-tenant dilemma, rebound effects).
The model has been extensively used to evaluate national policy instruments, including fiscal incentives and energy savings certificates (Giraudet et al., 2020). Its principal limitations for the present work are the absence of infra-national spatial resolution, and a replacement mechanism driven only by economic profitability and not by a probabilistic end-of-life process, which prevents distinguishing planned from emergency replacements.
The second orientation is that of agent-based models (ABMs), which seek to represent actor heterogeneity and interactions in an even more explicit manner. Alibaş et al. (2025) present RENDER-Building, an ABM designed for high-resolution analysis of building stock transformation, in which building agents are assigned detailed attributes and are localised at NUTS3 (Nomenclature of Territorial Units for Statistics, level 3, corresponding to small regions such as French départements) resolution across seven settlement types. The model explicitly integrates local energy infrastructure availability and applies a discrete-choice model to represent bounded rationality in renovation and technology decisions. It is validated against the German building stock and used to simulate transformation pathways to 2050 under three scenarios.
This class of models faces recognised methodological challenges. The first concerns empirical validation: as Alibaş et al. (2025) themselves acknowledge, the availability of individual-level data to calibrate and validate behavioural parameters remains insufficient. The second challenge concerns the large amount of detailed data required to parameterise such models. Edelenbosch et al. (2022), drawing on a cross-country survey of over 6,000 European households, show that energy consumption is not straightforwardly explained by sociodemographic categories, and that the income variable presents the most consistent effect across demand, dwelling efficiency and energy-saving investments. Their results reinforce the need to ground agent-based models in empirical data, even more when these models are embedded in long-term, large-scope assessment frameworks.
Positioning of the model developed in this work
The model developed in this paper belongs to the micro-simulation family and shares with Res-IRF the ambition of representing replacement decisions at the dwelling level over a multi-decadal horizon. It addresses two of the limitations identified above. First, by modelling equipment end-of-life through survival functions calibrated on technical data, it generates probabilistic replacement events that reflect the actual dynamics of an ageing stock and allow planned and emergency replacements to be distinguished.
Second, by integrating local infrastructure constraints (energy network availability) and building-level technical constraints (e.g. the absence of compatible radiators precluding air-to-water heat pump installation) into technology choice matrices (rule-based matrices that assign a feasible heating technology to a dwelling based on its characteristics and constraints, which will be described in the following sections) it is designed for application at the sub-national territorial scale, where Res-IRF operates at the national level. On this point, the model is close in spirit to RENDER-Building, in that it integrates local energy infrastructure availability and operates at a fine sub-national resolution. It differs, however, in its representation of household behaviour: whereas RENDER-Building applies an econometrically parametrised discrete-choice model to represent bounded rationality in technology decisions, our model relies on decisional matrices, in order to remain applicable in contexts where individual survey data are unavailable.
Proposed approach
The proposed model explicitly represents equipment ageing, failure processes, and technology choice under the combined influence of public policies, technical constraints, and household socio-economic characteristics. As modelling these dynamics involves different conceptualisations of stock turnover and decision-making, it is first necessary to situate this approach within the broader landscape of energy and building stock models. As shown in recent literature, heating system change decisions are mainly driven by explicit factors; therefore, we have chosen a model that explicitly incorporates observable variables at the household and housing levels.
First, budget constraints. Experimental studies and surveys consistently show that purchase prices and subsidies play a key role in technology trade-offs, with strong differences across income levels. A recent study (Rekker et al., 2024) on households’ willingness to pay for low-carbon heating solutions find that socio-demographic factors, including income, explain a substantial share of the observed variation. Institutional reports converge on this point: reviewing the UK home heating decarbonisation programme, the National Audit Office (2024) reports survey evidence commissioned from more than 6,000 households showing that a £1,000 increase in up-front cost reduces heat pump demand by around 10 percentage points, that up-front costs weigh more heavily than running costs in the decision, and that households with higher income and savings are more likely to opt for a heat pump. This makes the interaction between purchase cost and household income central to any large-scale diffusion policy.
Second, dwelling characteristics and the local energy environment. At fine scale, the availability of district heating networks, connection conditions, and building configuration (type, surface, existing heat distribution system) strongly influence actual choices. A recent European study (Billerbeck et al., 2024) on perceptions of district heating shows that acceptability and connection intentions depend primarily on perceived prices and environmental performance, and more broadly on local supply conditions. This supports the inclusion of “dwelling/territorial environment” variables (presence or absence of district heating, connection conditions, housing type) in replacement-decision modelling.
These observations lead us towards a “field-based” decision engine that takes as inputs simple but discriminating variables: income (or income class), occupancy status (owner, private tenant, social-housing tenant), dwelling type, surface, existence of a district heating network (and, where relevant, its connection obligation status), urban density, and so on. This makes it possible to encode directly the constraints and incentives perceived by households, to assess the impact of targeted subsidies across income groups, or to estimate the effect of district-heating expansion on replacement choices.
The adopted strategy combines three complementary components:
Equipment end-of-life is modelled through survival analysis, using Weibull distributions to derive annual failure probabilities from aggregated lifetime information, as well as spontaneous heating system renovation, whereby households replace their equipment before end-of-life. This dual replacement mechanism is an appropriate approach to contexts where detailed empirical failure data are limited but statistical benchmarks are available.
A matrix-based formulation of heating system replacement choice. The matrices aim to represent the probability of choosing each heating technology based on observable household and dwelling characteristics, technical constraints, territorial context and socio-economic and regulatory drivers. This formulation allows for the key determinants identified in the literature to be taken into account, such as budgetary constraints, tenure status, building typology, and local energy infrastructures such as district heating networks, which will impact the choices made when replacing heating systems.
A pluri-annual simulation framework that updates the residential heating stock over time by ageing equipment, stochastically triggering replacement events (whether through end-of-life failure or spontaneous renovation) and reallocating technologies accordingly. Aggregated indicators including technology mix, final energy consumption and CO2 emissions are computed for each simulated year, enabling the analysis of consistent and comparable decarbonisation pathways.
Content
This paper presents the new methodology proposed which relies on the construction of a harmonized database representing the French residential heating stock at consumption-unit level, and the development of a dynamic stock-evolution model simulating equipment ageing, failure and replacement over time.
The dynamic model of heating system stock evolution is then tested over several past years to verify its consistency, and then in a long-term perspective to show the results of its application.
Model structure and data
Simulation unit and model overview
The model represents the French residential heating stock as a population of consumption units, each defined as the elementary heating system serving one or several dwellings – for example an individual boiler, a collective boiler, or a stove. This level of granularity is chosen because heating system ageing, failure, and replacement decisions occur at the equipment level and cannot be consistently captured using aggregated building or territorial representations.
Each consumption unit is characterised by two groups of attributes. Static attributes (location, dwelling type, floor area, construction period, tenure status, and household socio-economic characteristics) are assumed constant throughout the simulation in the absence of deep renovation or demographic change. Dynamic attributes (installed heating technology, system installation year and age, heating energy carrier, and associated performance parameters) evolve over time as replacement events occur. The database construction described in the following subsections provides the initial values of both groups of attributes for each of the 36 million consumption units in the simulation, which together serve 36.28 million dwellings. The main data sources mobilised are summarised in Table 1, with their description and spatial resolution (address, building, IRIS (Ilots Regroupés pour l’Information Statistique), municipality).
Table 1
Data sources and spatial resolution.
| DATABASE | DESCRIPTION | SPATIAL RESOLUTION |
|---|---|---|
| GRDF customer database | Customer-level records from the main French gas distribution network operator | Address |
| National Building Database (BDNB, 2024) | National Building Database: comprehensive registry of building characteristics compiled by CSTB | Building/address |
| EPC/DPE database (ADEME, 2024) | National repository of energy performance certificates issued for French dwellings | Address |
| Population census (INSEE, 2022) | National population and housing census providing socioeconomic and demographic household characteristics | IRIS/municipality |
| Enerter residential model (Energies Demain, 2022) | Bottom-up residential model combining dwelling, household and energy demand data | IRIS/municipality |
| Local energy data – DLE (SDES, 2024) | Aggregated energy consumption by carrier published by the French energy statistics service | IRIS |
| France Chaleur Urbaine (FCU, 2025) | National registry of district heating networks providing geolocation, network characteristics and connection availability | Address/network segment |
The simulation runs on an annual time step over a given time horizon, as illustrated in Figure 3, and proceeds as follows:
Step A: equipment ages are updated; end-of-life events are sampled from technology-specific Weibull survival functions; anticipatory replacement events are drawn using EPC-class-weighted selection probabilities.
Step B: for all units selected for replacement, feasible technology options are identified, and choice probabilities are computed from three complementary matrices combining technical feasibility, territorial context, and household characteristics.
Step C: replacements are sampled, and the stock is updated; aggregated indicators (technology mix, final energy consumption, CO2 emissions) are computed for the simulation year.
The methodology for database construction follows three principles. First, when multiple sources provide similar information, the most reliable and spatially precise source is prioritised. Second, when information is only available at aggregated levels, statistical allocation methods are used to disaggregate variables consistently. Third, harmonisation rules and consistency checks are applied throughout to ensure coherence between identifiers, building types, heating configurations and energy carriers.
Building stock harmonisation
The BDNB is used as the backbone for describing the French building stock. It provides building-level information on geometry, usage and construction characteristics, and brings together data from several complementary sources, including cadastral and fiscal records, the social housing register (RPLS, Répertoire des Logements Locatifs des Bailleurs Sociaux), co-ownership registries, heritage protection databases, and Energy Performance Certificates (EPCs) selected at dwelling level.
A single BAN (Base d’Adresses Nationale, 2025) address identifier is retained for each building group (i.e. a building or group of buildings as defined in the BDNB structure) and used as the common key to link the BDNB with external datasets. When several BAN identifiers are associated with the same building, one reference BAN is selected to ensure a unique and consistent address for matching purposes.
The number of dwellings per building is a key variable for subsequent disaggregation. It is estimated using the information available in the BDNB, prioritising the most reliable sources depending on building type. House-type buildings are assumed to contain one dwelling, while collective buildings rely on reported dwelling counts from administrative sources. Few buildings for which no consistent dwelling count can be established are excluded from the analysis.
This process results in a consistent building-level dataset, with a unique address identifier which serves as the basis for allocating energy systems and modelling heating-system dynamics at consumption-unit level.
Energy matching with GRDF database
GRDF data is used to enrich our building database with customer-related information by linking gas metering points (PCE, Point de Comptage et d’Estimation) to the relevant buildings. The GRDF staging table is joined with the GRDF customer base to attach consumption variables (e.g. degree-day corrected consumption) and additional descriptors (building use, occupancy status). The resulting dataset is linked to the BDNB using the BAN identifier, producing candidate PCE-building associations at the address level.
When multiple PCEs are associated with a building, the number of retained PCEs is limited to the estimated number of dwellings in that building. In cases where more PCEs than dwellings are observed, only a number of PCEs equal to the dwelling count is retained. The resulting gap between the number of PCEs integrated into the database and the total number of GRDF PCEs used for residential heating remains below 2.5%.
Finally, the building dataset is expanded to reach a consumption-unit representation. For buildings with individual heating, records are first duplicated to match the number of gas consumption points (PCEs) identified in the building. If the estimated number of dwellings exceeds the number of PCEs, additional dwelling records are created to reach the total dwelling count; these additional dwellings are therefore assumed not to use gas heating. Buildings with collective heating systems are kept at the building level. After this expansion step, a unique consumption-unit identifier is assigned, producing the residential consumption-unit table used as input for the subsequent modelling stages.
Integration of energy performance certificates
The ADEME EPC database is integrated to enrich consumption units with standardised information on energy performance and heating system characteristics. As for the GRDF staging data, EPC records are harmonised on BAN identifiers to ensure consistency with the BDNB. EPCs are then assigned to consumption units at the address level under strict one-to-one constraints: at most one EPC per consumption unit and at most one consumption unit per EPC. When several EPCs exist for the same BAN address, they are first ranked by a reference date (most recent first) and limited to the number of consumption units observed at that address. Candidate EPC/consumption-unit pairs are then evaluated using a score based on consistency between dwelling type (house vs apartment), heating installation type (individual vs collective), energy carrier signals (gas PCE presence, district heating, electricity), and construction period/year consistency.
Allocation of heating energy
A standardised heating energy variable is defined at the dwelling level to assign a single energy carrier to each consumption unit. At this stage, only the main heating system is retained in order to simplify the representation of heating configurations and because it accounts for the largest share of energy consumption related to space heating. The attribution follows a hierarchical approach combining several information sources. When detailed energy information from energy performance certificates is available, it is used as the primary reference and mapped to a reduced set of energy categories (district heating, electricity, fuel oil, network gas, bottled gas, biomass and coal). To resolve residual missing values and to disambiguate mixed-energy cases, Local Energy Data (DLE, Données Locales de l’Énergie) at IRIS level are imported for electricity, natural gas and district heating (thermosensitive part). For the residential sector, IRIS-level shares are computed using the number of delivery points. These shares are then used to split mixed categories, with additional rules reflecting physical plausibility: for houses or individual heating, electricity-gas is resolved using PCE presence, while electricity-district heating is forced to electricity; for apartments with collective heating, electricity-district heating is collapsed to district heating (keeping one representative line per building when needed), and electricity-gas is again resolved using PCE presence. Remaining null values are assigned to a residual group representing other fuels (wood, coal, fuel oil or LPG).
Socio-demographic enrichment
A dedicated table is created to import the 2022 housing census extract (RP 2022), from which a limited set of variables is retained to characterise dwellings and households (location, dwelling type, construction period, surface class, heating characteristics and occupancy status). Remaining missing heating-energy values are completed using RP 2022 reference distributions by dwelling type, so that the simulated stock remains consistent with observed census structures.
Household profiles from RP 2022 are then assigned to simulated consumption units through a hierarchical matching approach based on geography and dwelling characteristics. The matching process progressively relaxes constraints when exact correspondences are not available, ensuring that all census profiles are allocated while preserving local distributions. Each consumption unit is associated with a single RP 2022 profile, providing a coherent description of household size, occupancy and basic socio-demographic attributes.
Socio-economic and fuel-poverty indicators are subsequently enriched using the Enerter residential model. Enerter households are matched to consumption units using a similar hierarchical logic, relying on dwelling attributes, heating characteristics and location. This combined RP 2022–Enerter enrichment provides a consistent representation of household income levels, tenure status and vulnerability indicators at the consumption-unit scale.
The final outcome is a table at consumption-unit scale combining variables listed in Table 2.
Table 2
Description of variables and their sources in the final database.
| VARIABLE GROUP | VARIABLES | SOURCE |
|---|---|---|
| Geographic identifiers | Intermunicipal cooperative structure (EPCI, Établissement Public de Coopération Intercommunale) code, INSEE municipality code, IRIS code, BAN address identifier | BDNB/BAN |
| Building characteristics | Construction period, dwelling category, number of dwellings in building, dwelling type, floor area | BDNB/EPC/RP 2022 |
| Heating system | Current heating energy, heating system, installation type, generator type, estimated installation year | EPC/ENERTER/RP 2022 |
| Energy performance certificate (EPC) | EPC label, EPC number, assessment method, EPC version, last modification date | EPC |
| EPC energy estimates | Heating demand, total energy consumption (5 uses, primary and final), heating consumption (primary and final), consumption per m², total and heating costs | EPC/ENERTER |
| Gas metering | GRDF meter identifier, normalised gas consumption (1-year and 3-year), number of gas metering points | GRDF DATABASE |
| Other energy networks | Number of electricity/gas/district heating metering points, district heating network identifiers and type, distance to district heating network | GRDF/DLE/FCU |
| Household profile | Number of persons, occupancy status, dwelling weight in sample | RP 2022/ENERTER |
| Socio-economic indicators | Income category, energy poverty indicators (TEE, TEL), net income, disposable income, living standard, conventional and actual housing expenditure | RP 2022/ENERTER |
Consistency checks
Consistency checks are performed to ensure that the integrated dataset remains aligned with reliable external references and does not introduce structural biases. Since missing energies are explicitly completed using RP 2022 reference distributions, the resulting heating energy mix is by construction consistent with census observations (RP 2022), which constitute a good available reference at national and local scales. Discrepancies observed on Figure 1 for biomass and electric heating shares may partly reflect the prevalence of dual electric-biomass systems in the French housing stock, where the distinction between primary and secondary heating systems is not always clearly reported by households.
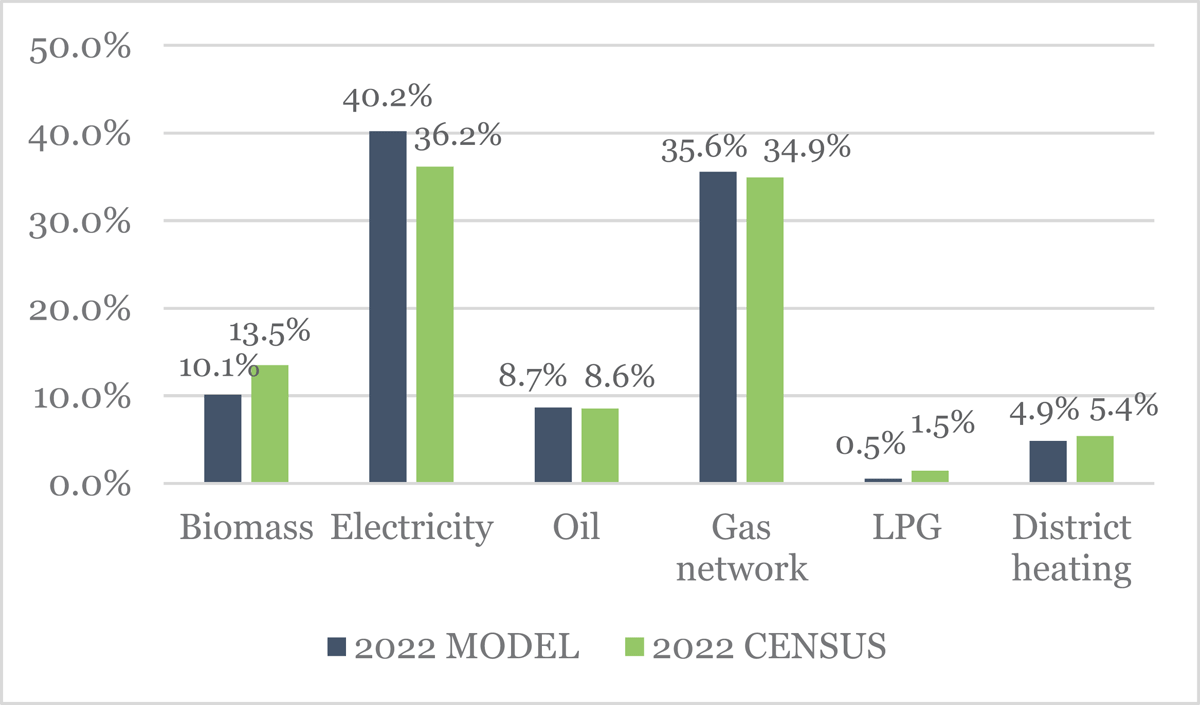
Figure 1
France energy mix in number of dwellings per heating energy source diagram.
Second, the distribution of energy performance classes (EPC) is benchmarked against independent stock-level statistics produced by the CSTB (Scientific and Technical Building Center). CSTB provides authoritative reference indicators on the French building stock, derived from national databases and probabilistic EPC reconstructions. EPC class shares are compared separately for individual and collective dwellings and aggregated into standard groups (A–C, D–E, F–G). These indicators are reconstructed from the final dataset and contrasted with CSTB reference values in Figure 2 to verify the consistency of both the housing structure and the energy-performance mix.
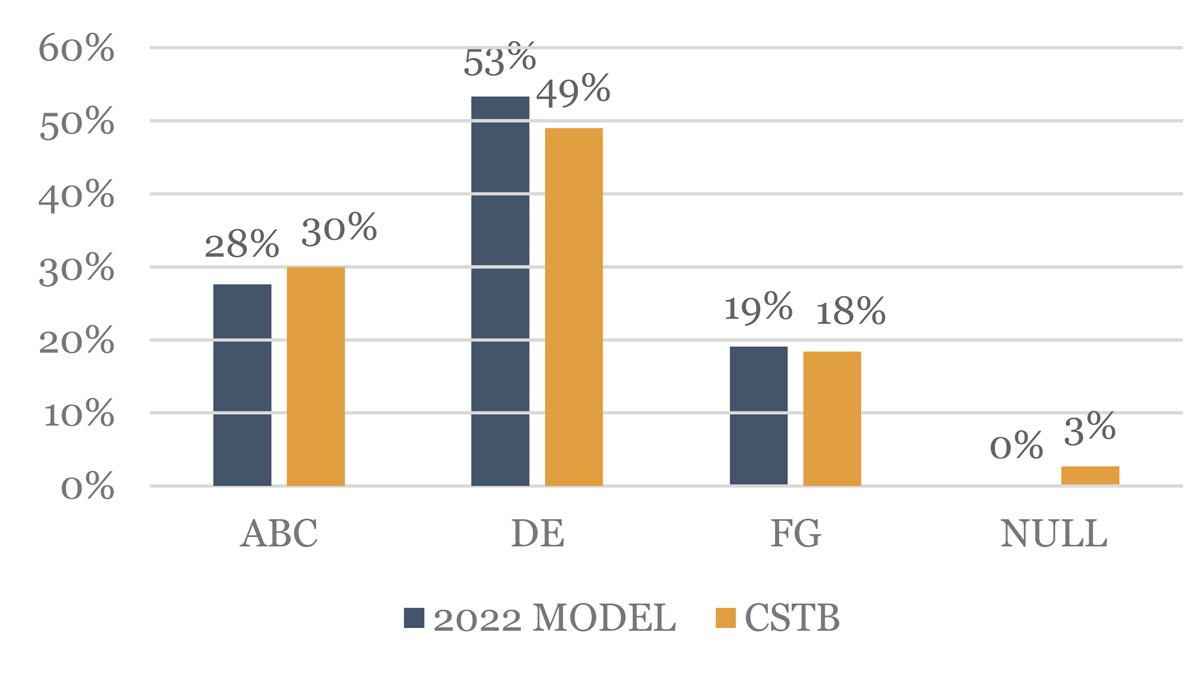
Figure 2
French distribution of EPCs (Energy Performance Certificate) classes.
Together, these comparisons provide a validation of the initial stock representation, ensuring that the simulated population of dwellings is coherent with both census data and high-quality external building-stock references.
Building heating stock evolution model
Building on the consumption-unit database described in Section 2, the dynamic model updates the heating system stock on an annual basis through three sequential steps. A summary diagram of the model structure is provided in Figure 3.
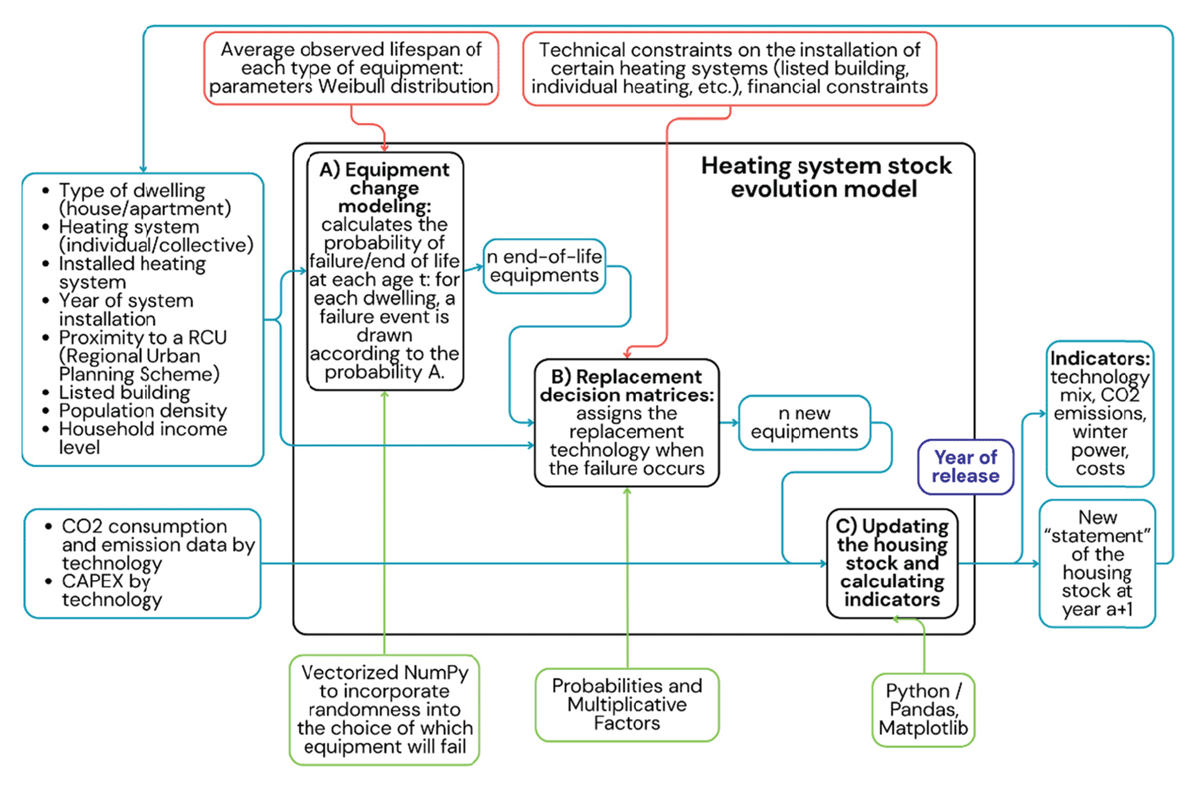
Figure 3
Building heating system stock evolution model diagram.
Equipment change modelling (Step A)
Heating system replacements can result from very different situations, which do not offer the same conditions for technology choice. Rao, Siam and Bond (2025), in a US-focused review of over two hundred studies on heat pump adoption, formalise this observation: the replacement decision decomposes into two successive steps, the decision to retire the existing system and the choice of replacement technology. The first step is generally triggered by exogenous events, primarily equipment failure, and remains poorly studied empirically. Yet it conditions access to the technology selection window: the nature of the trigger determines the time available to the household to compare alternatives and therefore the probability that it will opt for a different technology.
Empirical evidence consistently identifies the failure-driven modality as quantitatively dominant. Ipsos MORI and the Energy Saving Trust (2013), in a representative survey of 2,900 British homeowners commissioned by the Department of Energy and Climate Change, find that outright breakdown or imminent end-of-life signals total 61% of past replacements, against only 13% attributable to broader renovation works. The same survey establishes that 70% of households would only consider anticipatory replacement if their system started to require considerable repairs, a result obtained in a context explicitly without financial incentives. In France, the TREMI survey (SDES, 2021), restricted to heating system replacement gestures (27% of renovating households), shows that 46% of replacements are triggered by breakdown or obsolescence. A further 14% concern systems over 20 years old among respondents who reported their system age, bringing the total to at least 60% of replacements linked to actual or imminent failure.
These results converge to justify a baseline assumption of 60% failure-driven replacements and 40% planned replacements for modelling purposes, consistent with both the French TREMI 2020 data (60%) and the British Ipsos MORI data (61% in a context without financial incentives for replacement).
To model the first step, the decision to retire the existing system, the literature offers a range of tools for modelling survival times, including parametric distributions (with Weibull being the most common), non-parametric methods (Kaplan-Meier), and hybrid approaches. These tools are particularly well suited to exploiting partial or heterogeneous data (for example, a few observed ages, lifetime quantiles, or manufacturer statistics) and transforming them into risk curves and annual replacement probabilities that can then be used in dwelling-level simulations.
Kaplan-Meier (KM) is a non-parametric survival-curve estimation method that uses individual observations to construct stepwise survival probabilities without imposing a functional form, which is useful when empirical failure or end-of-life data are available. In the literature, Kaplan-Meier is often used to calibrate a Weibull distribution (Khuntia et al., 2023), which is a standard parametric reliability model with two parameters. In our case, empirical failure data are not available; we therefore rely exclusively on a Weibull model, which is well suited when empirical data are lacking but aggregated reference values (mean, standard deviation, etc.) are available.
The Weibull parameters can then be calibrated from these reference values, directly yielding a risk function and annual replacement probabilities that can be used to feed a dwelling-level simulation. This approach is recommended and extensively documented in classical reliability references (such as NIST (National Institute of Standards and Technology) guides (NIST/SEMATECH, 2012)) and has also been applied in HVAC (Heating, Ventilation and Air Conditioning) and building contexts (Massachusetts Program Administrators, 2020).
Equipment end-of-life is modelled with a Weibull lifetime distribution, widely used in reliability analysis and allowing increasing failure risk with age when the shape parameter β > 1. The survival function is:
Parameterisation is based on reference median lifetimes by technology (and, when needed, additional quantiles or a coefficient of variation). When quantiles are available (e.g. q50, q90 as S(q50) = 0.5 and S(q90) = 0.1), (λ, β) are identified directly; otherwise
The resulting Weibull parameters are reported in Appendix, Table A1.
For each dwelling-year, the annual failure probability is computed as the conditional probability of failing between age t and t+1:
End-of-life events are represented with a probabilistic trigger applied each year at dwelling level. For each heating system, the model derives an age-dependent annual probability of failure from the survival curve and compares it to a random draw. If the draw falls below this probability, the system is considered to reach end-of-life and is replaced; otherwise, it remains in operation for another year. This introduces realistic dispersion in replacement timing across the stock, even for systems of the same technology and age.
In addition to these failure-driven replacements, the model accounts for the remaining 40% of replacements through an anticipatory mechanism, motivated by renovation or energy-performance improvements. These events correspond to households replacing a functioning heating system in order to improve energy efficiency or during renovation works. In the model, the probability of such non-urgent replacement events depends on the energy performance of the dwelling, as reflected by its EPC class. Dwellings with poorer energy performance are assumed to have a higher probability of replacing their heating system in order to improve efficiency. Accordingly, anticipatory replacements are drawn using a random weighted selection across eligible dwellings, with selection weights decreasing from class G to class D: 1.0, 0.6, 0.3 and 0.1 respectively. This gradient is consistent with the regulatory pressure introduced by the loi Climat et Résilience (2021), which progressively bans the rental of energy-inefficient dwellings from the market: class G dwellings since January 2025, class F dwellings from 2028, and class E dwellings from 2034. For simplicity, no anticipatory replacements are assumed for dwellings in classes A, B or C, which typically correspond to relatively recent or already efficient buildings equipped with modern heating systems. The weights were set based on expert assumptions to reflect the empirical observation that renovation incentives and replacement decisions are more likely to occur in poorly performing dwellings; to the best of our knowledge, no empirical calibration target is currently available for these weights at national scale, and future work could refine these values using observed replacement rates by EPC class.
Matrix-based formulation of technology choice (Step B)
When a failure occurs, a replacement module determines the new technology under a hierarchical logic reflecting real-world constraints. The technology choice mechanism is formalised through three complementary matrices that decompose replacement decisions into distinct and interpretable components.
First, a Technical Constraint Matrix captures what is physically feasible or likely given the dwelling configuration. It combines building structure (house vs apartment), the current heating system (hydronic vs direct electric), heating mode (individual vs collective), dwelling size (e.g., small surfaces where some options are not relevant), and final energy for heating. This matrix defines, for each technology, a baseline likelihood reflecting technical feasibility rather than preference.
Second, a Territorial Matrix accounts for the influence of local context. It incorporates urban density (space/noise constraints for outdoor units, feasibility of biomass storage), proximity or eligibility for district heating networks and district heating projects, availability of gas infrastructure, and climate zone. These factors do not create options but rather enhance or penalise technically feasible ones, reflecting territorial favourability or constraints.
Third, a Decision Matrix represents socio-economic and regulatory drivers at household level, including occupancy status (owner vs tenant), income level (ability to invest and access to subsidies), EPC class (e.g., landlords’ incentives to improve poor labels outside emergency situations), and eligibility thresholds for public subsidies. This matrix translates behavioural and institutional effects into adjustments of relative attractiveness across technologies.
For each candidate technology, the three components are combined multiplicatively to produce a raw score. The technical matrix defines the base level of feasibility, while the territorial and decision matrices act as scaling factors that increase or decrease this baseline according to context. Final choice probabilities are obtained by normalising these scores across all available technologies, ensuring that probabilities sum to one.
This formulation allows the model to separate feasibility, territorial context, and household decision drivers, while remaining transparent, extensible, and consistent with observed replacement behaviours. Selected entries of the three matrices are reported in Appendix, Tables A2, A3 and A4 to illustrate the main patterns encoded in each component.
The numerical values in these matrices were initially derived from expert knowledge of heating system replacement practices in the French residential sector, then lightly calibrated to ensure broad consistency with available aggregate trend data, including district heating network connection rates (FEDENE, 2025) and national heating equipment sales figures published by Uniclima (2026).
Updating the housing stock and calculating indicators (Step C)
Once a replacement decision is sampled, the dwelling record is updated accordingly: the installed technology is replaced, the installation year is reset to the current simulation year, the heating energy carrier is updated, and the dwelling may gain one EPC class if the new system achieves a higher energy performance rating. Final energy consumption and CO2 emissions are then recomputed at the dwelling level following the methodology described below.
To quantify the impact of heating-system replacement on final energy consumption, we adopt a useful-energy accounting approach commonly used in bottom-up building-stock modelling because it preserves physical consistency when technologies change (Nägeli et al., 2020; Dong et al., 2023). In this framework, the dwelling’s heat demand is treated as constant in the absence of deep renovation, while final energy consumption varies according to the efficiency of the installed heating system.
Baseline heating consumption is defined at dwelling level using two complementary sources: degree-day-corrected metering data from GRDF for gas-heated dwellings when available (around 8 million units), and statistically allocated consumption estimates for the remaining dwellings derived from local energy statistics (Données Locales de l’Énergie), combined with information on dwelling floor area, EPC energy-performance characteristics and installed heating-system technology. Because GRDF values are already climate-corrected, no additional weather normalisation is applied in the simulation.
Baseline final energy consumption E0 is converted into an implied useful heat demand Q using technology-specific performance parameters. For combustion systems, useful demand is calculated as Q = η0E0, while for heat pumps it is defined as Q = COP0E0. When a heating system is replaced, post-replacement technical consumption is computed using the same useful demand and the performance of the new technology: E1* = Q/η1 for combustion systems and E1* = Q/COP1 for heat pumps.
Heat pump performance varies with climate conditions and building characteristics, and measured seasonal performance can differ from nominal Coefficient of Performance (COP) values. To capture this variability while keeping the model tractable at national scale, representative average seasonal COP values measured in real operating conditions are used by technology type, drawn from a field campaign conducted on 100 residential heat pumps across France (ADEME, 2025a): 2.9 for air-to-air heat pumps and 4.1 for ground-source heat pumps. Air-to-water heat pump performance is further differentiated across French climate zones (H1, H2, H3). For combustion systems, performance coefficients are drawn from the Effinergie B2C2 building energy calculation methodology (Pouget Consultants & ADEME, 2021). The coefficients used in the baseline configuration are reported in Table 3.
Table 3
Performance coefficients used for each heating technology.
| TECHNOLOGY | PERFORMANCE PARAMETER | SOURCE |
|---|---|---|
| High-efficiency gas boiler | η = 0.92 | Pouget/ADEME (2021) |
| Standard gas boiler | η = 0.60 | Pouget/ADEME (2021) |
| Oil boiler | η = 0.7 | Pouget/ADEME (2021) |
| Biomass boiler | η = 0.75 | Pouget/ADEME (2021) |
| Wood stove/insert | η = 0.65 | Pouget/ADEME (2021) |
| Electric resistance heating | COP = 1.0 | Pouget/ADEME (2021) |
| Air-to-air heat pump | COP = 2.9 | ADEME (2025a) |
| Air-to-water heat pump | COP = 2.6 (H1), 3.0 (H2), 3.4 (H3) | ADEME (2025a) |
| Ground-source heat pump | COP = 4.1 | ADEME (2025a) |
| District heating | η = 1.0 | Pouget/ADEME (2021) |
[i] Note: A single representative value is retained per technology for tractability at national scale. Future work will differentiate performance coefficients by renovation status and heating system type (individual vs. collective), following the full parameter tables of Pouget/ADEME (2021).
The model accounts for behavioural responses through a direct rebound effect, whereby a fraction of the technical energy savings translates into increased thermal comfort rather than reduced energy consumption. Realised consumption after replacement is therefore defined as . The empirical literature documents substantial heterogeneity in this parameter. Aydin et al. (2017), exploiting a panel of 563,000 Dutch dwellings, estimate a direct rebound of 41% among tenants and 27% among homeowners, with the effect reaching approximately 49% for the lowest income quintile among tenants and 38–40% for the upper quintiles. These estimates are however derived from a before-and-after retrofit methodology, which is known to produce upward-biased rebound estimates as engineering models tend to overpredict expected savings. Hediger (2022), drawing on more recent European data collected during a period of markedly higher energy prices, addresses this limitation by estimating the rebound through the elasticity of the heating service with respect to efficiency, and reports considerably lower estimates: approximately 11% for the lowest income category, and in the range of 5–9% for other income groups. As the magnitude of the rebound effect is sensitive to both the estimation method and the prevailing cost of energy services, the more recent estimates are retained as the primary calibration basis. Following Hediger (2022), and consistent with the income gradient documented by Aydin et al. (2017), the rebound parameter r is set to 0.11 for the lowest-income households and 0.05 for the highest-income group, on the grounds that energy-constrained households tend to allocate a larger share of efficiency gains to comfort improvements rather than to energy savings.
In addition to final energy consumption, the model tracks annual CO2 emissions associated with residential space heating. Emissions are calculated at the consumption-unit level and aggregated to produce national trajectories. The accounting framework focuses on direct territorial CO2 emissions associated with energy use for heating and does not include lifecycle emissions related to fuel production or infrastructure.
Emission factors are derived from the ADEME Base Carbone®, the official French reference database for greenhouse-gas emission factors (ADEME, 2025b).
For combustion-based heating systems, annual emissions are calculated as , where Efinal represents final energy consumption after efficiency and rebound adjustments and EF is the emission factor associated with the energy carrier. For electrically driven systems such as electric resistance heating and heat pumps, indirect emissions are calculated as where EFelec(t) represents the carbon intensity of electricity generation, which varies across scenarios as described in the following section.
The model does not account for new construction, demolition, or deep renovation dynamics. At national scale, these flows represent a second-order effect over the simulation horizon: new construction is projected at approximately 310,000 dwellings per year over 2020–2030 and 100,000 per year over 2040–2050 (Ministère de la Transition Ecologique, 2026); demolitions are estimated at approximately 30,000 units per year (Cerema, 2025); and deep energy retrofits reached 91,000 in 2024 and 120,000 in 2025 (Anah, 2025; Anah, 2026), well below the government target of 200,000 per year. The aggregate impact of these flows on national-level technology mix and emission trajectories is therefore limited over the period considered.
Decarbonisation scenarios for energy carriers
The CO2 emission trajectories presented in Figure 7 are produced by varying the carbon intensity of energy carriers over the simulation period, while keeping the technology replacement dynamics identical across scenarios. Three scenarios are defined, ranging from a continuation of current conditions to a full decarbonisation of all energy carriers by 2050.
In all three scenarios, emission factors for fuel oil (0.32 kgCO2/kWh) and biomass (treated as carbon-neutral under territorial accounting conventions) remain unchanged. The scenarios differ only in their assumptions regarding electricity, district heating, and the gas network mix.
Scenario 1: Reference scenario assumes that the carbon intensity of each energy carrier remains at its 2024 reference value throughout the simulation period. Emission factors are drawn from the ADEME Base Carbone® (v23.10): 0.0926 kgCO2/kWh for electricity, 0.091 kgCO2/kWh for district heating (FEDENE, 2025), 0.32 kgCO2/kWh, PCI for oil, and 0.228 kgCO2/kWh for the gas network, reflecting a mix of 95% natural gas (0.24 kgCO2/kWh, PCI) and 5% biomethane (0.0417 kgCO2/kWh). This scenario isolates the contribution of technology mix renewal to emission reductions, independently of any progress in energy carrier decarbonisation.
Scenario 2: Partial decarbonisation assumes a progressive reduction of 50% in the carbon intensity of electricity and district heating, and a 50% biomethane share in the gas network mix by 2050, applied as a linear interpolation from 2024 values. This yields end-of-period emission factors of 0.0463 kgCO2/kWh for electricity, 0.0455 kgCO2/kWh for district heating, and 0.1409 kgCO2/kWh for gas.
Scenario 3: Full decarbonisation assumes that electricity and district heating reach zero carbon intensity by 2050, and that natural gas is fully substituted by biomethane over the same period, also applied progressively. The end-of-period emission factor for the gas network converges to 0.0417 kgCO2/kWh. This scenario represents an upper bound on the contribution of energy carrier decarbonisation and is broadly aligned with the ambitions of the French National Low-Carbon Strategy (SNBC 3, Ministère de la Transition Ecologique, 2026).
First results
Before presenting prospective results, it is necessary to clarify the baseline from which the simulations start. Any dynamic trajectory is mechanically conditioned by the structure of the initial stock; its size, composition and internal distributions therefore directly shape subsequent renewal flows and energy transitions.
To assess both the credibility of the initial configuration and the plausibility of projected dynamics, the model results are systematically compared with national reference statistics produced by CEREN (Centre d’Études et de Recherches Économiques sur l’Énergie). CEREN provides benchmark estimates of energy consumption, heating-system distribution and building-stock characteristics for the residential, tertiary and industrial sectors in France, based on administrative data, energy supplier information and dedicated statistical analyses.
The constructed database contains 36.28 million residential dwellings, compared with 36.69 million dwellings reported by CEREN (2019–2024 statistical series) and 37.14 million according to the 2022 population census. The relative deviation remains below 2.5%, indicating that exclusions due to harmonisation rules and consistency filtering are low and probably do not materially affect national representativeness.
To characterise the starting point of the simulation, Figure 4 presents the distribution of main heating systems in 2022 as represented in the constructed database. These figures are compared with CEREN reference statistics. Beyond validating the initial configuration, CEREN data also serve as an external benchmark for assessing the consistency of simulated trajectories with observed historical trends.
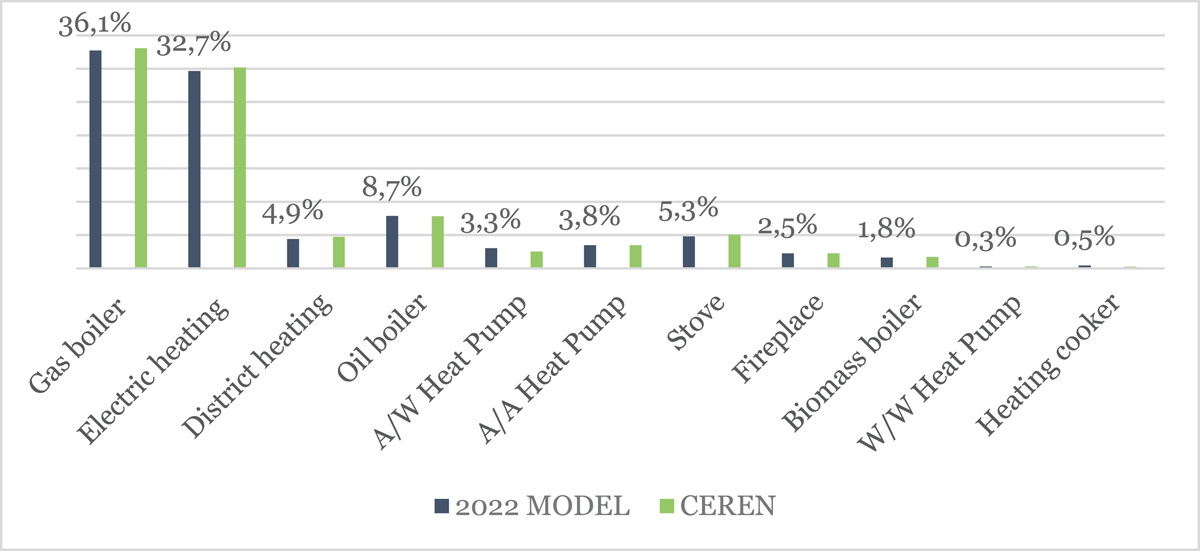
Figure 4
Distribution of main residential heating systems in 2022 (modelled database vs. CEREN reference).
Evolution of the energy market shares
The “trend” scenario assumes continuation of behaviours observed over 2020–2024: replacement urgency shares, technology preferences embedded in the decision rules, and the same constraint structure. It also assumes no new public policies beyond those already reflected in the calibrated period (no additional bans/subsidy reforms), and no endogenous acceleration from learning effects. This provides a neutral baseline against which various policy scenarios can be tested. Figure 5 compares the market shares of CEREN stocks with the trend generated by the model, with the aim of verifying that the model successfully replicates the existing trend for 2022–2024.
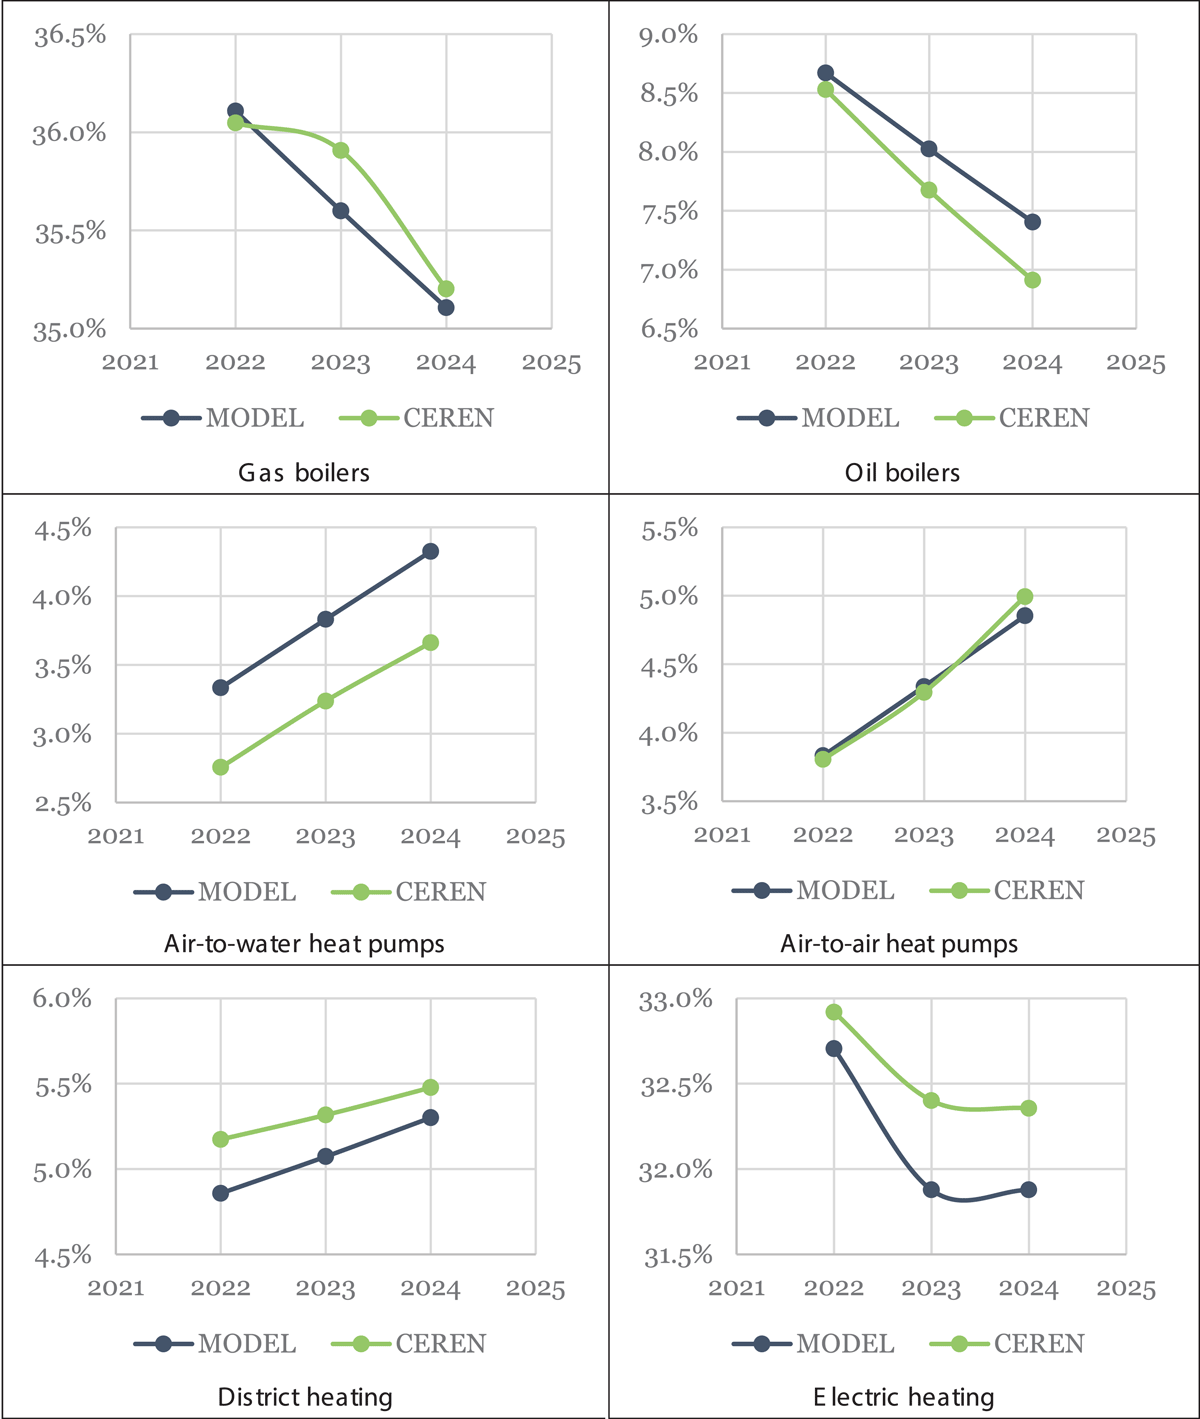
Figure 5
Evolution of the market share by technology (comparison between the model and CEREN data between 2022 and 2024).
Consumption and CO2 emissions projections to 2050
Following validation of the model against CEREN consumption trends, the simulation is run through 2050 to produce long-term projections of final energy consumption and CO2 emissions associated with residential space heating. Figure 6 illustrates the evolution of final energy consumption by heating technology. The most notable trends are the near-complete phase-out of oil boilers and a substantial decline in gas boiler consumption, which nonetheless remains the dominant technology throughout the period. These are partially offset by a marked increase in heat pump and district heating consumption, reflecting a gradual shift toward lower-carbon technologies. Electric resistance heating declines moderately over the period.
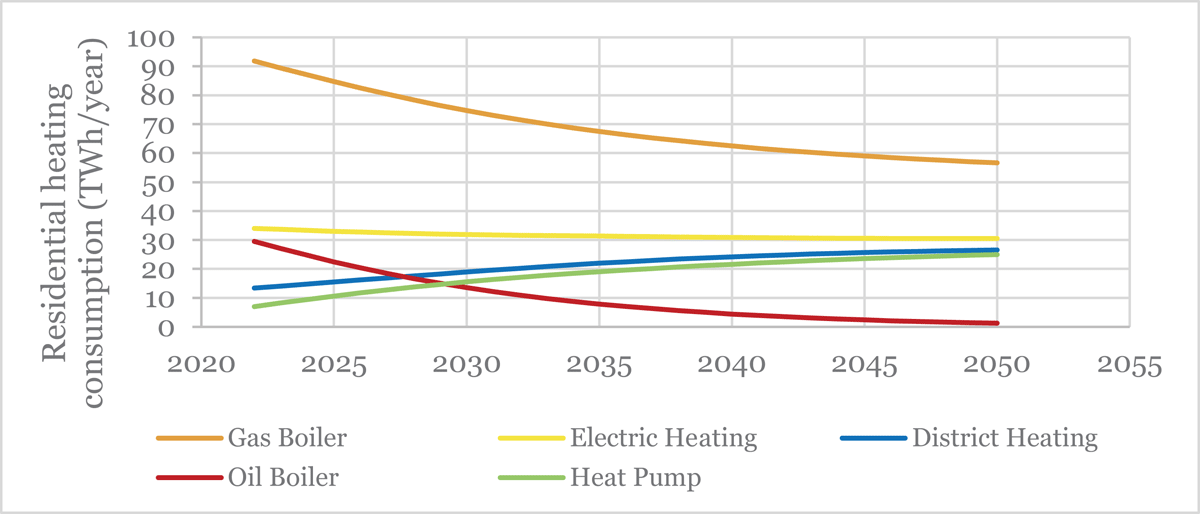
Figure 6
Evolution of residential heating consumption by technology up to 2050.
Figure 7 presents the resulting CO2 emission trajectories under the three decarbonisation scenarios for energy carriers. All three scenarios exhibit a declining trend, but the pace and magnitude of reduction differ substantially. Under scenario 1, driven primarily by the shift in technology mix, emissions decline by around 43% by 2050. Scenario 2, incorporating a more ambitious decarbonisation of electricity and district heating, achieves a reduction of approximately 66%. Scenario 3, combining full decarbonisation of electricity and district heating with a complete substitution of natural gas by biomethane in line with government objectives, reaches a reduction of around 83% by 2050. These results indicate that the two levers contribute reductions of comparable magnitude: stock renewal alone delivers a 43% reduction by 2050, and energy carrier decarbonisation adds a further 23 to 40 percentage points depending on ambition. Neither lever is sufficient on its own to approach net-zero residential heating; carrier decarbonisation is necessary for the deepest reductions, but it amplifies rather than substitutes for the contribution of stock renewal.
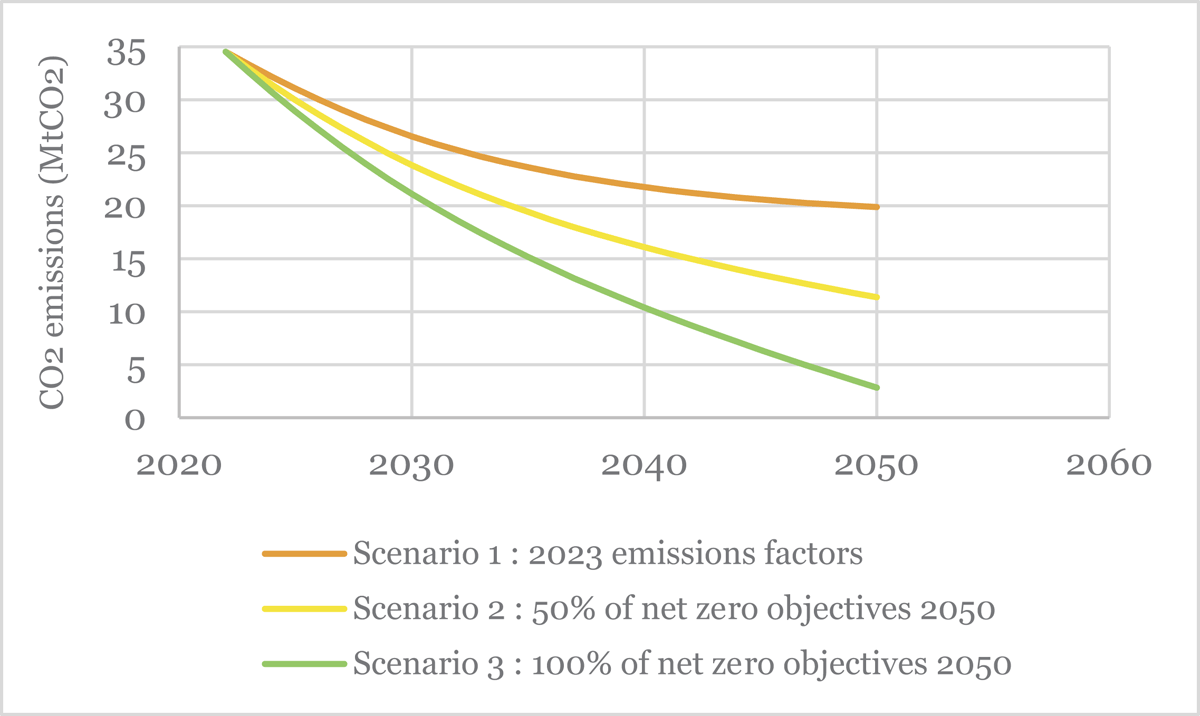
Figure 7
Evolution of CO2 emissions from residential heating up to 2050.
Heterogeneous replacement dynamics by tenure status
The shares reported below follow from the tenure- and EPC-dependent weights of the household decision matrix (Appendix, Table A3), which were set to reproduce the mechanisms described in the literature. They are best read as the quantified implications of these encoded assumptions rather than as independent model outcomes.
Figure 8 presents the share of each tenure category in the total flow of heat pump installations over the 2022–2050 period. Owner-occupiers dominate this flow, accounting for 85.5% of installations. This structural dominance is intended to capture owner-occupiers’ direct benefit from improved thermal comfort, together with the absence of split-incentive barriers that constrain landlord behaviour in the private rental sector, landlords capture only part of the value of a heating system upgrade, since comfort and running-cost benefits accrue to the tenant, which weakens their incentive to invest even where their investment capacity is comparable to that of owner-occupiers.
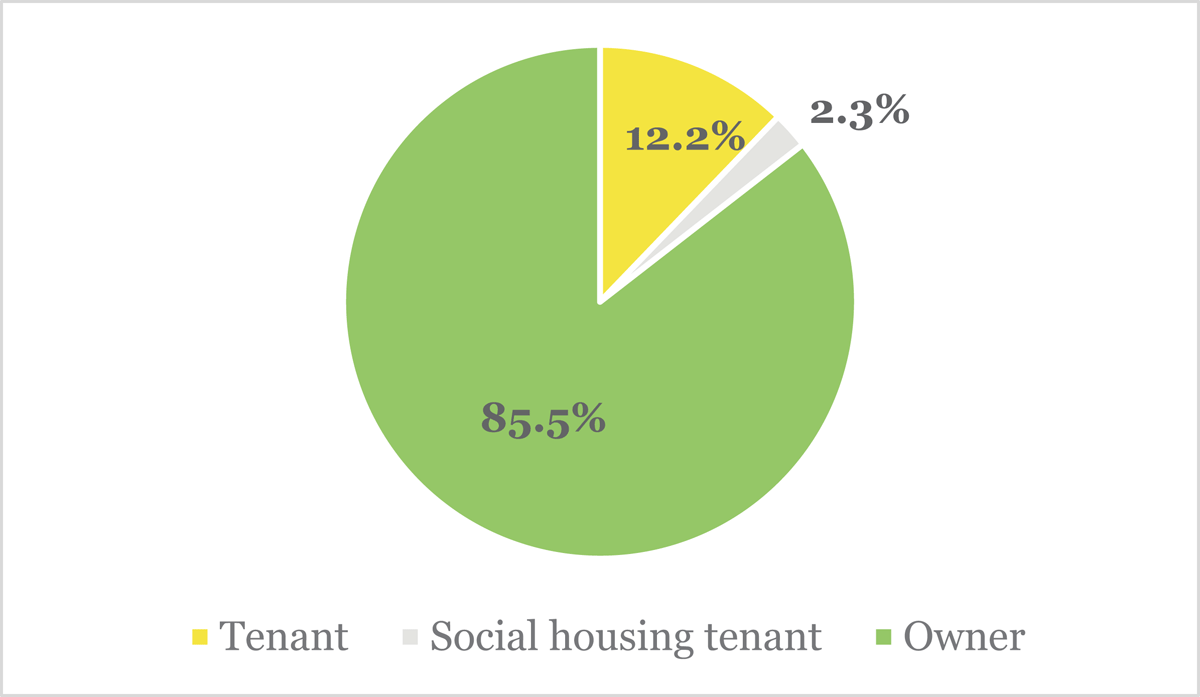
Figure 8
Who installs heat pumps? Share by tenure status (reference scenario).
Private tenants account for 12.2% of installations. This share is best interpreted as the outcome of a regulatory-driven installation dynamic as encoded in the E–G weighting of Table A3. Successive legislative restrictions on the rental of energy-inefficient dwellings (classified E, F, and G under the French DPE framework) create a binding incentive for private landlords to undertake renovation works including heating system replacement, with heat pumps frequently selected as the preferred solution given their potential to improve the energy label.
Social housing tenants account for a marginal share of around 2.3%. This reflects the organisational and technical specificities of this segment: heating decisions are centralised at the level of social landlords, dwellings are predominantly collective, and a substantial proportion are connected to district heating networks, which structurally limits the relevance of individual heat pump installations as the primary decarbonisation pathway in this segment.
Figure 9 presents the income-group composition of owner-occupiers who replace their heating system with a heat pump, expressed as a 100% stacked share, in 2035, a year chosen arbitrarily as the distribution remains stable over the period 2022–2050.
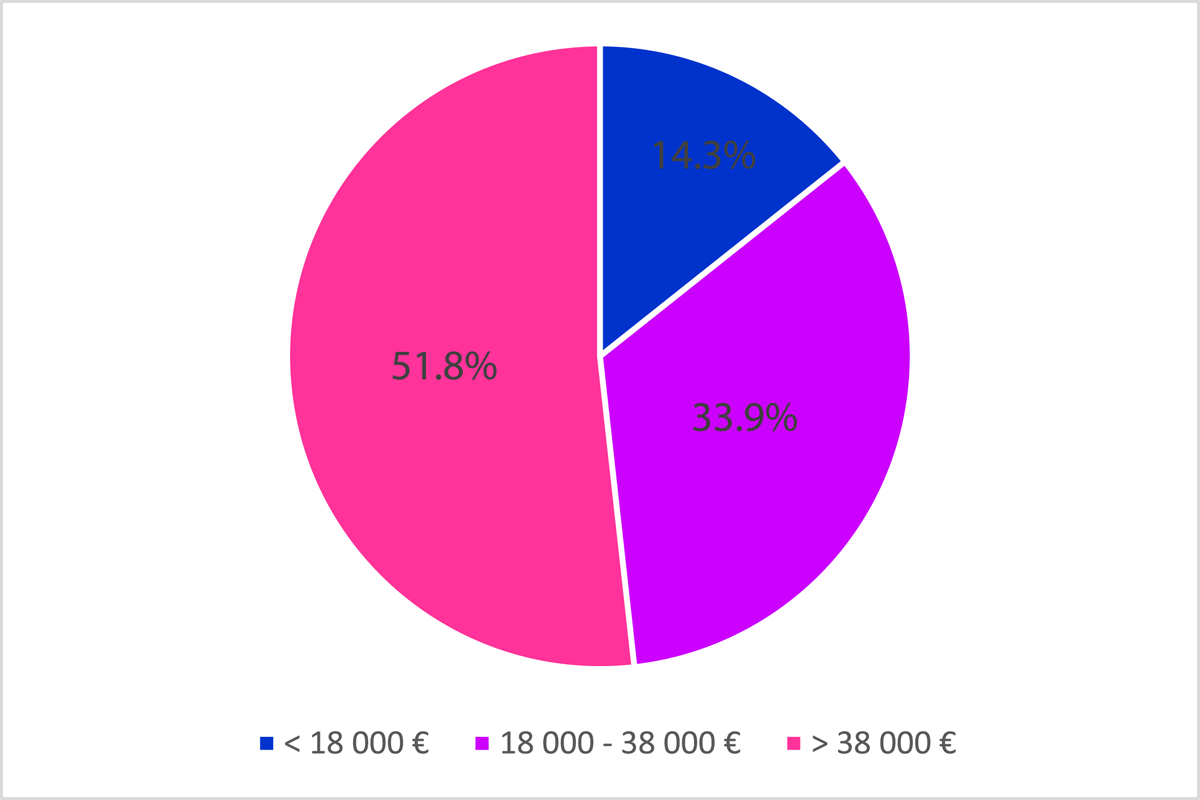
Figure 9
Distribution of owner-occupiers replacing their heating system with a heat pump, by income.
Very low-income households (<€18,000) account for approximately 14% of replacements, middle-income households (€18,000–38,000) for approximately 34%, and high-income households (>€38,000) for approximately 52%.
These results can be compared with the TREMI survey (SDES, 2021), which reports the income distribution of more than 1.7 million owner-occupiers replacing their heating system with a heat pump in three comparable brackets: approximately 16% below €18,000, 40% between €18,000 and €38,000, and 43% above €38,000. Our model reproduces the same broad ordering (a minority of replacements concentrated among the lowest-income households, with the two higher brackets accounting for the bulk of the flow) though it somewhat understates the share of middle-income households (34% against 40% in TREMI) and correspondingly overstates the share of high-income households (52% against 43%). The discrepancies remain within reasonable limits and can be explained, in particular, by differences between the income gradient encoded in the decision matrix and the support schemes actually in force at the time of the TREMI survey.
In contrast with Figures 8 and 10, which reflect the weights encoded in the decision matrix, this comparison provides a semi-independent check: the income distribution of heat pump adopters was not used as a calibration target when setting the decision matrix, so the agreement with TREMI in ordering and order of magnitude constitutes genuine external corroboration of the encoded income gradient. The lack of a reference source combining data on income, benefit receipt and technological choices in the housing sector nonetheless limits the scope for more detailed validation.
Figure 10 illustrates this dynamic in more detail. It shows, for each income bracket, the percentage of owner-occupier households switching their heating system to a heat pump; the curves should therefore be interpreted independently of one another. The share for the lowest income bracket (<€18,000) is notably high throughout the period. This pattern is a direct consequence of the household decision matrix, in which low-income owner-occupiers are assigned a higher relative attractiveness for heat pumps than middle-income owner-occupiers (Appendix, Table A3). These weights were set to reflect the existence of income-targeted conversion subsidies in France, but subsidy schemes are not explicitly modelled: the result should therefore be read as a property of the encoded assumptions rather than as an independent model prediction. Explicit representation of subsidy eligibility and amounts is the subject of ongoing work. All three curves rise over time: as the heat pump stock in the housing park grows, a growing share of replacements are like-for-like, since a household that has already adopted a heat pump has a relatively high probability of replacing it with another one rather than switching back. This composition effect pushes the heat pump share upward across all brackets, independently of any change in the underlying propensity of new adopters.
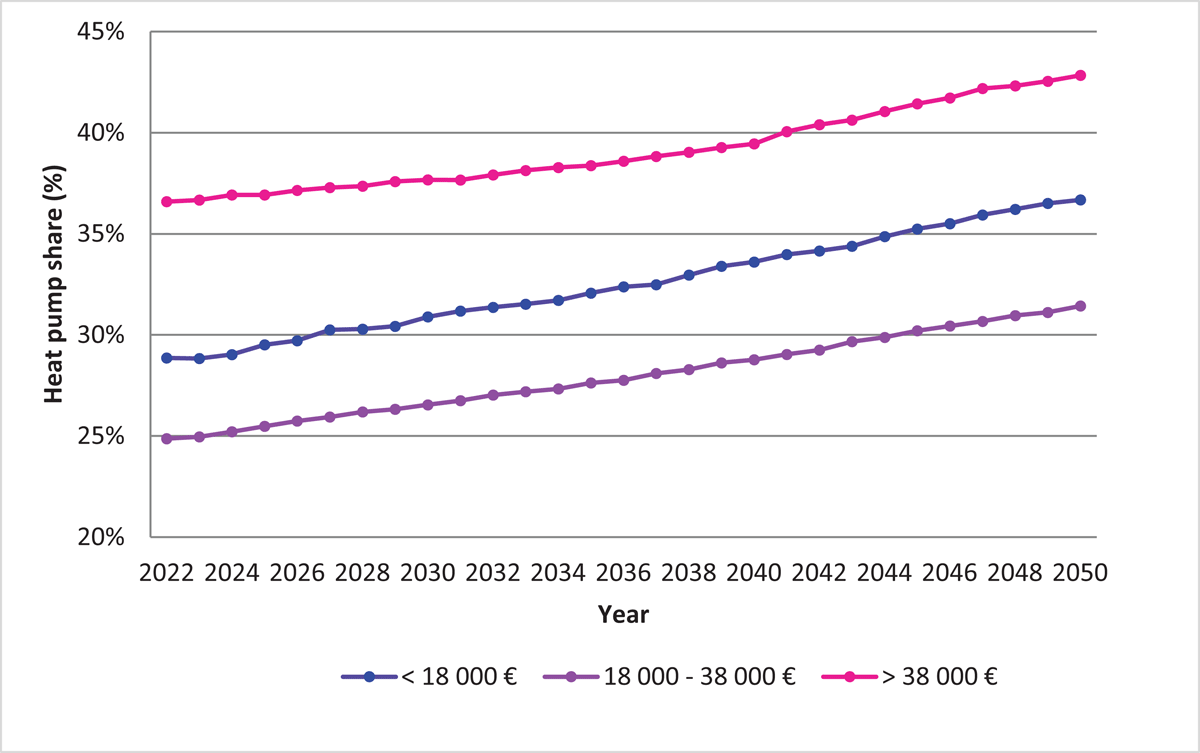
Figure 10
Heat pump share among replacements, by income bracket (homeowners, 2022–2050).
This raises a separate question, not directly visible in Figure 10 but raised by the model’s underlying assumptions, concerning the medium-term trajectory of very low-income households specifically. The model assumes that equivalent support will remain available when these systems reach end-of-life, roughly 15 to 20 years later. This assumption is uncertain, since eligibility conditions and scheme budgets may evolve over that horizon, and households that have already benefited from a first subsidised installation may not automatically qualify for a second one.
Conclusion and perspectives
This paper develops a dynamic bottom-up model of the French residential heating stock, designed to analyse the impact of heating-system renewal on energy consumption and CO2 emissions. By representing the stock at the level of individual consumption units and explicitly modelling equipment ageing, failure events and replacement choices, the framework provides a consistent representation of the mechanisms driving the long-term evolution of heating technologies. The results demonstrate that heating system renewal alone, without building envelope renovation, already drives a substantial reduction in residential heating emissions (43% by 2050 at constant carrier carbon intensity), and that energy carrier decarbonisation contributes a further reduction of comparable magnitude, both levers being required to approach the deepest trajectories. Beyond these aggregate findings, the dwelling-level resolution of the framework opens analytical perspectives that aggregated models cannot provide: identifying which household segments (by income, tenure status, or energy performance class) drive or lag the technology transition, assessing the distributional effects of policy instruments across these groups, and quantifying replacement flows at the level of individual technologies and territories. A first illustration of these capabilities is provided in Figures 8, 10, where replacement dynamics are disaggregated by tenure status and by income group. Further disaggregation by EPC class and urban density, combined with the explicit simulation of policy instruments, is the subject of ongoing work.
The modelling approach could be subject to further refinements.
At local scale, however, new construction and deep renovation dynamics become first-order drivers of the technology transition, as the share of newly built or deeply renovated dwellings in a given territory can be substantially higher than the national average. Integrating these dynamics is therefore a necessary step for sub-national applications of the framework.
The validation window currently covers 2022–2024, a three-year period that is acknowledged as insufficient to fully assess the dynamic behaviour of a model designed to project to 2050. This limitation stems from the fact that the consumption-unit database is initialised in 2022, which precludes any retrospective comparison with earlier stock configurations. As CEREN updates its reference statistics, extending the validation window to 2025 and beyond will provide additional evidence on the model’s ability to reproduce observed technology transitions. Future work will also explore indirect validation approaches to strengthen the robustness of the framework.
Future developments could strengthen the framework by integrating renovation scenarios, refining performance assumptions for heat pumps, and introducing more detailed representations of policy instruments, with a view to analysing a broader range of residential decarbonisation pathways. In particular, the present paper focuses on the construction and validation of the modelling framework; the simulation of explicit policy instruments, such as subsidy reforms, fossil boiler phase-out schedules, or district heating connection obligations, will be the subject of subsequent work.
Future work should also include a systematic sensitivity analysis of the key expert-calibrated parameters, in particular the anticipatory replacement weights by EPC class and the breakdown-to-anticipatory replacement ratio, which was set to 60/40 based on a median of heterogeneous sources.
Additional File
The additional file for this article can be found as follows:
Data Accessibility Statement
The datasets used in this study combine publicly accessible, restricted, and proprietary sources. The BDNB and the Energy Performance Certificate database are openly accessible through the French open-data platform (data.gouv.fr). The population census (RP 2022, INSEE) and the Local Energy Data (Données Locales de l’Énergie, SDES) are publicly available through official statistical channels. The France Chaleur Urbaine dataset (FCU) is accessible through the national district heating network registry (france-chaleur-urbaine.beta.gouv.fr). The GRDF gas metering database was made available under a data-sharing agreement and cannot be redistributed. The Enerter residential model (Energies Demain) is a proprietary commercial dataset and is not publicly accessible. The model code and parameter values are available from the corresponding author upon reasonable request.
Author Contributions
Azilis Le Bozec: Conceptualization, Methodology, Software, Formal analysis, Data curation, Visualization, Writing – original draft. Bruno Duplessis: Supervision, Writing – review and editing. Nourallah Melliti: Supervision, Writing – review and editing. Pascal Stabat: Supervision, Writing – review and editing.