
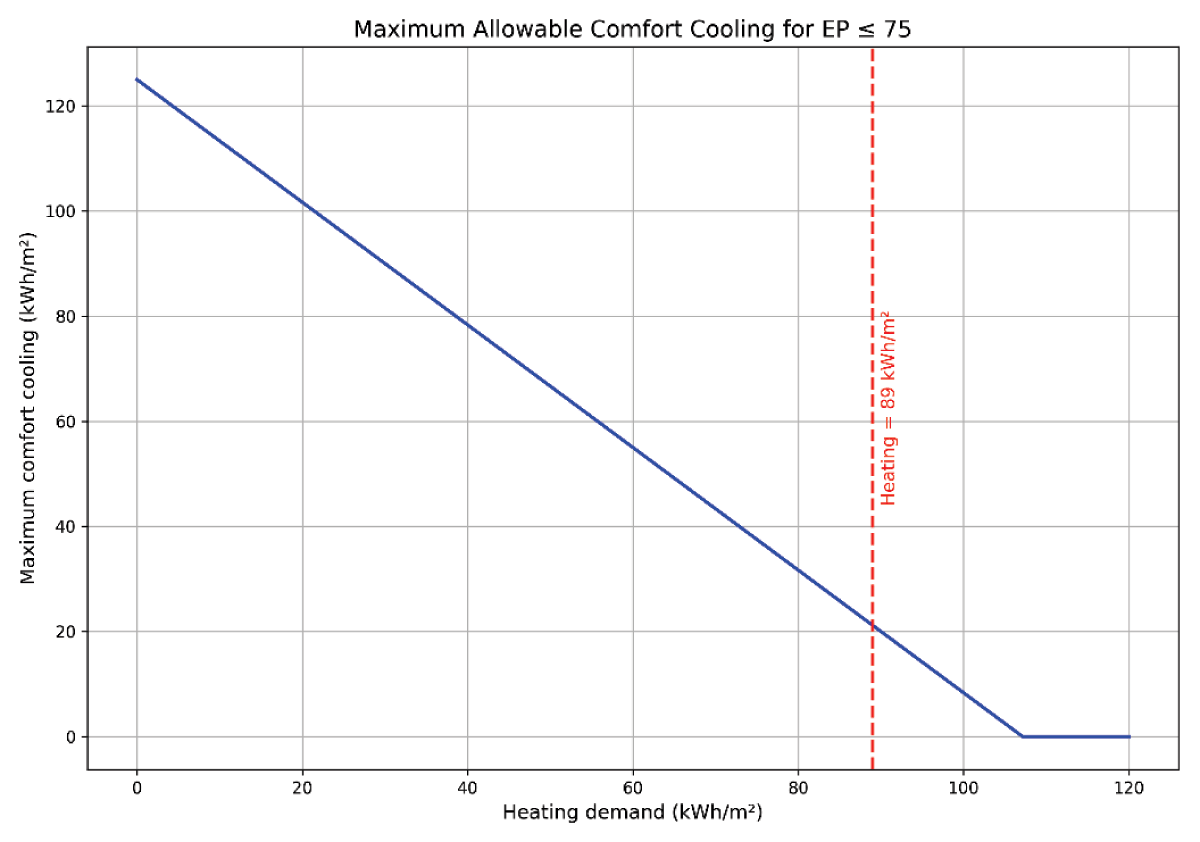
Figure 1
Comparison of heating energy use and allowable comfort-cooling energy in Swedish multi-dwelling buildings. In red, the average use of energy for heating and hot water per square meter in multi-dwelling buildings in Sweden constructed between 2021–2023, in kWh/m2 (Swedish Energy Agency, 2025-10-28). The blue line shows the annual allowance (delivered cooling) in kWh/m² for comfort cooling, calculated using the Swedish Housing and Building Corporation’s formula for primary energy efficiency. This calculation assumes that the energy use for property electricity and domestic hot water is zero.
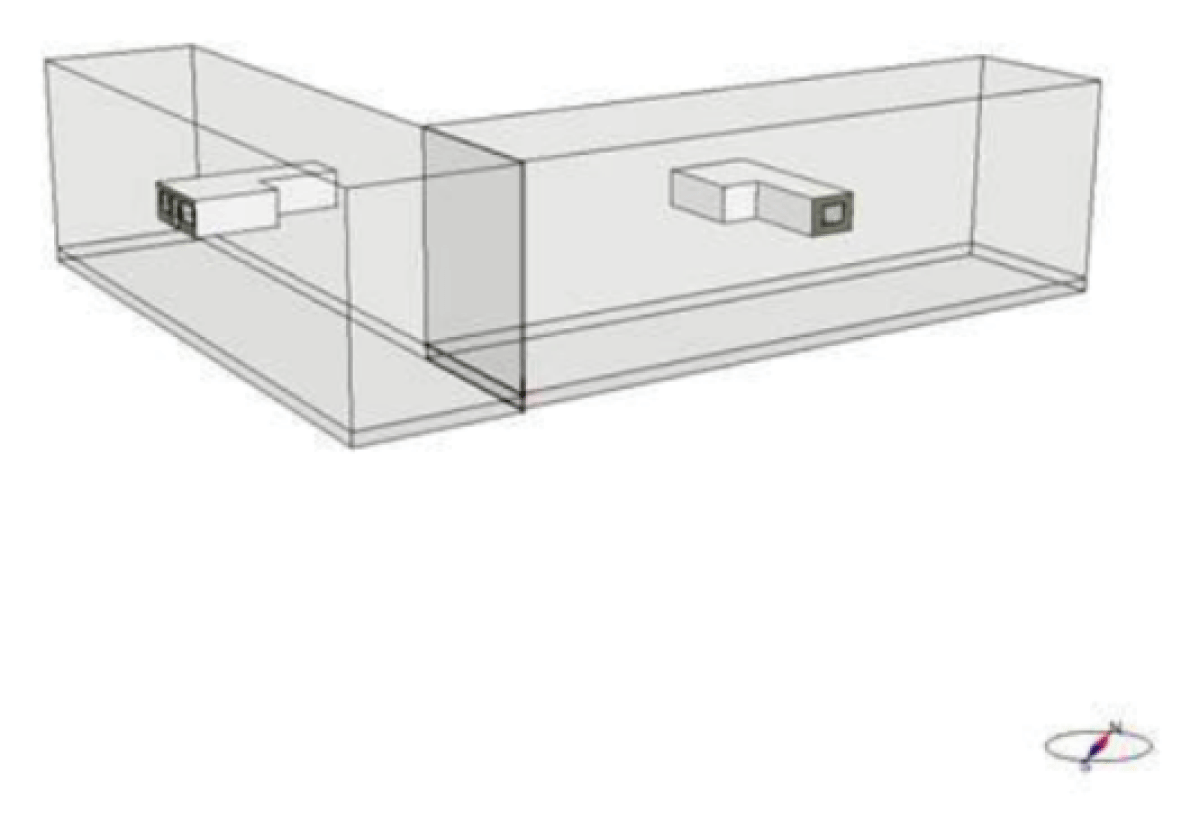
Figure 2
Simplified geometric representation of the two apartments in each facade orientation.
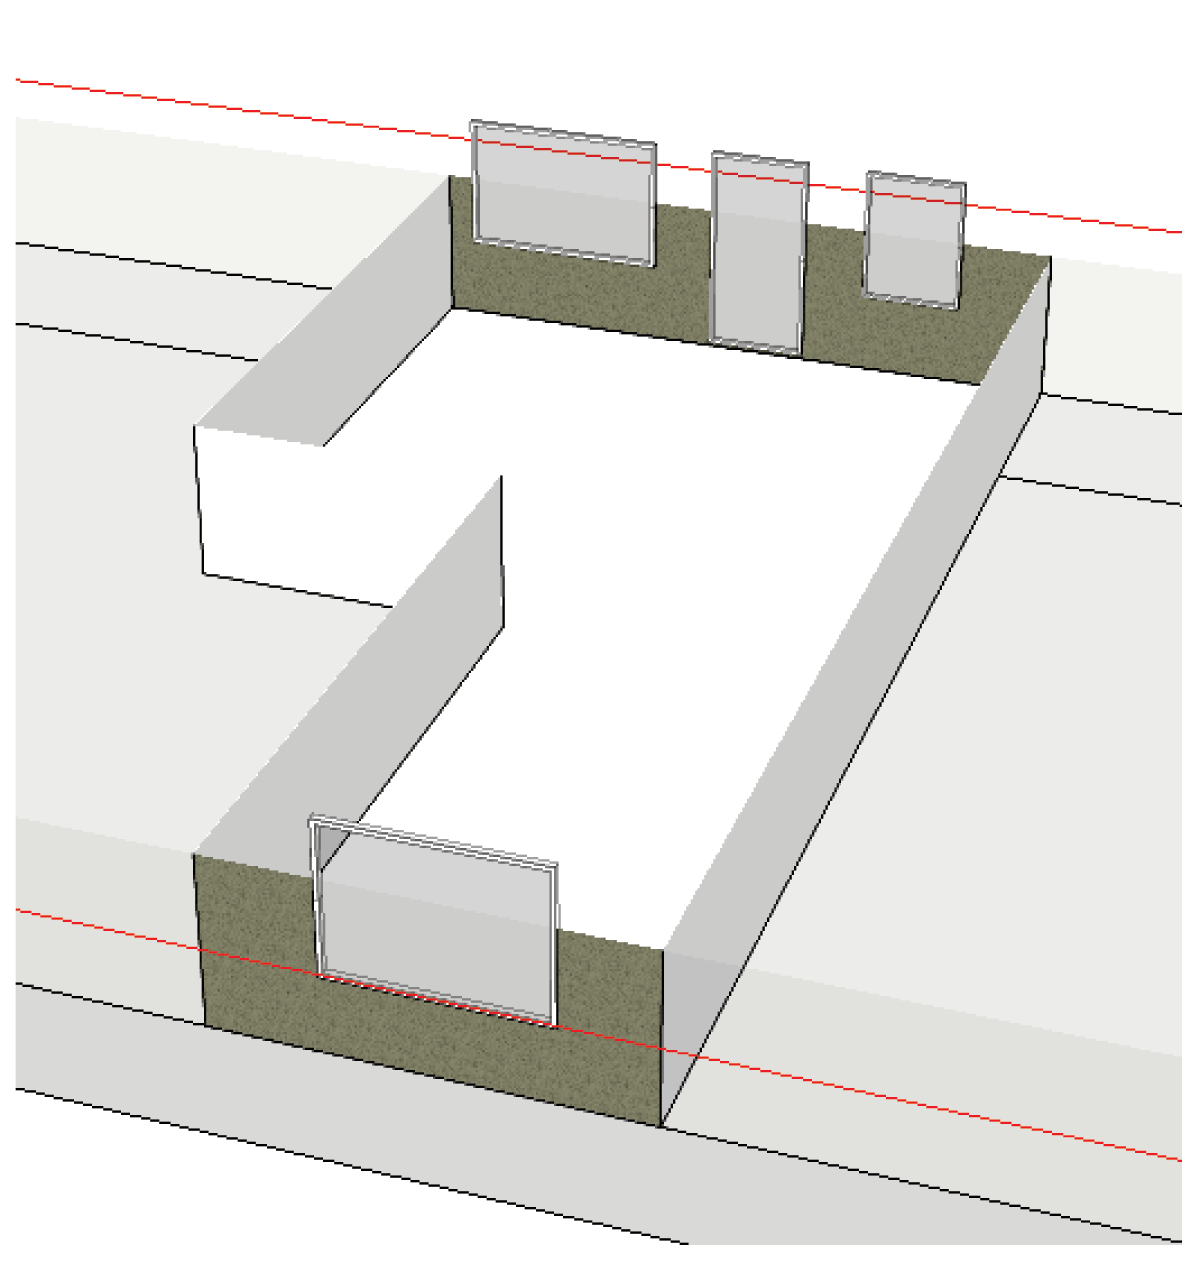
Figure 3
Simplified geometric representation of the representative apartment oriented to cover each facade orientation.
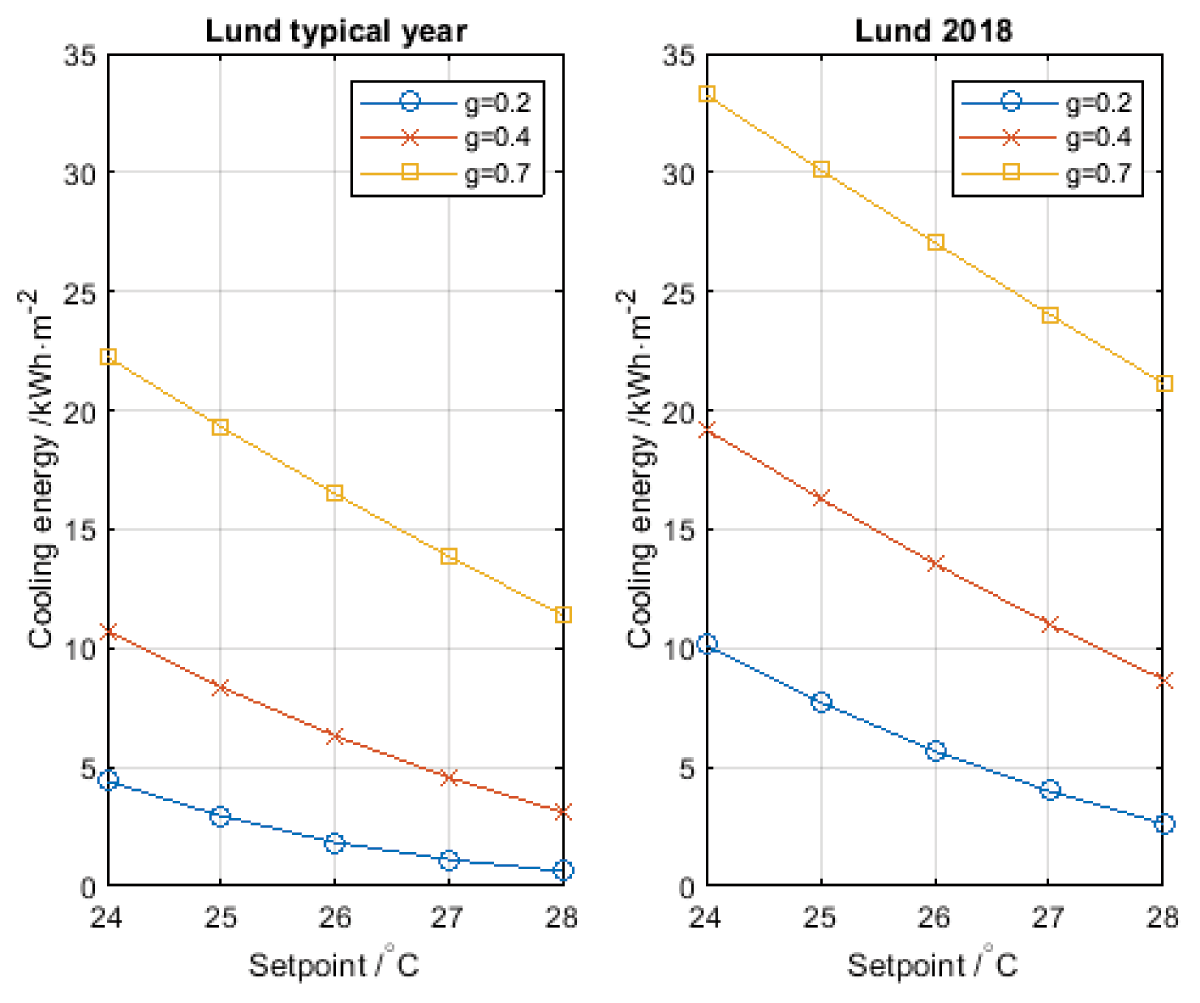
Figure 4
Left panel: normal-year climate. Right panel: summer 2018 climate. Annual cooling energy demand (1 May–30 September) as a function of setpoint temperature and g-value.
Table 1
Input data of the techno-economic analysis, with descriptions.
| PARAMETER | VALUES | DESCRIPTION |
|---|---|---|
| Cooling supply cases | 4 | Four strategies: two district cooling options and two electricity based cooling options. |
| Climate data | 2 | Two climatic conditions: normal year (typical year) and 2018 (warm year). |
| Indoor maximum temperature (setpoints) | 5 | Maximum allowed indoor temperature: 24–28°C, in steps of 1°C. |
| Solar gain (g-value) | 3 | Three g-value: 0.2, 0.4, 0.7. Higher values mean more solar heat admitted into the apartment. |
| Electricity price scenario | Monte Carlo | Hourly electricity prices generated through bootstrap resampling of historical retail electricity prices |
| District cooling prices | 4 | District cooling tariffs starting from €0.09, €0.18, €0.27 and €0.36. Future district-cooling prices were assumed to increase at an expected annual rate of 2%. |
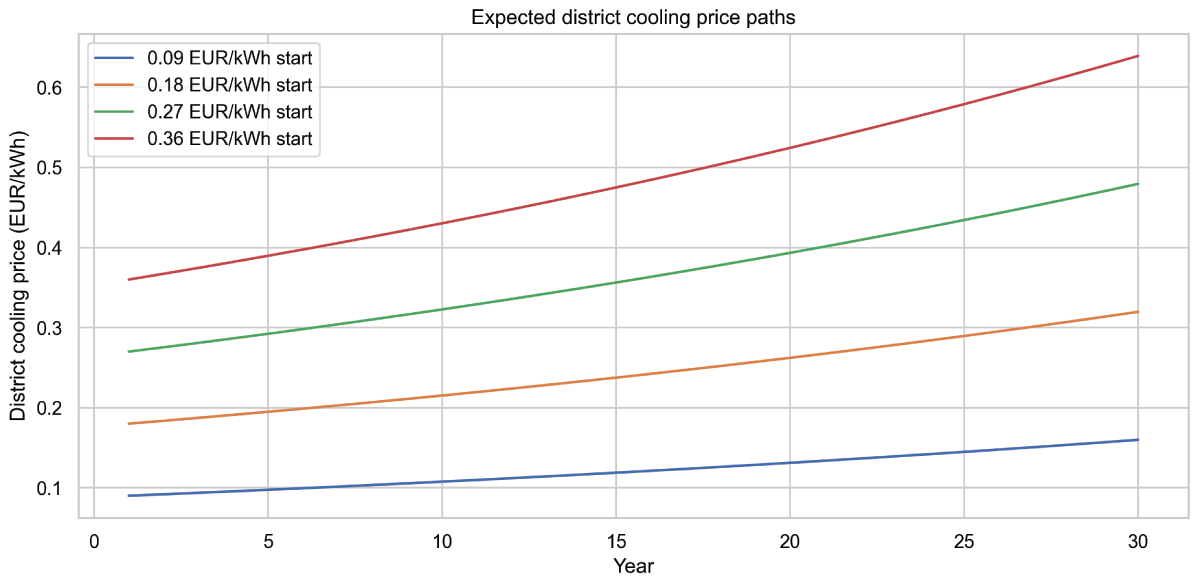
Figure 5
Expected district cooling tariff trajectories used in the economic analysis. The figure shows the expected development of district cooling tariffs over the 30-year assessment period for four assumed starting price levels (€0.09, €0.18, €0.27, and €0.36/kWh), assuming a mean annual escalation rate of 2%.
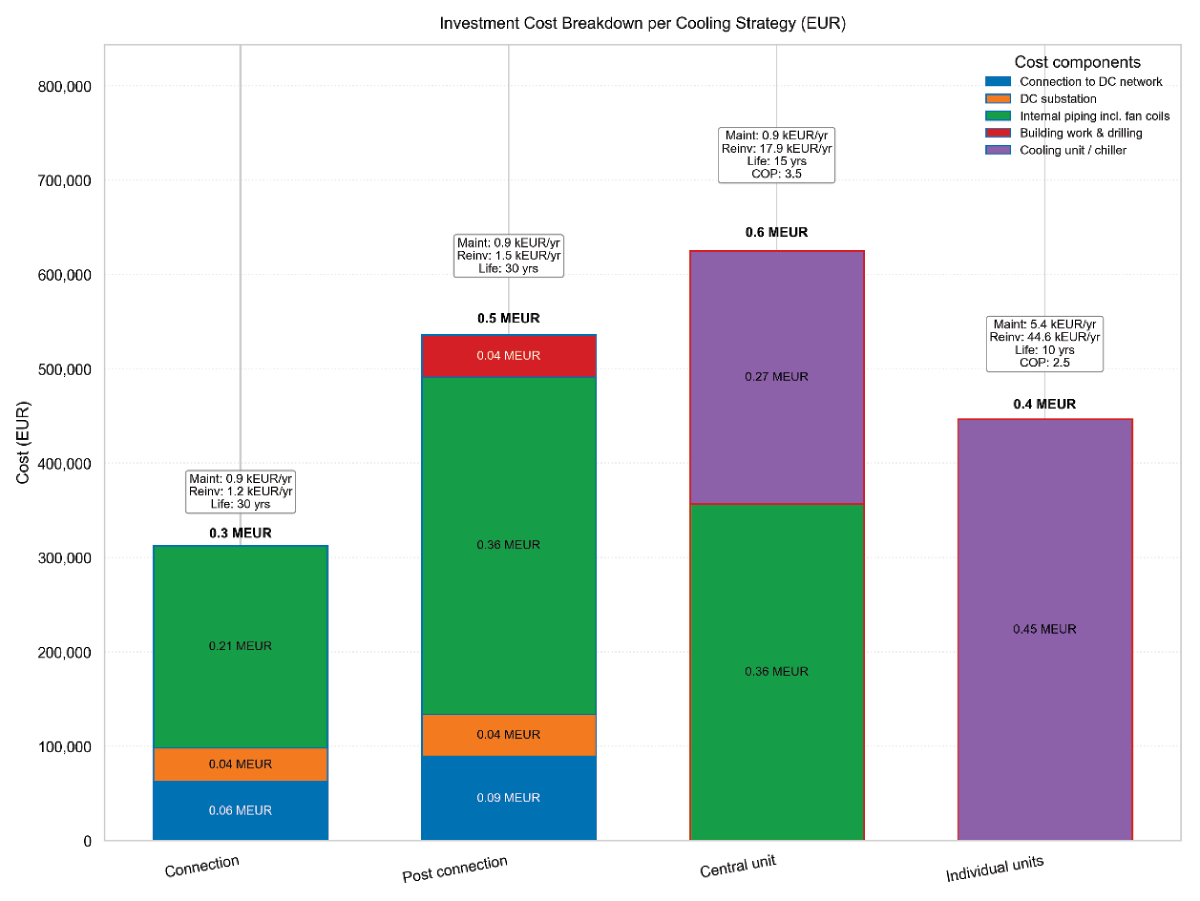
Figure 6
Investment cost breakdown of the cooling strategies.
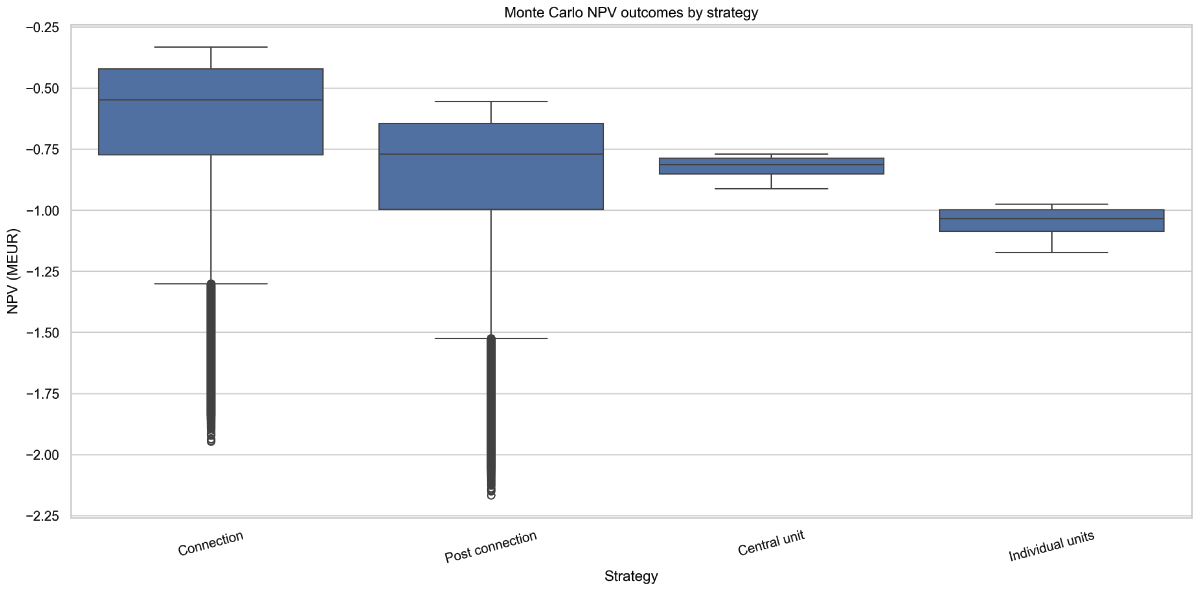
Figure 7
NPV box and whisker of the 1,440 NPV cases. Comparing NPV-values of the full-factorial calculations of different comfort cooling strategies. The two cases to the left are district cooling solutions and the two strategies to the right are electricity solutions.