
Introduction
In 2023, Europe experienced extreme heatwaves of a magnitude not previously observed (World meteorological organization, 2024; European commission, 2023). Heatwaves constitute the most significant climaterelated health risk for the European population (United nations, 2024; European environment agency, 2024; Masselot, 2023). A study published in Nature Medicine estimated that heatrelated mortality in Europe during 2022 reached 61,000 individuals (Ballester et al., 2023). Although heatwaves are less common in Sweden than in southern Europe, the climate is changing, and temperatures perceived as normal in a warmer climate may feel uncomfortable to populations accustomed to colder conditions (European environment agency, 2009; Baniassadi, 2023).
Urban areas face additional risks due to the formation of socalled urban heat islands, where builtup environments become significantly warmer than surrounding rural areas. This effect results from materials such as asphalt and concrete absorbing and retaining heat, combined with limited vegetation that could otherwise provide cooling. The phenomenon is further intensified by human activities such as transport and industrial operations (Gabriel, 2025; MIT climate portal, 2021). In recent years, Sweden has also observed an increase in heatrelated mortality, particularly among elderly individuals and those with chronic illnesses. Climate change is expected to make such extreme events more frequent. According to Swedish meteorological and hydrological institute, extreme heatwaves that previously occurred approximately once every twenty years may, in the future, occur as frequently as every three to five years (Swedish Portal for Climate Change Adaptation) (SMHI – Swedish Meteorological and Hydrological Institute, 2009). This trend poses significant challenges for public health and urban planning.
Stricter requirements for low energy use in residential buildings have led to designs featuring substantially improved insulation of the building envelope. Roofs, walls, floors, and windows are constructed or renovated to achieve very low U-values, thereby reducing heat loss. Highly airtight building structures have become increasingly common, as reducing air leakage is key to achieving energy efficiency (Klimatrådgivningen, 2025; The Swedish National Board of Housing, Building and Planning (Boverket), 2011).
While this development has brought several positive outcomes, such as reduced heating demand, lower operational costs, and decreased climate impact for heating, it has also introduced new challenges. Increased airtightness requires carefully designed and Well-functioning ventilation systems to ensure good indoor air quality and mitigate risks associated with moisture, mold, and elevated CO2 levels (Zahed, 2023; Whole building design guide, 2025).
Moreover, the high levels of insulation cause buildings to retain heat even during warm periods, increasing the risk of indoor overheating. This issue is amplified by contemporary architectural trends favouring large, glazed areas, particularly southfacing facades. Although modern windows have low U-values that reduce heat loss during winter, they allow substantial solar heat gains in summer, leading to elevated indoor temperatures and an increased need for comfort cooling (Chen, 2025; Moreno, 2018).
Addressing these challenges requires a holistic approach to building design in which energy efficiency is balanced with thermal comfort. Passive cooling strategies, such as solar shading, natural ventilation, thermal mass, and green roofs, should be integrated early in the design process to minimize the eventual need for energy-intensive cooling systems (Manshour, 2025; Nagasue et al., 2024).
Due to overtemperatures in the buildings in summer, the demand for comfort cooling in residential buildings is expected to increase, and meeting this demand in a sustainable way is essential. District cooling offers several advantages over local cooling solutions. Unlike local airconditioning units, which release waste heat into the immediate surroundings, district cooling systems can recover and utilize heat generated during the cooling process (Atienza-Marquez, 2019). This heat can be fed back into the district heating network and used, for example, for domestic hot water production, thereby contributing to a circular energy system. From a technical perspective, district cooling systems often achieve high values of the Coefficient of Performance (COP) (Eveloy, 2019). For example, in Jönköping’s district cooling network, up to 10 kWh of cooling can be delivered per 1 kWh of electricity input, which is substantially higher than typical airconditioning systems, which achieve a COP of approximately 2.5–3.0 (Jönköping Energi, 2025).
A key component of the efficiency of district cooling systems is the use of absorption chillers, which convert surplus heat from the district heating network into cooling. This operational strategy enables the utilization of heat from combined heat and power plants even during summer, increasing overall system efficiency and decreasing electricity demand (Fahlén, 2012). Furthermore, free cooling, using naturally cold sources such as deep water or cool outdoor air, is the least energy-intensive method and should be utilized whenever possible (Lucas & Sanjivy, 2024). A good example of this utilization is Göteborg Energi, with their use of free cooling from the Göta River, supplemented with absorption cooling and compressor cooling, resulting in significantly lower energy use and emissions compared with individual cooling systems (Gothenburg Energy, 2025).
In offices and workplaces comfort cooling has been implemented for many decades, but Swedish multifamily houses are very rarely equipped with comfort cooling and very few studies have been conducted on comfort cooling in those buildings. In this study, we conduct a techno-economic analysis to assess how cost-effective different comfort cooling solutions are. The analysis examines how technology choice, cooling demand, and price levels affect the long-term economic performance of each system. The goal is to identify which solution performs best under different conditions, providing a clearer basis for well-informed decisions about future comfort-cooling investments.
The increasing demand for cooling in residential buildings, driven by rising outdoor temperatures, urban heat exposure, and growing expectations for indoor comfort, raises important questions about how Swedish building regulations shape the feasibility of comfort cooling in multi-family dwellings. Current regulatory frameworks influence not only the allowed technical solutions but also how cooling loads affect a building’s overall energy performance, including its primary energy number. Despite the presence of district cooling systems in certain developments, regulatory ambiguity and performance-based requirements may create obstacles that limit the deployment of comfort cooling in buildings intended for permanent living.
This study therefore investigates three interconnected dimensions of the emerging cooling challenge. First, it examines how building regulations govern or constrain the integration of comfort cooling in multi-family housing, and how these rules interact with expected cooling loads. Second, it evaluates the economic performance of different cooling solutions from a life-cycle perspective, accounting for both operational and investment costs. Third, it explores how sector stakeholders across the value chain perceive future cooling needs and the role of comfort cooling in a warming climate. Together, these perspectives aim to clarify whether current regulations align with future thermal comfort requirements and what adjustments may be necessary to support resilient, healthy, cost-efficient and energy-efficient housing.
Cooling demand and overheating in Swedish residential buildings
Swedish buildings have historically been designed with a strong focus on reducing heat losses during winter through highly insulated and airtight envelopes. While beneficial for heating efficiency, these design strategies may also contribute to overheating during warmer summer periods, thereby increasing the need for comfort cooling and development of district cooling solutions (Werner, 2017).
Previous research has shown that district energy systems can provide higher overall efficiency compared to individual heating and cooling solutions. District cooling has been identified as a competitive alternative to conventional electric air-conditioning systems, especially in urban areas with access to large excess heat supplies. Studies have also indicated that the utilization of district cooling during warmer months can increase annual demand in district heating systems by up to 30%, improving the utilization of existing energy infrastructure. However, achieving these benefits requires careful system design, including optimization of chiller capacity, thermal storage, and network configuration, (Lake, 2017).
Alongside developments has demonstrated that climate change is expected to increase overheating risks and cooling demand in Nordic residential buildings, and several studies have examined the thermal performance of Swedish buildings under future climate scenarios. Other studies have evaluated passive cooling measures, district energy systems, and the technical performance of alternative cooling technologies. However, limited attention has been given to how the growing need for comfort cooling interacts with current building-energy regulations, particularly the primary-energy framework used in Sweden and the European Union. Furthermore, few studies have compared the long-term economic performance of district cooling and alternative cooling solutions in Swedish multifamily buildings while simultaneously considering regulatory constraints. Existing research also rarely incorporates the perspectives of housing companies, housing cooperatives, consultants, and industry representatives regarding future cooling needs and implementation barriers. This study addresses these gaps by combining a regulatory analysis, a techno-economic assessment of alternative cooling solutions, and interviews with key stakeholders. In doing so, it provides a more integrated understanding of whether current regulatory frameworks support or hinder the transition towards thermally resilient multifamily housing in a warming climate.
Primary energy regulation in EU and Sweden and its implications for introducing comfort cooling
The European and Swedish regulatory frameworks governing energy use in buildings place a strong emphasis on reducing primary energy consumption and achieving long-term climate neutrality. Two directives form the foundation of this framework: the Energy Efficiency Directive (EDD) and the Energy Performance of Buildings Directive (EPBD), (European Parliament, 2023; European Parliament, 2024). These directives are regularly updated and transposed into national legislation, shaping Sweden’s building regulations and influencing how energy performance is calculated and addressed. The 2024 revision of the EPBD reinforces the EU overall decarbonization strategy by tightening efficiency requirements and mandating the new buildings move towards the Zero-Emission Building (ZEB) standard by 2030, with public buildings adopting the standard by 2028.
At the core of both directives is the concept of primary energy. Energy use for heating, cooling, ventilation, domestic hot water, and fixed electricity is aggregated into a single primary energy indicator, weighted according to each energy carrier’s primary energy factor. These factors are intended to be forward-looking and reflect the evolving energy system, favouring carriers with lower environmental impact. The directives also require comprehensive life-cycle greenhouse-gas assessments, extending beyond construction emissions to include operational emissions throughout a building’s lifetime.
In Sweden, these EU requirements are implemented through Boverket’s Building Regulations (BBR) (The Swedish National Board of Housing, Building and Planning (Boverket), 2011) and the BEN guidelines for “normal use”, (standardized assumptions regarding occupant behaviour, indoor temperature settings, ventilation rates, and operational conditions used to ensure consistent evaluation of building energy performance) (The Swedish National Board of Housing, Building and Planning (Boverket), 2016). Successive revisions of BBR have gradually adjusted primary energy factors to align with the EU’s climate ambitions, lowering the allowable primary energy use for new buildings. As a result, the energy budget available within the performance framework has become increasingly constrained.
Because comfort cooling is included in the primary energy calculation, any additional cooling energy directly reduces the available margin for compliance. In buildings with very low heat demand, common in modern construction, the allowable primary energy use is often already close to the regulatory limit. Integrating comfort cooling therefore risks exceeding the permitted primary energy threshold unless offset by further efficiency gains or onsite renewable production (The Swedish National Board of Housing, Building and Planning (Boverket), 2011).
Therefore, the EU’s regulatory focusing on primary energy reduction and the move toward zero-emission buildings, significantly limit the flexibility to add comfort cooling in new or renovated multifamily buildings. The strict weighting of energy carriers and tight energy performance caps make it challenging to introduce active cooling without pushing the total primary energy use beyond regulatory requirements.
To assess the feasibility and marginal conditions for introducing comfort cooling in Swedish multi-family buildings, we carried out an analysis that combines regulatory constraints with current empirical data on building energy performance. Specifically, we examined how much cooling energy can be supplied without exceeding the maximum allowed primary energy demand for newly constructed multi-family buildings.
Figure 1 illustrates the upper limit for comfort cooling, calculated using the maximum permitted primary energy efficiency of <75, which defines the regulatory threshold for new multifamily buildings in Sweden. In this assessment, we assume that all comfort cooling is provided by district cooling, and we apply its corresponding primary energy factors.
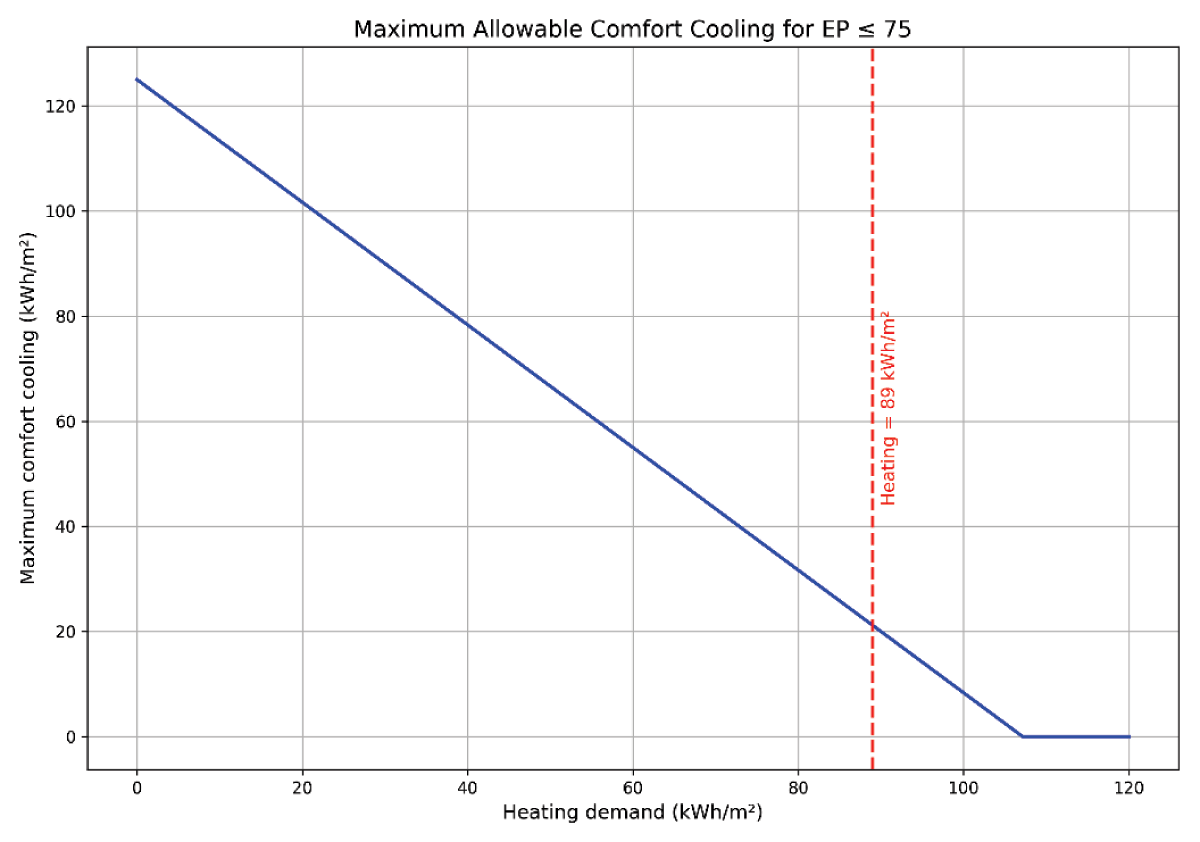
Figure 1
Comparison of heating energy use and allowable comfort-cooling energy in Swedish multi-dwelling buildings. In red, the average use of energy for heating and hot water per square meter in multi-dwelling buildings in Sweden constructed between 2021–2023, in kWh/m2 (Swedish Energy Agency, 2025-10-28). The blue line shows the annual allowance (delivered cooling) in kWh/m² for comfort cooling, calculated using the Swedish Housing and Building Corporation’s formula for primary energy efficiency. This calculation assumes that the energy use for property electricity and domestic hot water is zero.
To contextualize the regulatory limit, we compare it with the actual average delivered energy for space heating and domestic hot water in Swedish multifamily buildings constructed between 2021 and 2023; this reference value is shown as a red line. The cooling loads investigated in the study range from about 0 to 33 kWh/m². For clarity and to isolate the effect of cooling, electricity uses for building services and delivered energy for domestic hot water are set to zero in the scenarios.
The analysis shows that, under current regulations and with district cooling as the assumed cooling technology, a substantial reduction in spaceheating demand would be required for multifamily buildings to integrate comfort cooling without surpassing the allowed primary energy limit. In other words, today’s typical energy performance levels leave little margin for adding cooling, highlighting the need for either further efficiency improvements or revised regulatory conditions if district cooling is to be implemented broadly for comfort purposes in this building segment.
Techno-economic cost analysis for comfort cooling in multi-family residential buildings
This section presents a comprehensive technoeconomic evaluation of four cooling strategies for a representative 100-apartment multifamily building:
Connection, where the building is linked to the district cooling network during construction;
Post connection, where district cooling is installed after the building has been completed, resulting in higher investment costs;
Central unit, involving installation of a central electric chiller; and
Individual units, where each apartment is equipped with its own electric cooling unit.
Using high resolution modelled hourly cooling loads and a simulated Monte Carlo approach based on historical retail electricity prices electricity price scenarios derived by scaling historical spot price time series, we compute 30-year NPVs for all combinations of cooling strategy, load profile, and district cooling tariff level. The analysis covers both typical climatic conditions and the extreme warm year conditions observed in 2018, enabling a climate sensitive assessment of long-term economic performance.
The contributions are a time-resolved life-cycle cost comparison of cooling strategies for Swedish multifamily buildings. A quantification is made of how economic performance varies with indoor temperature thresholds, solar gain, climatic year, and tariff levels of electricity and district cooling, as well as an identification of the conditions under which district cooling or electric cooling technologies are economically preferable.
Cooling Simulations
To assess the cooling demand of a multifamily building in a simplified yet representative way, and to explore how selected parameters influence the outcomes, a series of modelling simplifications were introduced.
The simulated multi-family building consisted of 100 apartments of varying sizes and layouts arranged in a shaped configuration. For modelling purposes, two representative 60 m², through-plan apartments were created- one for each façade orientation corresponding to the two building wings (See Figures 2 and 3). These apartments were then assumed to represent the aggregate cooling demand of the entire building when the results were subsequently scaled up. Since the primary interest lies in cooling requirements, only the period 1 May to 30 September was simulated. This interval was assumed to be representative of the building’s annual cooling demand.
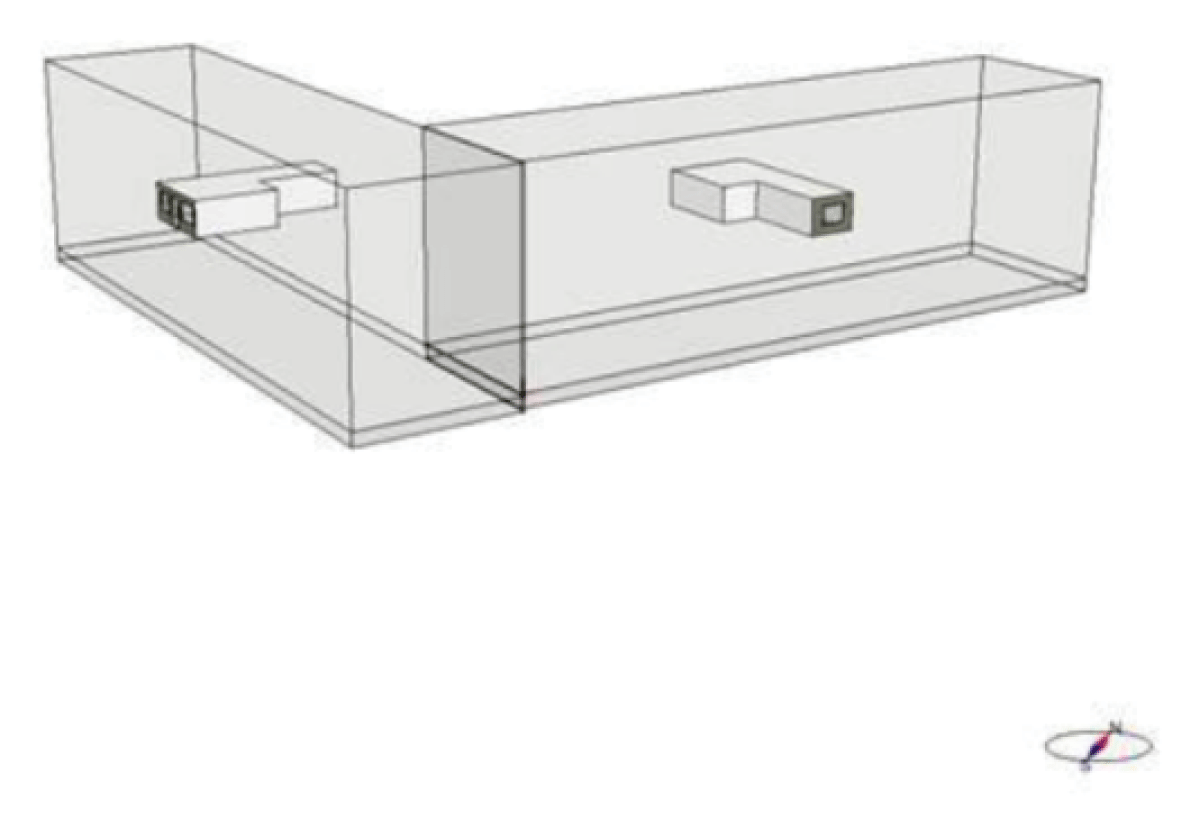
Figure 2
Simplified geometric representation of the two apartments in each facade orientation.
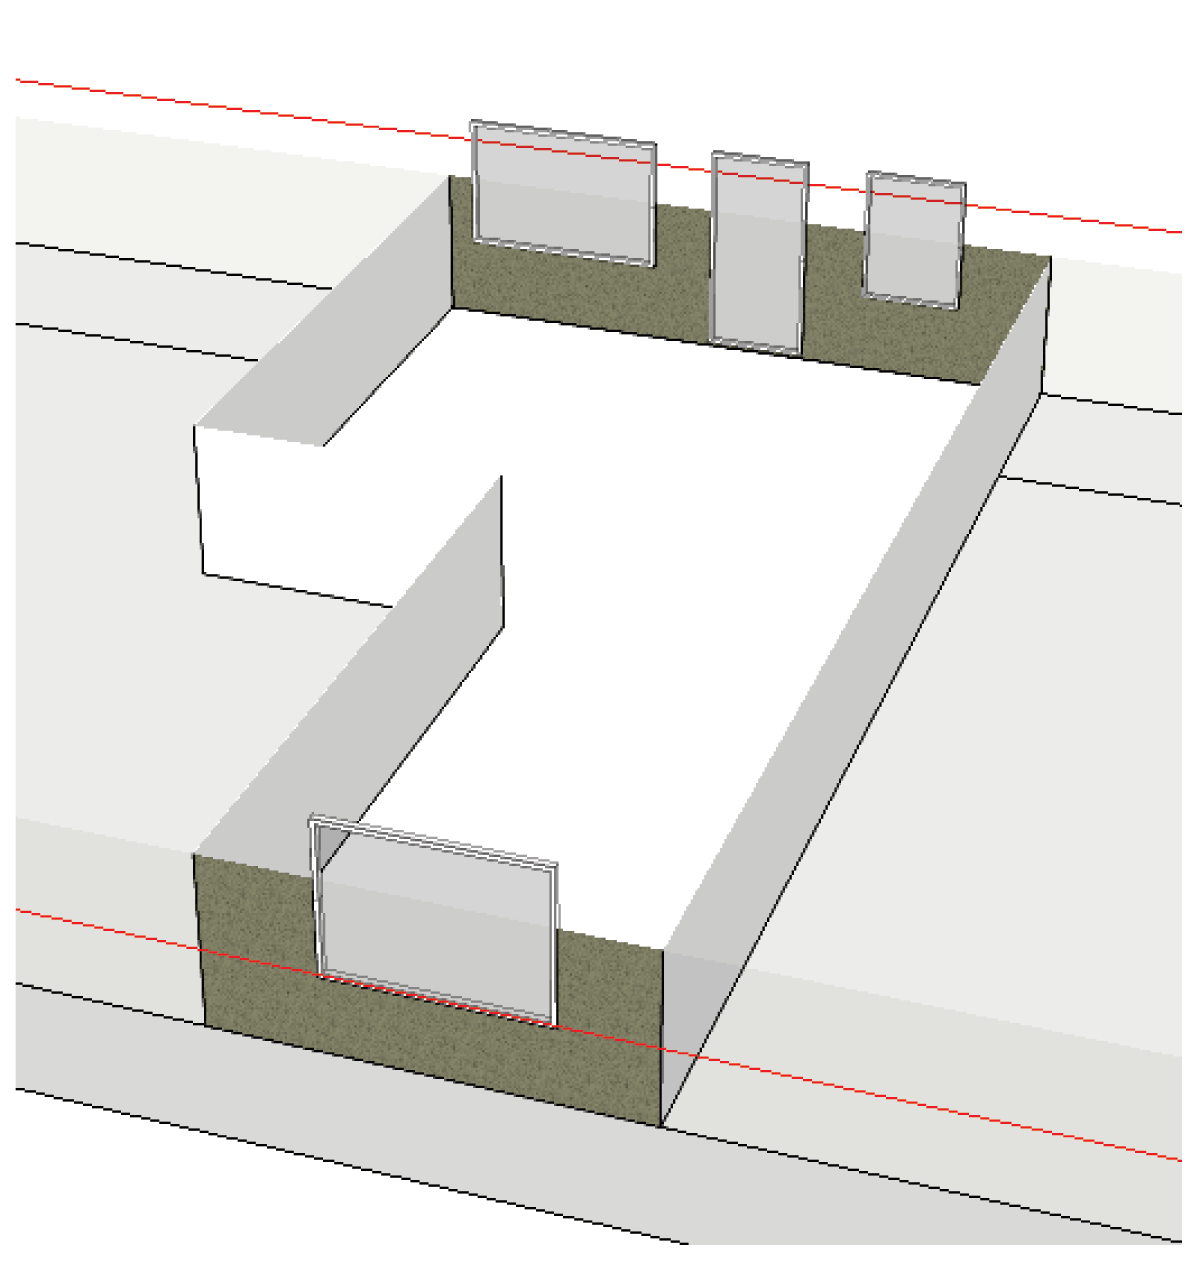
Figure 3
Simplified geometric representation of the representative apartment oriented to cover each facade orientation.
The multi-family residential building forming the basis of this investigation consists of two building bodies with façades oriented toward two different cardinal directions (southeast–northwest and southwest–northeast). The building comprises approximately 100 apartments of varying sizes. In this study, the building’s cooling demand is extrapolated from simulation results obtained for the representative apartment layout positioned in two different orientations.
The simulations are performed using the validated (EQUA, 2010; EQUA, 2010) dynamic building performance simulation software IDA ICE (EQUA, 2025), which captures both building physics and building services. The aim of this simplified methodological approach is to establish a basis for estimating potential cooling loads associated with selected indoor temperature setpoints and to assess how these loads differ between a typical meteorological year and a warmer climatic year.
Passive cooling strategies in the form of solar shading are also evaluated through varying levels of solar heat gain coefficient (g-value). These variations represent both the passive shading properties of the building envelope and occupant-operated solar shading measures. Internal heat gains generated by occupants are maintained as a constant load throughout the analysis (Jakubcionis, 2017).
Cooling demand in a building is primary influenced by two categories of factors: internal heat gains and target indoor temperature levels (cooling setpoints). Internal heat gains were modelled in accordance with BEN2 assumptions for a two-room apartment: 1.63 occupants, present between 17:00–07:00, and household electricity amounting to 70% of 30 kWh/(m²·year). Consequently, as all other factors are the same, in the simulation, the variations in internal heat gains arise only from external factors, namely outdoor climate, and solar heat gains through windows (g-values). Two outdoor climate data sets were used: normal-year climate (Sveby) and the exceptionally warm summer of 2018 (SMHI/Sveby). Window solar-energy transmittance (g-values) varied across three levels: 0.2, 0.4, 0.7. These correspond in practice to different glazing technologies or architectural features such as balconies providing shading. Cooling setpoints were varied across five temperature levels: 24°C, 25°C, 26°C, 27°C and 28°C. All parameter combinations were tested in a systematic manner, resulting in 30 annual simulations, each yielding hourly cooling power demand profiles represented in Figure 4, energy demand numbers that are deemed to correspond well regarding national average cooling loads in Sweden and Europe, (Werner, 2017; Zhang, 2023; Gelesz, 2025). The hourly values are used in subsequent cost analyses.
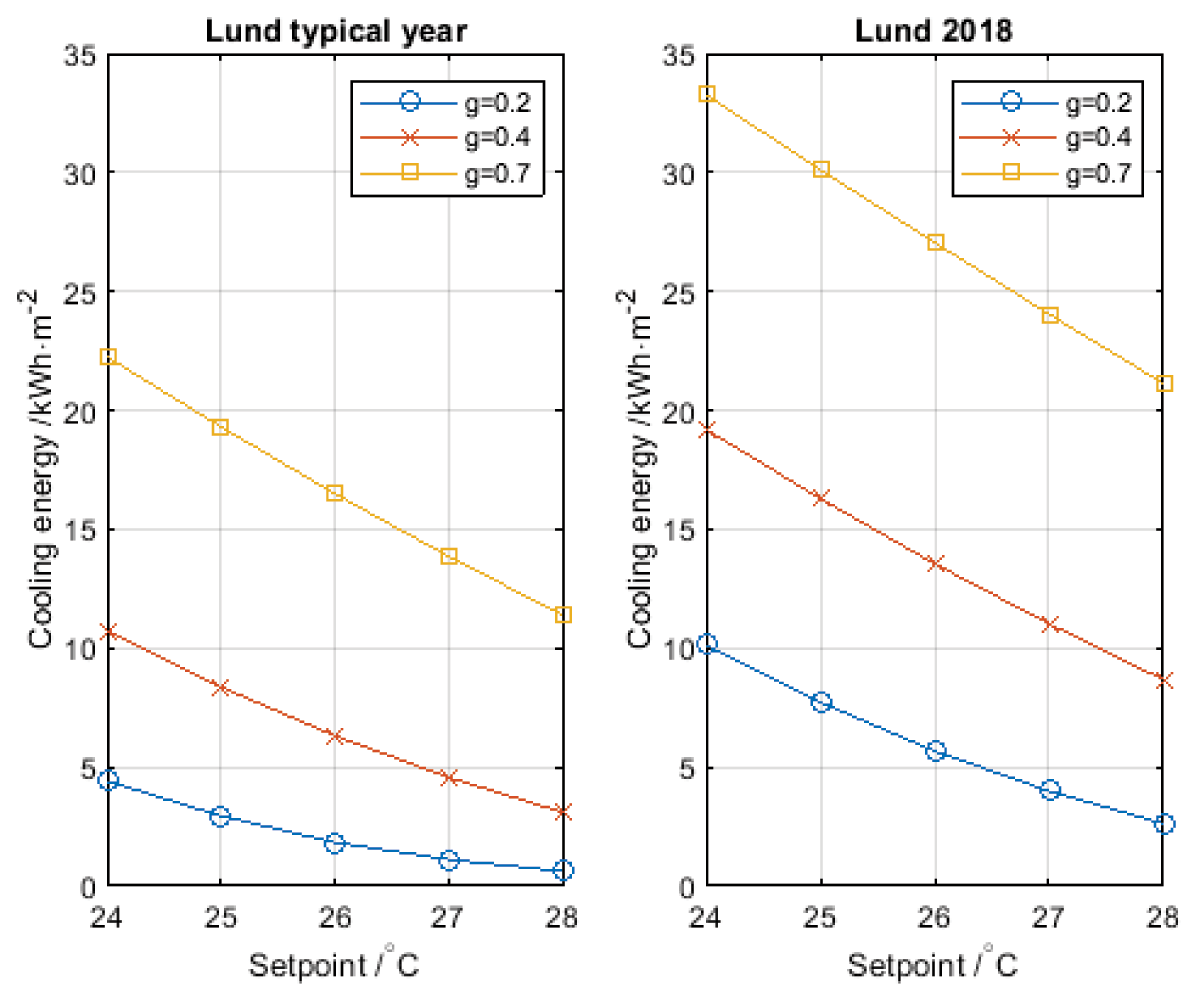
Figure 4
Left panel: normal-year climate. Right panel: summer 2018 climate. Annual cooling energy demand (1 May–30 September) as a function of setpoint temperature and g-value.
For the techno-economic analysis, hourly mean values for each parameter combination were used as input. To provide an overview, the results are presented as annual cooling energy demand per m² for all simulations, see Figure 4.
In Figure 4 annual average cooling energy is plotted as a function of cooling setpoint temperature, with separate curves for each g-value. The results clearly show that both climate conditions and window properties significantly influence cooling demand. For example: windows with g = 0.4 under the 2018 climate yield cooling needs similar to windows with g = 0.7 under a typical year. This illustrates that extreme summers can have an impact on par with poor window performance, highlighting the importance of climate-adapted design.
NPV-analysis
A Monte Carlo-based net present value framework was applied to evaluate the life-cycle costs of the cooling alternatives over a 30-year assessment period. Hourly cooling loads were combined with simulated electricity-price scenarios and district-cooling tariff developments to estimate annual cash flows, which were then discounted to present value. Input parameters can be seen in Table 1.
Table 1
Input data of the techno-economic analysis, with descriptions.
| PARAMETER | VALUES | DESCRIPTION |
|---|---|---|
| Cooling supply cases | 4 | Four strategies: two district cooling options and two electricity based cooling options. |
| Climate data | 2 | Two climatic conditions: normal year (typical year) and 2018 (warm year). |
| Indoor maximum temperature (setpoints) | 5 | Maximum allowed indoor temperature: 24–28°C, in steps of 1°C. |
| Solar gain (g-value) | 3 | Three g-value: 0.2, 0.4, 0.7. Higher values mean more solar heat admitted into the apartment. |
| Electricity price scenario | Monte Carlo | Hourly electricity prices generated through bootstrap resampling of historical retail electricity prices |
| District cooling prices | 4 | District cooling tariffs starting from €0.09, €0.18, €0.27 and €0.36. Future district-cooling prices were assumed to increase at an expected annual rate of 2%. |
Inputs and preprocessing
Hourly cooling demand time series were taken from the modelled data. Each datapoint corresponds to a distinct load profile encoding an indoor temperature constraint index, climatic year (normal year or 2018), and a solar-gain parameter (g-value typically 0.2/0.4/0.7).
Electricity price modelling
The electricity price was modelled using historical hourly spot market prices combined with fixed end-user price components. Hourly day-ahead electricity prices were obtained from Nord Pool market data for the period 2024–2025 and expressed in EUR/MWh. To represent the total electricity cost faced by the end user, the spot price was supplemented with retail mark-up, network tariffs, taxes, and value-added tax (VAT). The resulting customer electricity price, Pel, was calculated as:
where Pspot is the hourly day-ahead market price (EUR/MWh), Pretail is the retailer mark-up (6 EUR/MWh), Pnetwork is the network tariff (28 EUR/MWh), and (Ptax represents taxes and additional fees (36 EUR/MWh). A VAT factor of 1.25 was applied, and the resulting values were converted to EUR/kWh.
To account for uncertainty and long-term market variability, electricity prices were simulated using a Monte Carlo approach. For each simulation year, hourly electricity prices were randomly sampled with replacement from the historical hourly electricity price distribution. This bootstrap sampling method preserves the empirical variability and volatility of observed electricity prices without assuming a predefined probability distribution.
The simulated electricity prices were used to estimate annual operating costs for electrically driven cooling systems. Electricity demand was determined by dividing the hourly cooling load by the coefficient of performance (COP) of each system:
where Eel, h is the hourly electricity demand and Qcool, h is the hourly cooling load.
For each electricity using strategy, 10,000 Monte Carlo simulations were performed over a 30-year analysis horizon using a discount rate of 5%. Annual electricity costs were discounted to present value and included together with maintenance costs, investment costs, and reinvestments in the net present value (NPV) calculation.
Unlike electricity prices, district cooling prices were assumed deterministic and modelled using fixed starting price levels with an annual escalation rate of 2% (See Figure 5). District cooling was evaluated using four starting tariff levels: €0.09, €0.18, €0.27, and €0.36 per kWh. Among these, the tariff of €0.18 per kWh is considered the scenario that most accurately reflects prevailing retail district-cooling prices in Sweden, including energy charges, network costs, and applicable taxes. The remaining tariff levels were included as sensitivity cases to assess the economic robustness of the cooling alternatives under both favourable and less favourable market conditions.
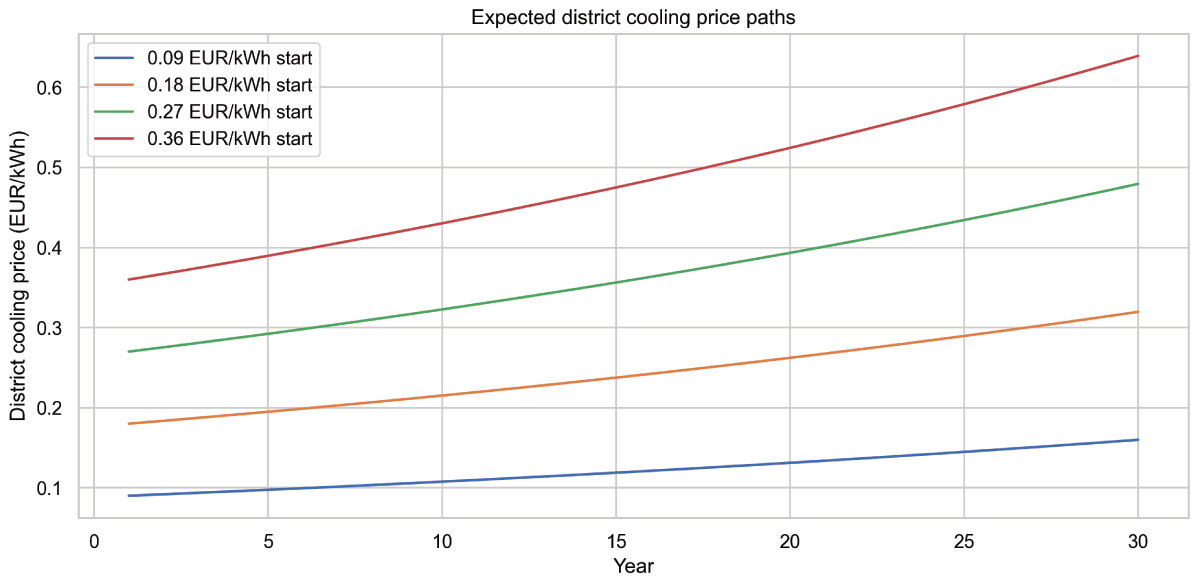
Figure 5
Expected district cooling tariff trajectories used in the economic analysis. The figure shows the expected development of district cooling tariffs over the 30-year assessment period for four assumed starting price levels (€0.09, €0.18, €0.27, and €0.36/kWh), assuming a mean annual escalation rate of 2%.
A mean annual district cooling tariff escalation rate of 2% was assumed, corresponding approximately to the long-term inflation target used in Swedish and European monetary policy.
Cooling solutions
Four cooling strategies were assessed: Connection (district cooling connection during the construction phase), Post connection (district cooling installed after the building has been completed, resulting in higher CAPEX), Central unit (a central electric chiller with COP = 3.5), and Individual units (individual electric chillers with COP = 2.5).
The cost calculations for each strategy included parameters for upfront CAPEX, annual maintenance, reinvestment cost, and lifetime which can be seen in Figure 6. These values were developed in collaboration with an energy utility, a coolingsystems contractor, and through a supporting literature review in which the figures were compared and validated. All values were tailored specifically to the characteristics of the simulated building.
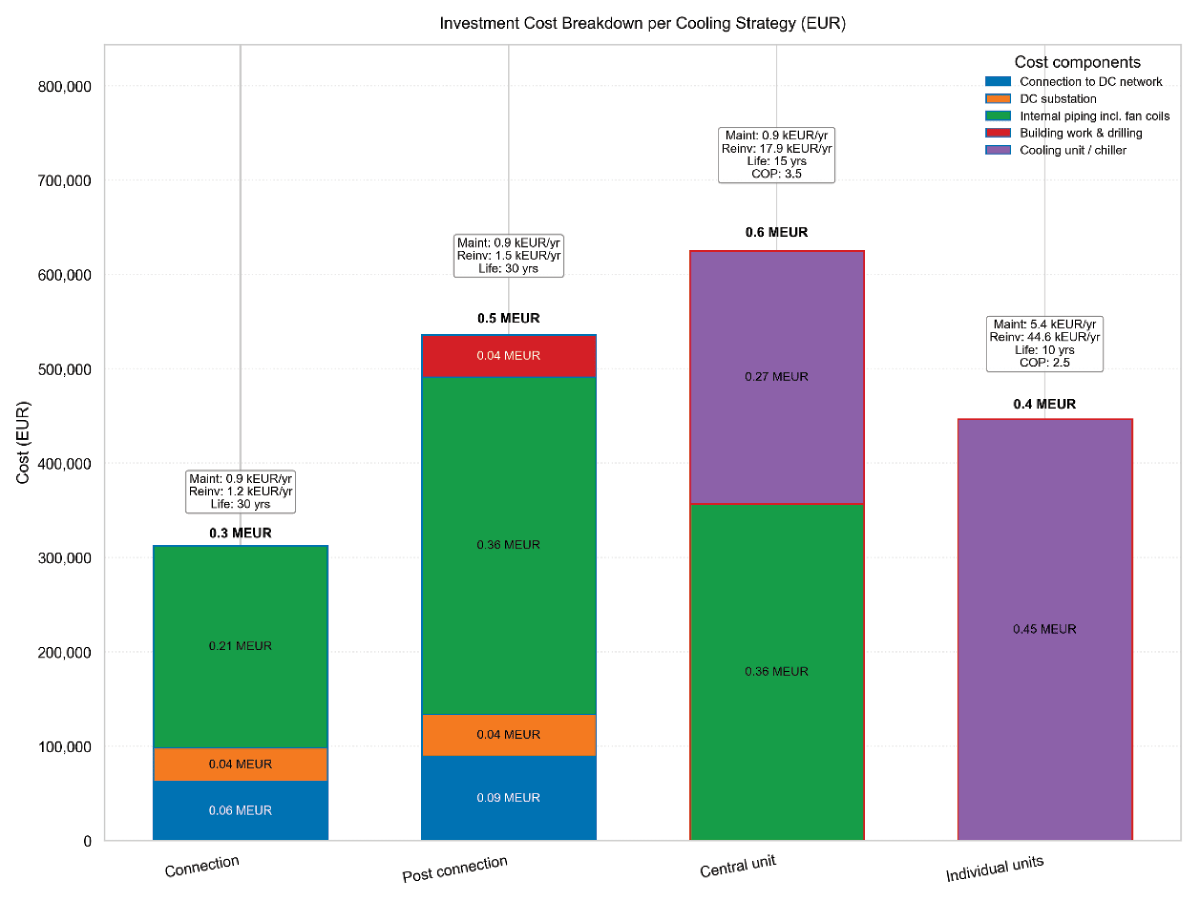
Figure 6
Investment cost breakdown of the cooling strategies.
Connection to the DC network is somewhat cheaper in the Connection case as drilling can be avoided compared with the alternative Post connection. The district cooling substation is also slightly less expensive, since the Post connection option requires the substation to be placed in a space not originally intended for this use purpose. The same applies to the internal piping since this work can be carried out during the construction process in the Connection case rather than in retrospect.
The cost for internal piping is the same for Central unit and Post connection as they require the same installation and configuration work.
For each combination of load profile, electricity scenario, district cooling tariff, and cooling strategy, hourly energy costs are computed and aggregated to annual totals. District cooling costs are proportional to delivered cooling energy, while electric options result in electricity costs proportional to cooling energy divided by COP.
NPV was computed as the negative present value of all costs: initial CAPEX, discounted OPEX, and discounted reinvestments occurring at multiples of lifetime prior to year 30. A real discount rate of 5% is used.
Formulas Used in the NPV Model
The cost for energy depends on the cooling strategy type:
Reinvestment Present Value (PV)
Some components have lifetimes shorter than the 30 year analysis horizon, as an example the calculated technical lifespan of “individual units” is ten years. Reinvestment occurs every L years, so each reinvestment must be discounted to present value.
Total Net Present Value
NPV is computed as:
The minus sign indicates that lower cost yields a higher (less negative) NPV and therefore a better strategy. A full-factorial enumeration is executed as seen in Table 1.
Exploratory Stakeholder Consultation
To capture diverse perspectives on current and future cooling needs in Swedish multi-family buildings, an exploratory stakeholder consultation was conducted with seven respondents representing different positions in the housing and cooling sectors. The sample included energy specialists from two municipal housing companies, board members from two large housing cooperatives, a representative from the Swedish Cooling and Heat Pump Association, a consultant/contractor working with cooling installations, and the head of energy and operations in a housing organization, who advises affiliated cooperatives. The selection was made with a local focus, as the study was carried out in collaboration with the local energy utility in Lund, ensuring relevance to local building stock, climate conditions, and energy-system characteristics.
Data collection
All interviews were conducted digitally via Microsoft Teams. Each interview lasted approximately one hour. With consent, the sessions were recorded and automatically transcribed using Teams’ built-in transcription tool. The transcripts were subsequently reviewed manually to correct errors, clarify unclear passages, and produce concise summaries of each interview.
Analytical approach
The analysis followed a thematic approach. First, all transcripts and summaries were read several times to gain an overall understanding of the material. Codes were then assigned to segments of text that reflected recurring issues, viewpoints, or experiences – for example: perceived cooling needs, barriers to installation, regulatory constraints, technology choices, energy performance considerations, or market demand. Related codes were grouped into broader themes that captured patterns across respondents. These themes formed the basis for a cross-case comparison, highlighting both convergent and divergent perspectives between actor groups (e.g., public housing, cooperatives, consultants, industry representatives). The thematic structure was then used to synthesize results and identify overarching insights relevant to the research questions.
Results
Techno-economic analysis
Figure 7 presents the distribution of net present value (NPV) outcomes obtained from the Monte Carlo simulations for the four cooling strategies. The results show a clear ranking of the alternatives, with district cooling solutions generally outperforming the electricity-based options.
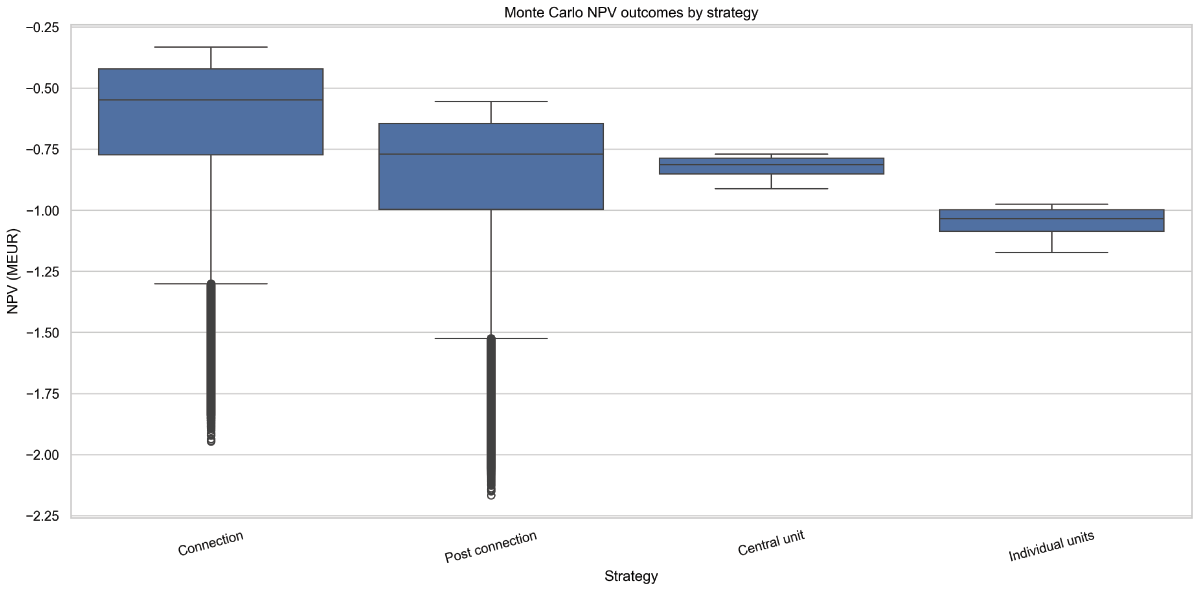
Figure 7
NPV box and whisker of the 1,440 NPV cases. Comparing NPV-values of the full-factorial calculations of different comfort cooling strategies. The two cases to the left are district cooling solutions and the two strategies to the right are electricity solutions.
The most favourable strategy is Connection, with a mean NPV of –0.642 MEUR and a median NPV of –0.547 MEUR. The 5th and 95th percentiles range from –1.266 MEUR to –0.351 MEUR, illustrating the uncertainty associated with future energy price developments. Post connection is the second-best district cooling alternative, with a mean NPV of –0.865 MEUR and a median NPV of –0.770 MEUR. The lower performance compared with Connection is primarily explained by the higher investment costs associated with connecting the building to district cooling after construction.
Among the electricity-based alternatives, central unit performs better than individual units, with a mean NPV of –0.819 MEUR compared with –1.044 MEUR. The relatively narrow uncertainty range for Central unit (P5: –0.897 MEUR, P95: –0.772 MEUR) indicates that its economic performance is less sensitive to variations in future electricity prices than the district-cooling alternatives are to variations in cooling demand and tariff assumptions.
The individual units alternative exhibit the lowest economic performance of all strategies. Its poor results are primarily driven by lower energy efficiency (COP = 2.5), higher maintenance costs, and more frequent reinvestment requirements. The substantial difference between Individual units and the other alternatives indicates that decentralized cooling systems are structurally disadvantaged from a life-cycle cost perspective under the assumptions considered in this study.
Overall, the ranking of the alternatives remains consistent across the Monte Carlo simulations. Early connection to district cooling provides the most favourable economic outcome, while decentralized individual cooling units remain the least attractive option. These results suggest that the timing of district-cooling integration is a critical factor for long-term economic performance and that district-cooling solutions can offer a competitive and robust alternative to conventional electricity-based cooling systems in Swedish multifamily buildings.
Results from the Exploratory Stakeholder Consultation
The interviews reveal a clear consensus among actors across the housing and cooling sectors that the need for cooling in Swedish multi-family buildings will increase substantially in the coming years. Large public housing companies as well as technical consultants already observe rising temperatures indoors, especially in new buildings with large window areas, and note that overheating is no longer an exception but a recurring challenge. As a result, cooling is increasingly viewed not as a luxury but as an emerging necessity for ensuring thermal comfort and safeguarding health during heatwaves.
Despite this rising need, active cooling solutions remain uncommon in Swedish residential buildings. According to respondents, this is not due to technical limitations but primarily due to regulatory, economic, and institutional barriers. Current energy performance requirements, high primary energy factors for electricity, concerns about peak loads, and the lack of clear incentives for developers all work against the integration of cooling systems. In existing buildings, technical constraints linked to ventilation systems, especially self-draught solutions, further limit feasible retrofit options.
Among the most important findings is the central role attributed to solar photovoltaics. Several respondents highlight that cooling and compliance with energy performance regulations can only be reconciled if cooling is paired with onsite solar power production. Solar electricity aligns well with cooling demand profiles and can offset the increase in purchased energy, making it possible to meet energy thresholds for green loans and other sustainability-driven financing models. In this sense, “solar-integrated cooling” stands out as the key enabling strategy for future-proofed residential buildings.
Finally, respondents report a growing willingness among residents and housing cooperatives to pay for improved thermal comfort, particularly following hot summers. While still emerging, cooling is increasingly seen as a value-adding feature in the housing market and may become standard in new developments within a decade. Overall, the interviews point to a sector in transition: the need for cooling is rising rapidly, existing structures create friction, but technological and financial pathways, especially through the coupling of cooling and solar power, are beginning to open viable routes forward.
Limitations
The study is subject to several methodological and contextual limitations. The cooling-demand simulations are based on representative apartments and selected variations in climate year, solar heat-gain coefficient, and indoor temperature setpoint. This approach enables a systematic comparison of cooling loads and economic outcomes, but it does not capture the full variability of apartment layouts, occupant behaviour, window operation, shading use, or ventilation practices across an entire multifamily building. Empirical validation against measured cooling loads in Swedish multifamily buildings is also limited, since active comfort cooling remains uncommon in this building segment.
The techno-economic analysis focuses on life-cycle costs and net present value over a 30-year assessment period. Although the Monte Carlo framework accounts for uncertainty in electricity prices, district-cooling tariff development, tariff escalation, and long-term operating costs, several input parameters remain scenario-based. Investment costs, maintenance costs, system lifetimes, and coefficients of performance are treated as fixed assumptions within each cooling strategy. This simplifies comparison between alternatives and improves interpretability, but it also limits the ability to capture project-specific cost variation, future technological development, and changing market conditions.
The analysis does not monetize non-cost factors that may influence the practical feasibility or desirability of different cooling solutions. These include indoor comfort beyond the selected temperature thresholds, noise, space requirements, architectural constraints, user acceptance, maintenance responsibilities, grid impacts, and implementation complexity. Such factors may be important in real investment decisions, particularly when comparing centralized, district-based, and apartment-level cooling solutions.
The results are geographically constrained to the Swedish context and, more specifically, to the climatic, regulatory, energy-price, and district-cooling conditions represented by the Lund case study. The findings should therefore not be directly generalized to other regions without considering differences in climate, building stock, energy prices, district-cooling availability, ownership structures, and regulatory frameworks.
Empirical validation against measured cooling loads is limited because active comfort cooling remains uncommon in Swedish multifamily buildings. The simulated cooling loads were therefore assessed against values reported in previous studies rather than against measured data from comparable buildings.
Finally, the study does not include a dedicated environmental or emissions assessment. While district cooling may offer technical advantages such as high system efficiency, opportunities for free cooling, and integration with district heating systems, the present analysis does not quantify greenhouse-gas emissions, refrigerant leakage, life-cycle environmental impacts, or the environmental superiority of one cooling solution over another.
Discussion
The results demonstrate a clear economic advantage for early-stage district cooling connection (“Connection”) compared with after-connection district cooling (“Post connection”) across all evaluated conditions. This highlights the importance of timing in infrastructure decisions: delaying connection introduces a CAPEX penalty that is difficult to compensate for later in the system’s life cycle. This means that when constructing new buildings comfort cooling should be considered early in the process. Swedish building regulations create a risk that cooling is not included in the initial design in order to meet regulatory requirements, even though apartments are later retrofitted with electricity based individual units due to experienced overheating. This can be done as household electricity use is not measured as utility electricity but should theoretically be measured and included within the calculation of energy performance of buildings.
When electricity based strategies are used for comfort cooling, it is common to install solar photovoltaics (PV) to help meet building energy regulations, and PV is generally regarded as an effective complement to such systems. However, this approach is not compatible with district cooling. The reason is that electricity generated by PV reduces the amount of purchased electricity, making regulatory requirements easier to fulfil. District cooling, on the other hand, is not affected by on site electricity production, since PV generation does not reduce the metered energy supplied for district cooling. Electric central chiller (“Central unit”) becomes competitive mainly when district cooling tariffs are high or when electricity prices are sufficiently low relative to district cooling costs. Because district cooling costs scale linearly with delivered cooling energy at fixed tariffs, the tariff level becomes the key driver of district cooling-based strategies. In contrast, electricity price scenarios and COP dominate the performance of electric alternatives. District cooling systems that are not based on free cooling are more closely linked to electricity prices; hence, higher electricity prices would likely increase district cooling costs (for the supplier), although the COP would mitigate this impact. District cooling is often produced in combination with district heating, this means that the heating that is produced can be used in the district heating network, instead of creating heat islands in urban areas. The combination of district heating and cooling also affects the stability of price as district heating often has combined heat and power production that benefits from high electricity prices.
Cooling demand characteristics, climatic year, indoor temperature limit, and solar gain, shift NPVs across all strategies. However, the relative ranking is primarily shaped by tariff levels and technology costperformance parameters (CAPEX, COP, maintenance, and reinvestment schedule).
Conclusions
This study developed a time-resolved, 30 year life-cycle cost model to compare four cooling strategies for a Swedish multifamily building across multiple load profiles, electricity price scenarios, and district cooling tariffs. Across the evaluated conditions, early-stage district cooling connection is most often cost-optimal. Centralized electric chillers become preferable in a smaller subset of cases featuring high district cooling tariffs.
When comparing Post connection and Individual units directly, Post connection generally outperforms Individual units. The decentralized units are disadvantaged by lower COP (2.5) and higher maintenance and reinvestment needs, leading to significantly higher life-cycle costs than both the central electric option and all district cooling alternatives. Although Post connection suffers from a CAPEX premium relative to early connection, it still provides better efficiency and lower recurring costs than decentralized units.
This ranking changes only under very high district cooling tariffs. When tariffs reach the upper end of the tested range, the NPV of Post connection becomes highly unfavourable due to the combined effect of variable tariffs and the CAPEX premium. In these scenarios, the penalty for late connection becomes severe.
The study showed that Swedish building regulations make it difficult for actors in the construction industry, the energy industry and, above all, the housing industry to make the right financial choice to reduce the risk of overheating in houses built for living. Our results show that despite being the most cost-effective choice, district cooling is underestimated because of building regulations.
Future work
Future work should explore probabilistic price and climate scenarios, alternative tariff structures (e.g., capacity charges), and broader performance metrics such as emissions, peak electricity demand, and resilience during extreme heat events.
Acknowledgements
This study has been conducted with help of the district heating utility Kraftringen. They have helped with the novel project idea formulation, for data input and served as a reference group to the project.
The project was financed with support from The Thuréus Foundation for Research Residences and Natural Heritage in Culture, Nature, Literature, and Art.
Data Accessibility Statement
The simulation outputs used in the analysis, including the hourly cooling-load profiles generated from the building simulations and the resulting NPV datasets used in the techno-economic analysis, will be made available on request.
Author Contributions
Axel Johansson, Lund university, Sweden.
Contributions: Corresponding author Techno-economic analysis.
Victor Fransson, Lund university, Sweden.
Contributions: Co-author: Cooling simulations.
Ulla Janson, Lund university, Sweden.
Contributions: Co-author: Swedish building regulations.
Kristina Lygnerud, Lund university, Sweden.
Contributions: Co-author, interviews.
Kerstin Sernhed, Lund university, Sweden.
Contributions: Co-author: interviews, Project leader.