
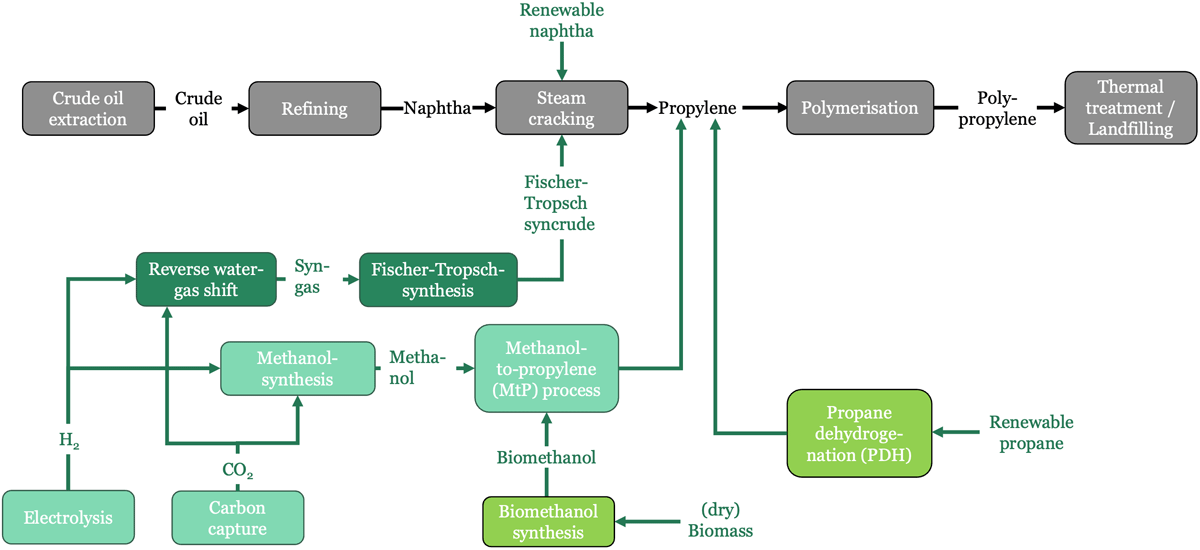
Figure 1
Primary production routes for polypropylene.
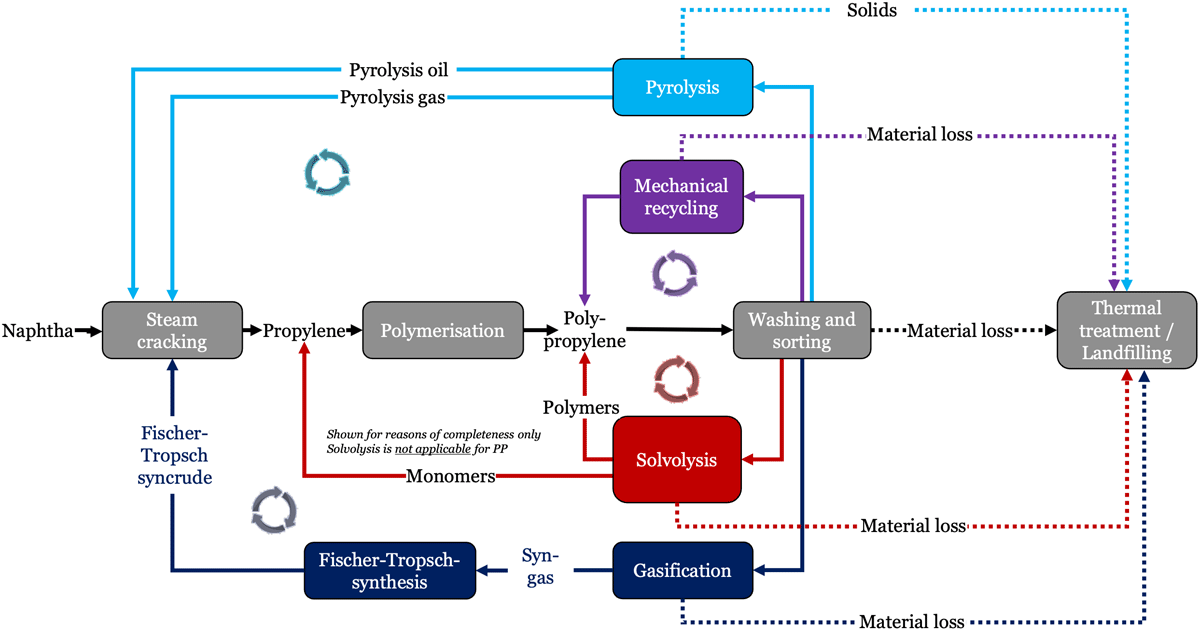
Figure 2
Secondary production routes for polypropylene. Solvolysis is shown for completeness but is not applicable to PP and is not included in the quantitative assessment.
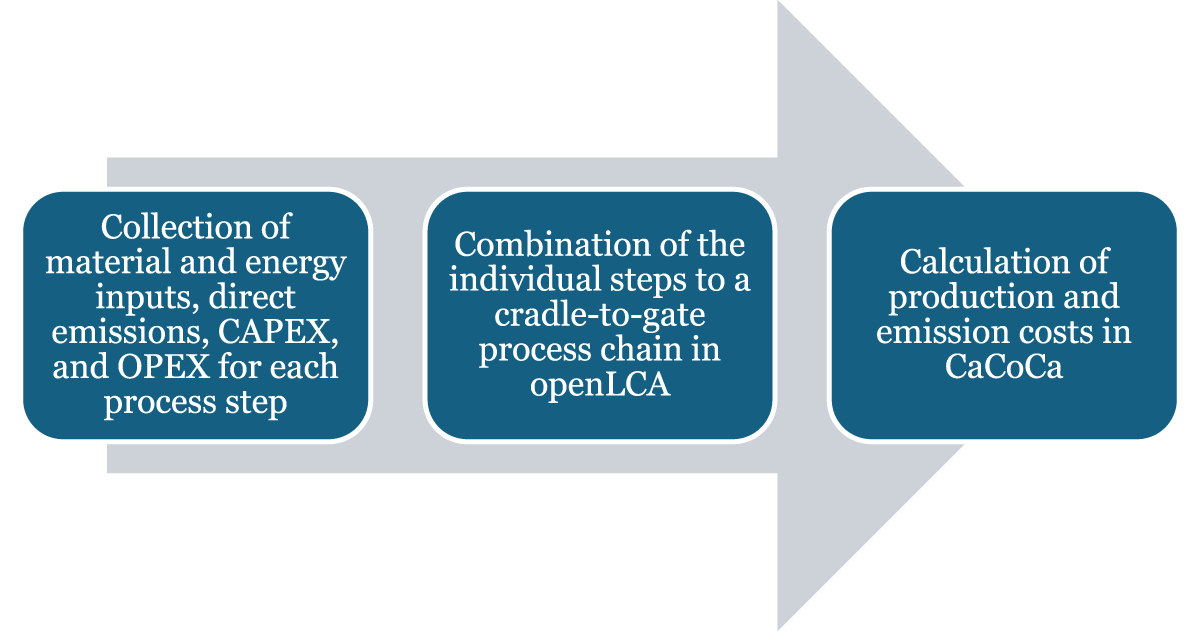
Figure 3
Modelling workflow from literature-based process-step data to pathway costs, emissions, and sensitivities.
Table 1
Overview of techno-economic data sources.
| NUM-BER | FEEDSTOCK AND PROCESS PATHWAY | PROCESS STEPS | SOURCE FOR TECHNO-ECONOMIC VALUES |
|---|---|---|---|
| 1 | Naphtha via conventional steam cracker | Conventional steam cracker | (Alsabri et al., 2021; FutureCamp and Dechema, 2019) |
| Polymerisation | (Alsabri et al., 2021; Rueda-Durán et al., 2018; Volk et al., 2021) | ||
| 2 | Naphtha via electric steam cracker | Electric steam cracker | (Alsabri et al., 2021; FutureCamp and Dechema, 2019) |
| Polymerisation | See above | ||
| 3 | Post-consumer waste (PCW) via pyrolysis and conventional steam cracker | Conventional pyrolysis | (Agora Energiewende and Wuppertal Institut, 2019; Biessey etal., 2023; Stallkamp, 2023; Stallkamp et al., 2024; Volket al., 2021) |
| Upgrading | (Dechema et al., 2021; Letoffetet al., 2024; Möck et al., 2022; Sphera, 2022) | ||
| Conventional steam cracker | See above Assumption: reduced material efficiency due to lower raw material quality | ||
| Polymerisation | See above | ||
| 4 | PCW via pyrolysis and electric steam cracker | Conventional pyrolysis | See above |
| Upgrading | See above | ||
| Electric steam cracker | See above | ||
| Polymerisation | See above | ||
| 5 | PCW via hydrocracking and conventional steam cracker | Hydrocracking | (Dechema et al., 2021; Olafasakin et al., 2023) |
| Conventional steam cracker | See above | ||
| Polymerisation | See above | ||
| 6 | PCW via hydrocracking and electric steam cracker | Hydrocracking | See above |
| Electric steam cracker | See above | ||
| Polymerisation | See above | ||
| 7 | PCW via gasification–Fischer–Tropsch and conventional steam cracker | Integrated Gasification and Fischer-Tropsch synthesis | (Ketting, 2024; Lee et al., 2023) |
| Conventional steam cracker | See above | ||
| Polymerisation | See above | ||
| 8 | PCW via gasification–Fischer–Tropsch and electric steam cracker | Integrated Gasification and Fischer-Tropsch synthesis | See above |
| Electric steam cracker | See above | ||
| Polymerisation | See above | ||
| 9 | PCW via mechanical recycling | Mechanical recycling | (Garcia-Gutierrez et al., 2023; Larrainet al., 2021; Nordahl et al., 2023) |
| 10 | Captured CO2 and H2 via methanol-to-propylene | Carbon capture via amine scrubbing | (Sollai et al., 2023) |
| Methanol synthesis with reverse water-gas shift | (Sollai et al., 2023) | ||
| Methanol-to-propylene | (Markowitsch et al., 2023) | ||
| Polymerisation | See above | ||
| 11 | Captured CO2 and H2 via Fischer–Tropsch and electric steam cracker | Carbon capture via amine scrubbing | (Sollai et al., 2023) |
| Fischer–Tropsch synthesis with reverse water-gas shift | (Markowitsch et al., 2023) | ||
| Electric steam cracker | See above | ||
| Polymerisation | See above | ||
| 12 | Biomass via biomethanol-to-propylene | Biomethanol synthesis | (Bazzanella and Ausfelder, 2017; Markowitschet al., 2023; Sollai et al., 2023) |
| Methanol-to-propylene | See above | ||
| Polymerisation | See above | ||
| 13 | Renewable naphtha via electric steam cracker | Electric steam cracker | (Alsabri et al., 2021; FutureCamp andDechema, 2019) |
| Polymerisation | See above | ||
| 14 | Renewable propane via conventional PDH | Propane dehydrogenation (PDH) | (Agarwal, 2018) |
| PDH utility integration and off-gas heat recovery | (Agarwal, 2018); author conversion assumptions | ||
| Polymerisation | See above |
Table 2
Characteristic values for the pyrolysis process step.
| DESCRIPTION | VALUE | SOURCE | |
|---|---|---|---|
| Yield | t pyrolysis oil/t PCW | 0.6 | (Biessey et al., 2023; Stallkamp, 2023; Stallkamp et al., 2024) |
| CAPEX | €/t annual capacity PCW | 100 | (Agora Energiewende and Wuppertal Institut, 2019) |
| Electric energy requirement | MWh/t PCW | 0.233 | (Ausfelder et al., 2026) |
| Direct CO2 emissions | t CO2/t PCW | 0.44 | (Volk et al., 2021) |
| Additional OPEX | €/t annual capacity PCW | 2 | (Agora Energiewende and Wuppertal Institut, 2019) |
Table 3
Characteristic values for the upgrading process step.
| UPGRADING | VALUE | SOURCE | |
|---|---|---|---|
| Yield | t upgraded oil/t pyrolysis oil | 0.939 | (Möck et al., 2022) |
| CAPEX | €/t annual capacity pyrolysis oil | 456 | (Letoffet et al., 2024; Sphera, 2022) |
| Electric energy requirement | MWh/t pyrolysis oil | 0.098 | (Letoffet et al., 2024) |
| Direct CO2 emissions | t CO2/t pyrolysis oil | 0.187 | (Letoffet et al., 2024) |
| Hydrogen demand | kg H2/t pyrolysis oil | 10 | (Dechema et al., 2021; Sphera, 2022) |
| Additional OPEX | €/t annual capacity pyrolysis oil | 11.40 | 2.5% of CAPEX |
Table 4
Characteristic values for the steam cracking process step.
| CONVENTIONAL STEAM CRACKER WITH PYROLYSIS OIL | VALUE | SOURCE | |
|---|---|---|---|
| Yield | t HVC/t cracker feed | 0.608 | Author assumption: 80% of the naphtha-based HVC yield of 0.760 |
| t propylene/t cracker feed | 0.1568 | Author assumption: 80% of the naphtha-based propylene yield of 0.196 | |
| CAPEX | €/t annual capacity HVC | 2,250 | Conversion |
| €/t annual capacity pyrolysis oil | 1,710 | Conversion | |
| Natural gas energy requirement | GJ/t HVC | 16.50 | (FutureCamp and Dechema, 2019) |
| MWh/t HVC | 4.58 | Conversion | |
| MWh/t pyrolysis oil | 3.48 | Conversion | |
| Electric energy requirement | GJ/t HVC | 1.00 | (FutureCamp and Dechema, 2019) |
| MWh/t HVC | 0.28 | Conversion | |
| MWh/t pyrolysis oil | 0.21 | Conversion | |
| Direct CO2 emissions | tCO2/t propene | 1.35 | (Alsabri et al., 2021) |
| tCO2/t pyrolysis oil | 1.026 | Conversion | |
| Additional OPEX | €/t pyrolysis oil | 85.5 | 5% of CAPEX |
Table 5
Characteristic values for the polymerisation process step.
| POLYMERISATION | VALUE | SOURCE | |
|---|---|---|---|
| Yield | t PP/t propene | 0.985 | Author assumption |
| CAPEX | €/t annual capacity PP | 200 | (Rueda-Durán et al., 2018); rounded author assumption |
| Electric energy requirement | MWh/t PP | 0.23 | (Volk et al., 2021) |
| Direct CO2 emissions | t CO2/t PP | 0.20 | (Alsabri et al., 2021) |
| Additional OPEX | €/t PP | 5.00 | 2.5% of the assumed CAPEX of €200/t annual PP capacity |
Table 6
Aggregated characteristic values for the pyrolysis process chain.
| PROCESS CHAIN PYROLYSIS | CONVENTIONAL STEAM CRACKER | ELECTRIC STEAM CRACKER | |
|---|---|---|---|
| CAPEX | €/t annual capacity PP | 4,011.55 | 4,011.55 |
| Raw material requirement PCW | t PCW/t PP | 1.80 | 1.80 |
| Natural gas energy demand | MWh/t PP | 5.81 | 0.00 |
| Electric energy demand | MWh/t PP | 1.11 | 6.92 |
| Hydrogen demand | kg H2/t PP | 10.81 | 10.81 |
| Direct CO2 emissions | t CO2/t PP | 2.91 | 1.19 |
| Additional OPEX | €/t PP | 177.85 | 177.85 |
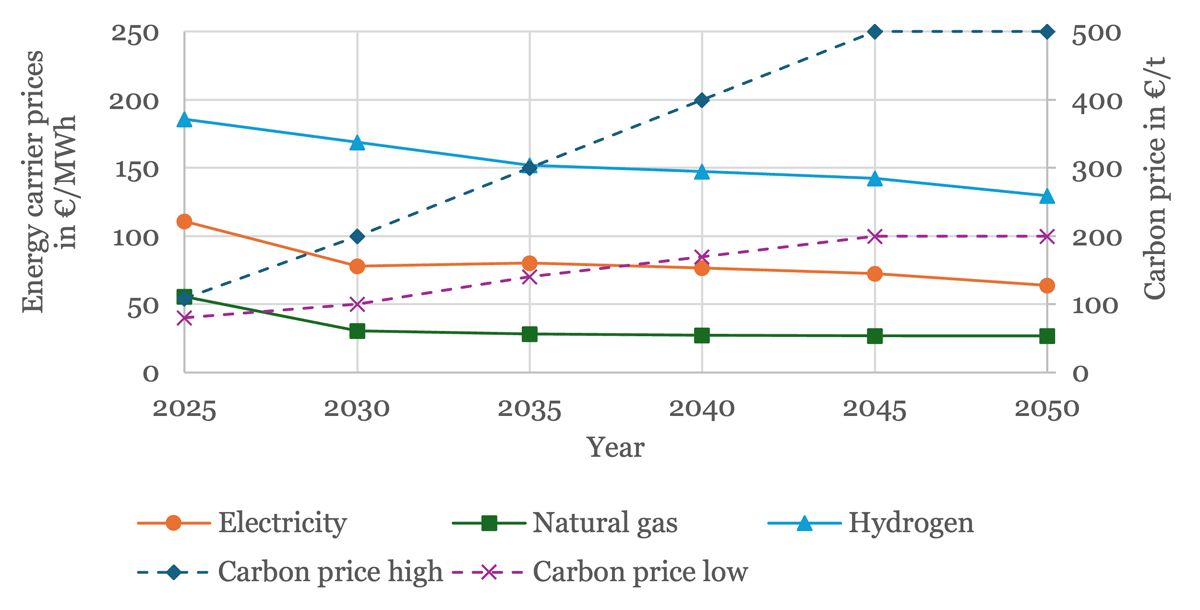
Figure 4
Price trajectories for CO2 and energy carriers.
Table 7
Energy, carbon, and material-feedstock price assumptions used in the model.Note: Hydrogen prices in €/MWh are expressed on a lower-heating-value basis of 33.3 kWh/kg.
| INPUT | UNIT | 2025/2035/2045 | SOURCE OR MODEL SCENARIO |
|---|---|---|---|
| Electricity | €/MWh | 110.8/80.2/69.8 | Treibhausgas-Projektionen 2026 |
| Natural gas | €/MWh | 55.73/28.22/26.99 | Treibhausgas-Projektionen 2026 |
| Hydrogen | €/MWh | 185.98/152.01/133.24 | Treibhausgas-Projektionen 2026 |
| €/kg | 6.19/5.06/4.44 | ||
| CO2 price, high | €/t CO2 | 108.84/300/500 | Ariadne KN2045_Mix |
| CO2 price, low | €/t CO2 | 80.27/140/200 | Ariadne ExPol |
| Naphtha | €/t | 600/600/600 | US$567/t average in 2025 (BASF, 2026), rounded |
| Processed PCW | €/t | 125/125/125 | Author assumption for processed PCW delivered to recycling; collection, sorting, and washing costs embodied in price based on (Cimpan et al., 2016; Garcia-Gutierrez et al., 2023) |
| Dry biomass | €/t (dry) | 71.2/71.2/71.2 | (Haro et al., 2013) |
| Renewable naphtha | €/t | 1,350/1,350/1,350 | market-based and rounded baseline value (S&P Global Commodity Insights, 2025) |
| Renewable propane | €/t | 1,200/1,200/1,200 | market-based and rounded baseline value (S&P Global Commodity Insights, 2025) |
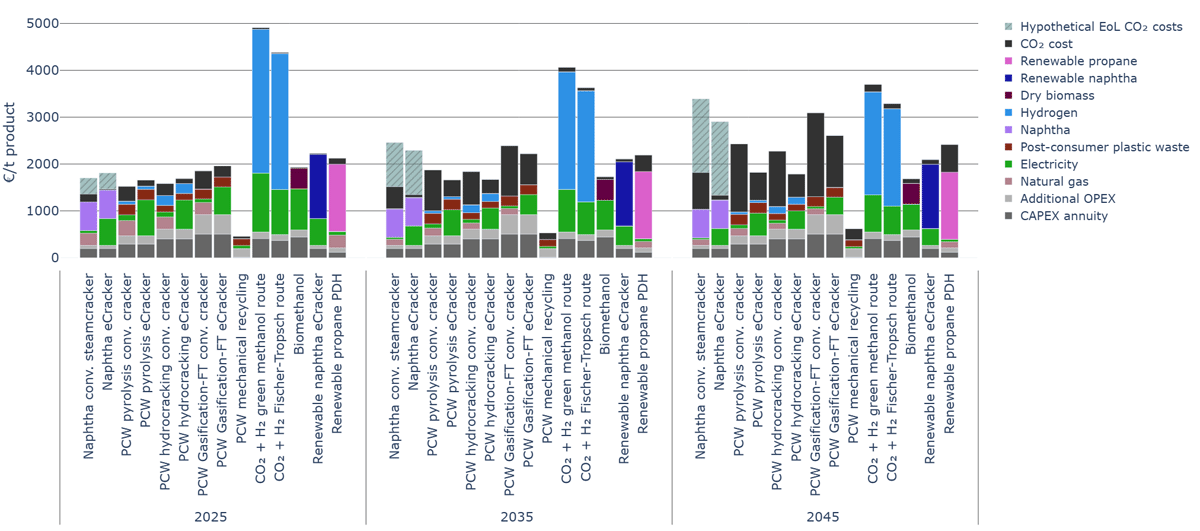
Figure 5
Levelised polypropylene production costs in 2025, 2035 and 2045 under the high carbon-price trajectory. Hypothetical fossil end-of-life CO2 costs are shown as a separate component.
Table 8
Aggregated direct process emissions and separately attributed hypothetical fossil end-of-life emissions (t CO2/t PP).
| NUMBER | PATHWAY | DIRECT PROCESS | HYPOTHETICAL EoL | TOTAL INCL. EoL |
|---|---|---|---|---|
| 1 | Fossil naphtha conv. | 1.57 | 3.14 | 4.71 |
| 2 | Fossil naphtha electric | 0.20 | 3.14 | 3.34 |
| 3 | PCW pyrolysis conv. | 2.91 | 0.00 | 2.91 |
| 4 | PCW pyrolysis electric | 1.19 | 0.00 | 1.19 |
| 5 | PCW hydrocr. conv. | 2.36 | 0.00 | 2.36 |
| 6 | PCW hydrocr. electric | 0.99 | 0.00 | 0.99 |
| 7 | PCW gasif.–FT conv. | 3.58 | 0.00 | 3.58 |
| 8 | PCW gasif.–FT electric | 2.21 | 0.00 | 2.21 |
| 9 | PCW mechanical recycling | 0.47 | 0.00 | 0.47 |
| 10 | CO2/H2 methanol to propylene | 0.32 | 0.00 | 0.32 |
| 11 | CO2/H2 FT electric | 0.22 | 0.00 | 0.22 |
| 12 | Biomass methanol to propylene | 0.20 | 0.00 | 0.20 |
| 13 | Renewable naphtha, electric cracker | 0.20 | 0.00 | 0.20 |
| 14 | Renewable propane, conventional PDH | 1.18 | 0.00 | 1.18 |
Table 9
Full range of 2045 production costs between the –20% and +20% price cases and between the low and high CO2 trajectories (€/t PP).
| NO. | PATHWAY | ELECTRICITY | NATURAL GAS | H2 | PCW | RENEW. FEEDSTOCK | CO2 |
|---|---|---|---|---|---|---|---|
| 1 | Fossil naphtha, conventional | 14 | 50 | – | – | – | 1,413 |
| 2 | Fossil naphtha, electric | 144 | – | – | – | – | 1,002 |
| 3 | Pyrolysis, conventional | 31 | 63 | 19 | 90 | – | 872 |
| 4 | Pyrolysis, electric | 193 | – | 19 | 90 | – | 358 |
| 5 | Hydrocracking, conventional | 27 | 50 | 60 | 56 | – | 708 |
| 6 | Hydrocracking, electric | 157 | – | 60 | 56 | – | 297 |
| 7 | Gasification–FT, conventional | 19 | 50 | – | 84 | – | 1,074 |
| 8 | Gasification–FT, electric | 149 | – | – | 84 | – | 663 |
| 9 | Mechanical recycling | 16 | – | – | 59 | – | 141 |
| 10 | CO2/H2 methanol route | 317 | – | 880 | – | – | 96 |
| 11 | CO2/H2 FT route | 242 | – | 832 | – | – | 65 |
| 12 | Biomethanol route | 221 | – | – | – | 177 (dry biomass) | 60 |
| 13 | Renewable naphtha, electric cracker | 144 | – | – | – | 548 (renew. naphtha) | 60 |
| 14 | Renewable propane, conventional PDH | 20 | 53 | – | – | 573 (renew. propane) | 354 |