
Introduction
A world without plastics seems unimaginable today. The first synthetic polymer was discovered by Leo Baekeland in 1907 (Kaufmann, 2011). The rapid growth in plastics use during the second half of the 20th century was unmatched by that of other man-made materials (Geyer et al., 2017). In contrast to steel and cement, a large fraction of all plastics are used for packaging or single-use applications with a typically very short lifespan (Conversio, 2024).
More than 80% of plastics produced today are based on fossil resources (Conversio, 2024). Conventional plastics production relies heavily on fossil energy and uses fossil carbon to build polymer chains. Several life cycle assessment (LCA) studies of polypropylene (PP) pellet production were compared by Alsabri et al. (2021). Depending on the world region, the reviewed studies reported 1.4–2.4 kg CO2-eq per kg PP. Most of the commonly used plastics are not biodegradable. As a result and due to the short lifespan of most plastic products, they either accumulate in the environment or need to be thermally destroyed by combustion or other thermal treatments (Geyer et al., 2017).
Scope 3 category 12 covers emissions from the end-of-life treatment of sold products. For conventionally produced polypropylene, these emissions arise when fossil carbon embedded in the polymer is released during incineration or other oxidative treatment. The factor used in this study is 3.14 kg CO2 per kg PP (Guidehouse et al., 2024), compared with reported cradle-to-gate emissions of 1.4–2.4 kg CO2-eq per kg polypropylene (Alsabri et al., 2021). The EU Emissions Trading System primarily regulates emissions at installation level. Since 2024, municipal waste-incineration installations above the relevant threshold have been included for monitoring, reporting and verification, but they are not currently required to surrender allowances for these emissions (European Commission, 2024). Consequently, fossil carbon embedded in polypropylene is not priced at the point of polymer production, and the end-of-life cost is not assigned to the producer.
Avoiding the release of fossil product carbon requires either retaining carbon in closed material cycles or replacing fossil feedstocks with recycled, biogenic, or CO2-derived carbon.
The analysis applies German industrial energy-price projections and European carbon-price trajectories. Germany was selected as the case-study context because a consistent set of industrial energy-price projections is available for this national setting, whereas carbon pricing is governed at EU level through the EU ETS. The results therefore represent German industrial cost conditions embedded in a common European regulatory framework rather than a uniform European cost case. Within this scope, the study compares fossil-carbon primary production, renewable-carbon primary production, and recycling pathways for polypropylene.
Polypropylene production pathways
This study focuses on polypropylene as a representative polyolefin. With 21.8% of German plastics production in 2023, polypropylene is one of the country’s most widely produced polymers (Conversio, 2024). In the conventional primary route, crude oil is separated in a refinery, where naphtha is obtained as a light hydrocarbon fraction. Naphtha is then converted in a steam cracker into high-value chemicals (HVCs), including propylene, which is polymerised to polypropylene (Kricheldorf et al., 2020). Both conventional and electrically heated steam-cracker variants are assessed. The electric variant substitutes electricity for fossil process heat but retains the same carbon feedstock.
The renewable-carbon primary routes comprise five configurations shown in Figure 1. The two power-to-X routes use captured CO2 and electrolytic hydrogen: methanol synthesis followed by methanol-to-propylene conversion, and Fischer–Tropsch synthesis followed by electric steam cracking (Markowitsch et al., 2023). The three further renewable-carbon routes comprise biomass via biomethanol-to-propylene, purchased renewable naphtha in an electric steam cracker, and purchased renewable propane in a conventional propane dehydrogenation (PDH) process (Agarwal, 2018). Biomethanol-to-propylene shares the conversion process of the power-to-X (PtX) methanol route and thereby permits a direct feedstock comparison. All routes produce chemically equivalent polypropylene; a biogenic feedstock does not make the polymer biodegradable.
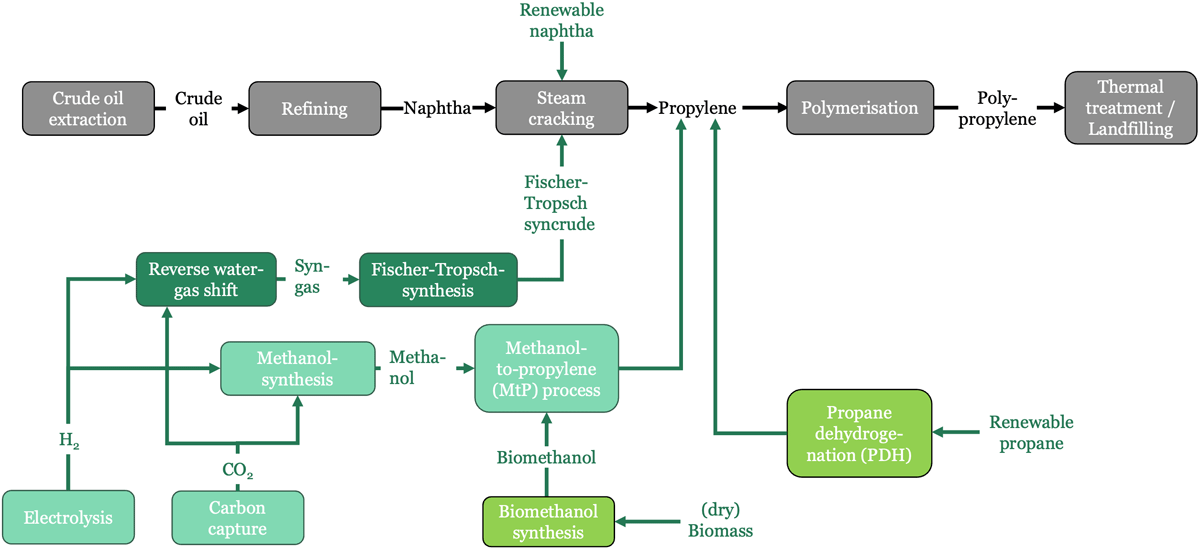
Figure 1
Primary production routes for polypropylene.
Figure 2 presents the recycling routes. After collection, sorting and washing, suitable polypropylene waste can be mechanically recycled by melting and regranulation (Schyns and Shaver, 2021). Mechanical recycling retains the polymer structure but may be constrained by contamination, polymer degradation, and product-quality requirements. The assessed chemical-recycling routes convert waste into hydrocarbon intermediates that re-enter upstream production. Solvolysis is shown only as a general comparison in the original pathway overview; it is not applicable to polypropylene and is not included in the quantitative assessment.
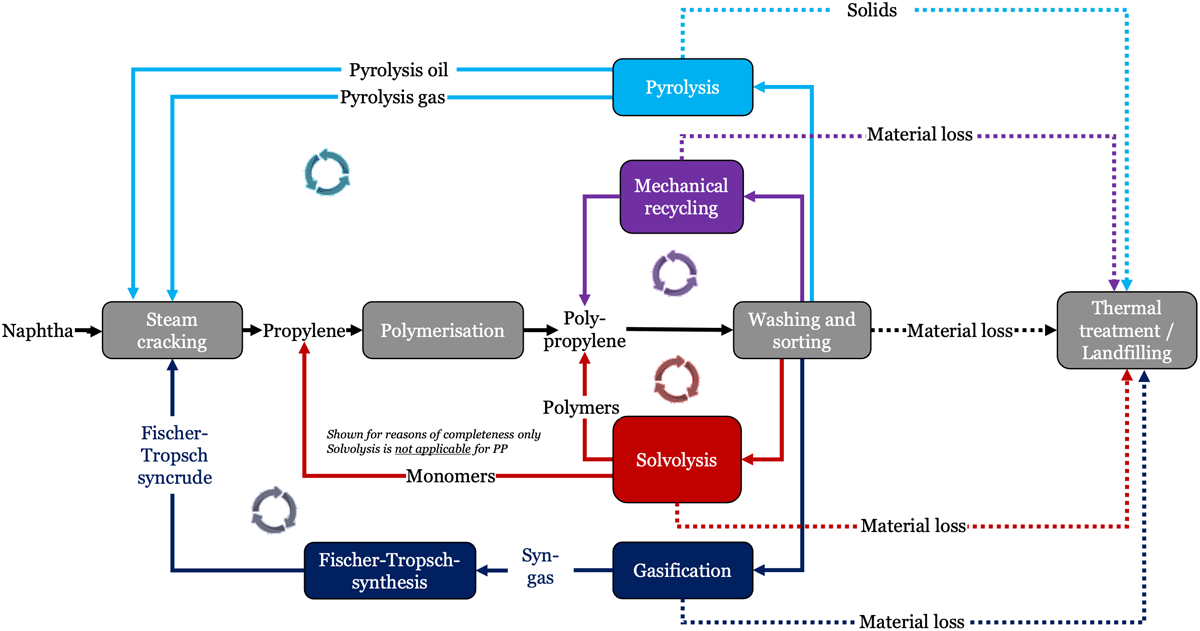
Figure 2
Secondary production routes for polypropylene. Solvolysis is shown for completeness but is not applicable to PP and is not included in the quantitative assessment.
Pyrolysis and gasification differ in their principal intermediate products and downstream requirements. Pyrolysis thermally decomposes plastic waste in the absence of oxygen and produces a mixture of pyrolysis oil, gas, and solid residues. The pyrolysis oil is the main product but generally requires upgrading before it can be used in steam cracking. Gasification operates at higher temperatures with a controlled amount of oxygen and/or steam and primarily produces synthesis gas, which is converted through Fischer–Tropsch synthesis to a synthetic naphtha substitute before steam cracking. Hydrocracking is assessed as a variant of thermochemical cracking in which hydrogen is supplied to saturate hydrocarbon molecules and improve the quality of the liquid product. The model therefore assumes that no separate upgrading step is required. All recycling routes involve material losses. For a system maintaining constant polypropylene output, these losses require additional carbon input. This is particularly relevant to circularity because losses prevent a fully closed material loop even when the make-up carbon is supplied from non-fossil sources (Biessey et al., 2023).
Existing comparative assessments and contribution of this study
Comparative studies of propylene and olefin production already cover several relevant subsets of the pathway space. Zhao et al. (2017) compare primary energy demand and life-cycle greenhouse-gas emissions for petroleum- and coal-based propylene routes in China. Kim et al. (2021) evaluate two CO2-based methanol-to-propylene configurations using process simulation, economic analysis, and environmental assessment. Shirzad and Kantor (2025) review a broad range of current and prospective sustainable propylene routes. Further studies compare selected lower-olefin production routes or recycling technologies (Markowitsch et al., 2023; Volk et al., 2021).
These studies differ in product scope, geography, system boundary, and analytical objective. The contribution of the present study is not the first comparison of alternative propylene routes, but a harmonised pathway-level assessment of 14 polypropylene production configurations within one functional unit and one cost framework. The comparison jointly covers fossil primary production, conventional and electric steam cracking, mechanical and chemical recycling, CO2/H2-based primary production as well as renewable-carbon primary production from biomass and renewable hydrocarbon feedstocks. It combines process-chain aggregation with common energy and carbon-price trajectories and reports hypothetical end-of-life carbon costs separately from current regulatory costs.
The study addresses the following questions:
How do levelised production costs and pathway emissions compare across fossil-carbon, renewable-carbon, and recycling-based polypropylene production routes under the selected German industrial price assumptions?
Which energy, feedstock, and carbon-price parameters dominate the relative competitiveness of the assessed pathways, and how does the treatment of fossil end-of-life emissions affect the comparison?
Methods
Modelling workflow and cost calculation
The analysis combines process-chain aggregation with a project-specific fork of the CaCoCa software (Dürrwächter et al., 2023; Maertens and Weiss, 2025). Individual process steps are first combined into a process chain using openLCA (GreenDelta GmbH, 2025). The material and energy inputs, direct emissions, capital expenditure (CAPEX), and operating expenditure (OPEX) for each step are converted to the functional unit of 1 tonne of polypropylene based on the yield of each process step. The resulting aggregated pathway parameters are then passed to CaCoCa for the annual calculation of production and emission costs.
Only the process-comparison functionality of CaCoCa was used; the auction module for carbon contracts for difference was not applied. The fork enables multiple polypropylene pathways to be compared within one run and adds project-specific output and plotting routines. CaCoCa itself does not chain individual process steps; this aggregation is completed beforehand in openLCA and imported as one parameter set per pathway. Figure 3 shows the workflow.
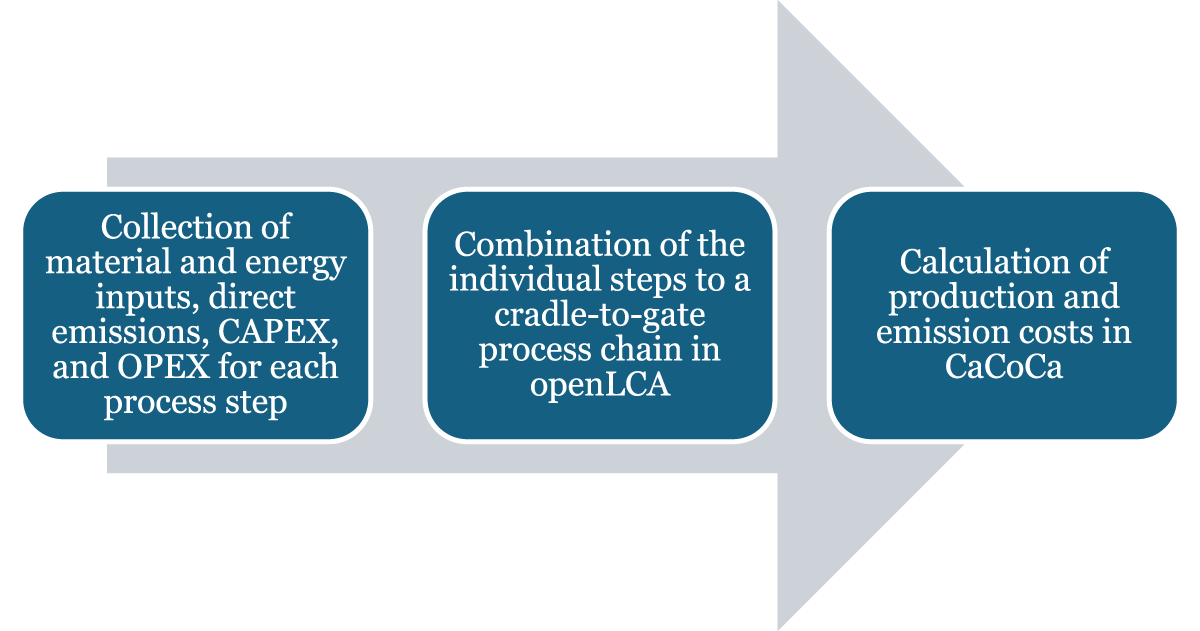
Figure 3
Modelling workflow from literature-based process-step data to pathway costs, emissions, and sensitivities.
The cost calculation follows the implemented CaCoCa code. For each pathway and year, the model first calculates the CAPEX annuity from total CAPEX, plant capacity, planned annual production, the pathway-specific technical lifetime, and the weighted average cost of capital. The model then sums this annualised CAPEX contribution, additional OPEX, and each selected material or energy demand multiplied by its exogenous price. Direct process carbon costs are added for reporting as the pathway emission factor multiplied by the applicable CO2 price.
A uniform weighted average cost of capital (WACC) of 6% is applied to all pathways, while technical lifetimes are specified by pathway. For the two fossil-naphtha routes, the model contains an additional emission cost component representing the hypothetical cost of fossil carbon released at end-of-life. This component is displayed separately. ‘Current regulatory cost’ is reported without this hypothetical component, whereas the analytical total includes it.
Assumptions for techno-economic and life cycle analyses
The modelling framework represents a static techno-economic comparison. No technology-specific learning curves are applied; CAPEX and additional OPEX therefore remain constant over the modelled period. The literature values cover technologies at different levels of maturity, ranging from commercial processes to demonstration plants and conceptual mature-plant estimates. The model does not apply a systematic correction for first-of-a-kind costs or technology readiness. This limits the interpretation of the year-specific results as present-day investment costs. Market dynamics and availability restrictions for energy carriers and feedstocks are likewise outside the model scope.
Several assessed chemical processes are multi-output plants and therefore require allocation of inputs, emissions, and costs to polypropylene precursors. Following the Together for Sustainability guidance (2024), material feedstocks are allocated by mass. Energy demand and process emissions are allocated according to the share of the relevant product in high-value chemicals (HVCs).
CAPEX and additional OPEX are allocated economically across the HVC product portfolio. Under the product shares and price assumptions used for the steam cracker, propylene receives 28.2% of the economically allocated CAPEX and OPEX. The complete allocation calculation, including ethylene, propylene, C4 products, BTX, and C5+ products, is provided in the Supporting Information.
All process data are taken from published literature or—where no credible literature value was identified—are explicitly labelled as author assumptions; no primary plant data were collected. The functional unit is 1 tonne of polypropylene pellets at the gate of the polymerisation plant after pelletisation. Source data were converted to common physical units and aggregated to the functional unit using process yields. A common WACC, pathway-specific lifetimes, and common energy and carbon-price trajectories are then applied. No comprehensive normalisation for plant scale or technology maturity was possible because the underlying publications report these dimensions inconsistently; remaining differences are treated as a limitation rather than assumed to have been fully harmonised. The environmental boundary covers the cradle-to-gate process chain and reports fossil end-of-life emissions separately. The use phase is excluded.
The functional unit is mass-based and no application-independent quality correction is applied to recycled polypropylene. The reported values therefore represent costs per tonne of material produced, not costs per unit of equivalent performance in every downstream application, which is especially relevant for mechanical recycling.
Scope and limitations
The analysis is a pathway-level engineering cost comparison rather than a market-deployment forecast or system optimisation. It does not determine technologically achievable recycling shares, sustainable biomass availability, or the market availability, certification, competing uses, and upstream environmental performance of renewable methanol, naphtha, and propane. Electricity and hydrogen are represented by annual average prices. Temporal operation, grid constraints, contracting arrangements, and supply-specific life-cycle emissions are outside of the model scope.
The emission indicators are the aggregated direct process emissions used in the cost model and are not a complete consequential life-cycle assessment. Carbon is not tracked through multiple recycling cycles, and no additional end-of-life term is assigned to recycling pathways. The hypothetical end-of-life component is applied only to the two fossil-naphtha primary routes and is reported separately from current regulatory costs. The assumption that all fossil product carbon is eventually released may overestimate emissions where carbon is retained in products, landfilled, or captured during waste treatment.
Overview of techno-economic data sources
Table 1 summarises the final pathway set, its feedstocks and process steps, and the literature sources used for the techno-economic inventories.
Table 1
Overview of techno-economic data sources.
| NUM-BER | FEEDSTOCK AND PROCESS PATHWAY | PROCESS STEPS | SOURCE FOR TECHNO-ECONOMIC VALUES |
|---|---|---|---|
| 1 | Naphtha via conventional steam cracker | Conventional steam cracker | (Alsabri et al., 2021; FutureCamp and Dechema, 2019) |
| Polymerisation | (Alsabri et al., 2021; Rueda-Durán et al., 2018; Volk et al., 2021) | ||
| 2 | Naphtha via electric steam cracker | Electric steam cracker | (Alsabri et al., 2021; FutureCamp and Dechema, 2019) |
| Polymerisation | See above | ||
| 3 | Post-consumer waste (PCW) via pyrolysis and conventional steam cracker | Conventional pyrolysis | (Agora Energiewende and Wuppertal Institut, 2019; Biessey etal., 2023; Stallkamp, 2023; Stallkamp et al., 2024; Volket al., 2021) |
| Upgrading | (Dechema et al., 2021; Letoffetet al., 2024; Möck et al., 2022; Sphera, 2022) | ||
| Conventional steam cracker | See above Assumption: reduced material efficiency due to lower raw material quality | ||
| Polymerisation | See above | ||
| 4 | PCW via pyrolysis and electric steam cracker | Conventional pyrolysis | See above |
| Upgrading | See above | ||
| Electric steam cracker | See above | ||
| Polymerisation | See above | ||
| 5 | PCW via hydrocracking and conventional steam cracker | Hydrocracking | (Dechema et al., 2021; Olafasakin et al., 2023) |
| Conventional steam cracker | See above | ||
| Polymerisation | See above | ||
| 6 | PCW via hydrocracking and electric steam cracker | Hydrocracking | See above |
| Electric steam cracker | See above | ||
| Polymerisation | See above | ||
| 7 | PCW via gasification–Fischer–Tropsch and conventional steam cracker | Integrated Gasification and Fischer-Tropsch synthesis | (Ketting, 2024; Lee et al., 2023) |
| Conventional steam cracker | See above | ||
| Polymerisation | See above | ||
| 8 | PCW via gasification–Fischer–Tropsch and electric steam cracker | Integrated Gasification and Fischer-Tropsch synthesis | See above |
| Electric steam cracker | See above | ||
| Polymerisation | See above | ||
| 9 | PCW via mechanical recycling | Mechanical recycling | (Garcia-Gutierrez et al., 2023; Larrainet al., 2021; Nordahl et al., 2023) |
| 10 | Captured CO2 and H2 via methanol-to-propylene | Carbon capture via amine scrubbing | (Sollai et al., 2023) |
| Methanol synthesis with reverse water-gas shift | (Sollai et al., 2023) | ||
| Methanol-to-propylene | (Markowitsch et al., 2023) | ||
| Polymerisation | See above | ||
| 11 | Captured CO2 and H2 via Fischer–Tropsch and electric steam cracker | Carbon capture via amine scrubbing | (Sollai et al., 2023) |
| Fischer–Tropsch synthesis with reverse water-gas shift | (Markowitsch et al., 2023) | ||
| Electric steam cracker | See above | ||
| Polymerisation | See above | ||
| 12 | Biomass via biomethanol-to-propylene | Biomethanol synthesis | (Bazzanella and Ausfelder, 2017; Markowitschet al., 2023; Sollai et al., 2023) |
| Methanol-to-propylene | See above | ||
| Polymerisation | See above | ||
| 13 | Renewable naphtha via electric steam cracker | Electric steam cracker | (Alsabri et al., 2021; FutureCamp andDechema, 2019) |
| Polymerisation | See above | ||
| 14 | Renewable propane via conventional PDH | Propane dehydrogenation (PDH) | (Agarwal, 2018) |
| PDH utility integration and off-gas heat recovery | (Agarwal, 2018); author conversion assumptions | ||
| Polymerisation | See above |
Route 13 applies the electric steam-cracker and polymerisation inventories already used in route 2 with purchased renewable naphtha. Cracker heat is assumed to be supplied electrically. Route 14 combines a conventional PDH design with the common polymerisation step.
Combination of process steps into process chains
The aggregation procedure is illustrated for pathway 3, the pyrolysis route. Plastic waste is thermally decomposed in the absence of oxygen, producing a liquid hydrocarbon mixture (pyrolysis oil), a non-condensable gas, and a solid residue. The pyrolysis oil is intended as a naphtha substitute but requires upgrading because of its contaminant content. It can then be fed to the steam cracker, potentially in a blend with fossil naphtha. The subsequent polymerisation of the resulting propylene corresponds to the reference route.
The following assumptions are made for this study:
Sorting and washing of plastic waste are not represented as separate unit processes. Instead, the processed waste price includes the associated preparation and emission costs.
The upgraded pyrolysis oil is assumed to have sufficient quality for direct use in the steam cracker without dilution. A steam-cracking yield equal to 80% of the naphtha-based yield is applied.
The yield of liquid pyrolysis oil from mixed plastic waste varies greatly depending on the composition of the waste and the process conditions, but is typically in the range of 50–70% by weight (Biessey et al., 2023; Stallkamp, 2023; Stallkamp et al., 2024). An average oil yield of 60% is assumed for modelling purposes. The pyrolysis gas produced is used to cover the process heat requirements of the pyrolysis plant, which generates further CO2 emissions. The investment costs for pyrolysis plants are estimated at €100/t annual capacity PCW (post-consumer waste) (Agora Energiewende and Wuppertal Institut, 2019).
Pyrolysis is an endothermic process, but most of the required process heat is covered by combustion of the internally generated pyrolysis gas. The remaining external energy demand mainly comprises electricity for pumps, conveyor systems, and control equipment and is set to 0.233 MWh/t PCW based on Ausfelder et al. (2026). Direct CO2 emissions arise primarily from combustion of the pyrolysis gas and amount to approximately 0.44 t CO2/t PCW for packaging waste (Volk et al., 2021). Additional OPEX is estimated at 2% of CAPEX, corresponding to €2/t PCW (Agora Energiewende and Wuppertal Institut, 2019). Table 2 summarises the parameters of the pyrolysis step.
Table 2
Characteristic values for the pyrolysis process step.
| DESCRIPTION | VALUE | SOURCE | |
|---|---|---|---|
| Yield | t pyrolysis oil/t PCW | 0.6 | (Biessey et al., 2023; Stallkamp, 2023; Stallkamp et al., 2024) |
| CAPEX | €/t annual capacity PCW | 100 | (Agora Energiewende and Wuppertal Institut, 2019) |
| Electric energy requirement | MWh/t PCW | 0.233 | (Ausfelder et al., 2026) |
| Direct CO2 emissions | t CO2/t PCW | 0.44 | (Volk et al., 2021) |
| Additional OPEX | €/t annual capacity PCW | 2 | (Agora Energiewende and Wuppertal Institut, 2019) |
The pyrolysis oil is subsequently upgraded by mild hydrotreatment, as untreated oil cannot be used as a drop-in replacement for fossil naphtha. A yield of 93.9% is assumed (Möck et al., 2022). In the upgrading step, the pyrolysis oil is saturated with hydrogen atoms. Hydrogen requirements are reported to range from 5 to 50 kg H2 per tonne of pyrolysis oil (Dechema et al., 2021; Sphera, 2022). Reliable estimates of CAPEX, OPEX, and CO2 emissions remain difficult to obtain because of the low technology readiness level (Stallkamp, 2023). Based on estimates by Sphera (2022) and Letoffet et al. (2024), CAPEX of €456 per tonne of annual pyrolysis-oil capacity is assumed. Electricity consumption, direct CO2 emissions, and hydrogen demand are set to 0.098 MWh, 0.187 t CO2, and 10 kg H2 per tonne of pyrolysis oil, respectively. Table 3 summarises these parameters.
Table 3
Characteristic values for the upgrading process step.
| UPGRADING | VALUE | SOURCE | |
|---|---|---|---|
| Yield | t upgraded oil/t pyrolysis oil | 0.939 | (Möck et al., 2022) |
| CAPEX | €/t annual capacity pyrolysis oil | 456 | (Letoffet et al., 2024; Sphera, 2022) |
| Electric energy requirement | MWh/t pyrolysis oil | 0.098 | (Letoffet et al., 2024) |
| Direct CO2 emissions | t CO2/t pyrolysis oil | 0.187 | (Letoffet et al., 2024) |
| Hydrogen demand | kg H2/t pyrolysis oil | 10 | (Dechema et al., 2021; Sphera, 2022) |
| Additional OPEX | €/t annual capacity pyrolysis oil | 11.40 | 2.5% of CAPEX |
Even after upgrading, pyrolysis oil is treated as a feedstock with uncertain steam-cracking performance. Experimental studies show that product yields depend strongly on waste composition, oil treatment, blending ratio, and cracking conditions; blended pyrolysis oils can achieve light-olefin yields comparable to naphtha, but these findings do not provide a directly transferable value for the pure upgraded feedstock represented here (Kusenberg et al., 2022). The model therefore retains a conservative author assumption that propylene output is 80% of the naphtha-based yield. The natural-gas and electricity requirements of the conventional cracker are taken from FutureCamp and Dechema (2019) and converted from the HVC basis to the required pyrolysis-oil and polypropylene basis. Additional OPEX is set to 5% of CAPEX to reflect the more demanding feedstock. Table 4 documents the calculation.
Table 4
Characteristic values for the steam cracking process step.
| CONVENTIONAL STEAM CRACKER WITH PYROLYSIS OIL | VALUE | SOURCE | |
|---|---|---|---|
| Yield | t HVC/t cracker feed | 0.608 | Author assumption: 80% of the naphtha-based HVC yield of 0.760 |
| t propylene/t cracker feed | 0.1568 | Author assumption: 80% of the naphtha-based propylene yield of 0.196 | |
| CAPEX | €/t annual capacity HVC | 2,250 | Conversion |
| €/t annual capacity pyrolysis oil | 1,710 | Conversion | |
| Natural gas energy requirement | GJ/t HVC | 16.50 | (FutureCamp and Dechema, 2019) |
| MWh/t HVC | 4.58 | Conversion | |
| MWh/t pyrolysis oil | 3.48 | Conversion | |
| Electric energy requirement | GJ/t HVC | 1.00 | (FutureCamp and Dechema, 2019) |
| MWh/t HVC | 0.28 | Conversion | |
| MWh/t pyrolysis oil | 0.21 | Conversion | |
| Direct CO2 emissions | tCO2/t propene | 1.35 | (Alsabri et al., 2021) |
| tCO2/t pyrolysis oil | 1.026 | Conversion | |
| Additional OPEX | €/t pyrolysis oil | 85.5 | 5% of CAPEX |
For the electric steam-cracker variants, fossil-fired process heat is replaced by electricity while the material conversion and carbon feedstock remain unchanged. The aggregated electricity demand therefore increases and direct combustion emissions decrease. The model represents a greenfield comparison and applies the same total cracker CAPEX to the conventional and electric variants. The additional investment values reported in Roadmap Chemie 2050 (FutureCamp and Dechema, 2019) refer to retrofitting existing furnaces and are therefore not added to the greenfield CAPEX assumed. Electrically heated cracking is not yet a fully established commercial reference technology: BASF, SABIC, and Linde started operation of a 6 MW demonstration plant integrated into the Ludwigshafen steam cracker in 2024 (BASF, 2024). The pathway values should therefore be interpreted as literature-based process assumptions rather than observed commercial costs.
The final process step is polymerisation. A polymerisation yield of 98.5% is assumed. No sufficiently specific literature value was identified for this yield, and it is therefore treated as an author assumption. Rueda-Durán et al. (2018) report investment costs of approximately USD 150 per tonne of annual PP capacity for a Colombian case study. To reflect the different regional context and the uncertainty of transfer, the present analysis uses a rounded author assumption of €200 per tonne of annual PP capacity.
The electricity requirement is set to 0.23 MWh/t PP (Volk et al., 2021) and no natural gas is assigned to the polymerisation step. Direct process emissions are set to 0.20 t CO2/t PP (Alsabri et al., 2021). Additional OPEX is assumed to equal 2.5% of CAPEX. Table 5 summarises the polymerisation parameters.
Table 5
Characteristic values for the polymerisation process step.
| POLYMERISATION | VALUE | SOURCE | |
|---|---|---|---|
| Yield | t PP/t propene | 0.985 | Author assumption |
| CAPEX | €/t annual capacity PP | 200 | (Rueda-Durán et al., 2018); rounded author assumption |
| Electric energy requirement | MWh/t PP | 0.23 | (Volk et al., 2021) |
| Direct CO2 emissions | t CO2/t PP | 0.20 | (Alsabri et al., 2021) |
| Additional OPEX | €/t PP | 5.00 | 2.5% of the assumed CAPEX of €200/t annual PP capacity |
The individual process steps were aggregated using the openLCA software. The calculation results are listed in Table 6.
Table 6
Aggregated characteristic values for the pyrolysis process chain.
| PROCESS CHAIN PYROLYSIS | CONVENTIONAL STEAM CRACKER | ELECTRIC STEAM CRACKER | |
|---|---|---|---|
| CAPEX | €/t annual capacity PP | 4,011.55 | 4,011.55 |
| Raw material requirement PCW | t PCW/t PP | 1.80 | 1.80 |
| Natural gas energy demand | MWh/t PP | 5.81 | 0.00 |
| Electric energy demand | MWh/t PP | 1.11 | 6.92 |
| Hydrogen demand | kg H2/t PP | 10.81 | 10.81 |
| Direct CO2 emissions | t CO2/t PP | 2.91 | 1.19 |
| Additional OPEX | €/t PP | 177.85 | 177.85 |
The aggregated direct process emissions of 2.91 t CO2/t PP for the pyrolysis route with a conventional steam cracker are in line with the 2.91 t CO2-eq/t recyclate output reported by Möck et al. (2022) for chemical recycling. The literature value represents an average of two chemical-recycling LCAs and does not have an identical process-chain definition. It is therefore used as an order-of-magnitude plausibility check rather than as a formal validation.
The results of all other process chains were calculated in a similar manner. A complete process-step inventory and the resulting aggregated pathway values are provided in the Supporting Information.
Scenarios and sensitivities
The model combines exogenous price trajectories from two sources. Industrial electricity, natural gas, and hydrogen prices are taken from the German Treibhausgas-Projektionen 2026, while the low and high EU ETS carbon-price trajectories follow the Ariadne ExPol and KN2045_Mix variants, respectively (Luderer et al., 2021; Wehnemann et al., 2026). These combinations are not treated as internally coupled energy-system scenarios. They are used to examine the effect of alternative carbon-price trajectories while holding the selected industrial energy-price trajectory constant; feedback effects between carbon prices, energy prices, and technology deployment are not modelled. Figure 4 shows the price trajectories.
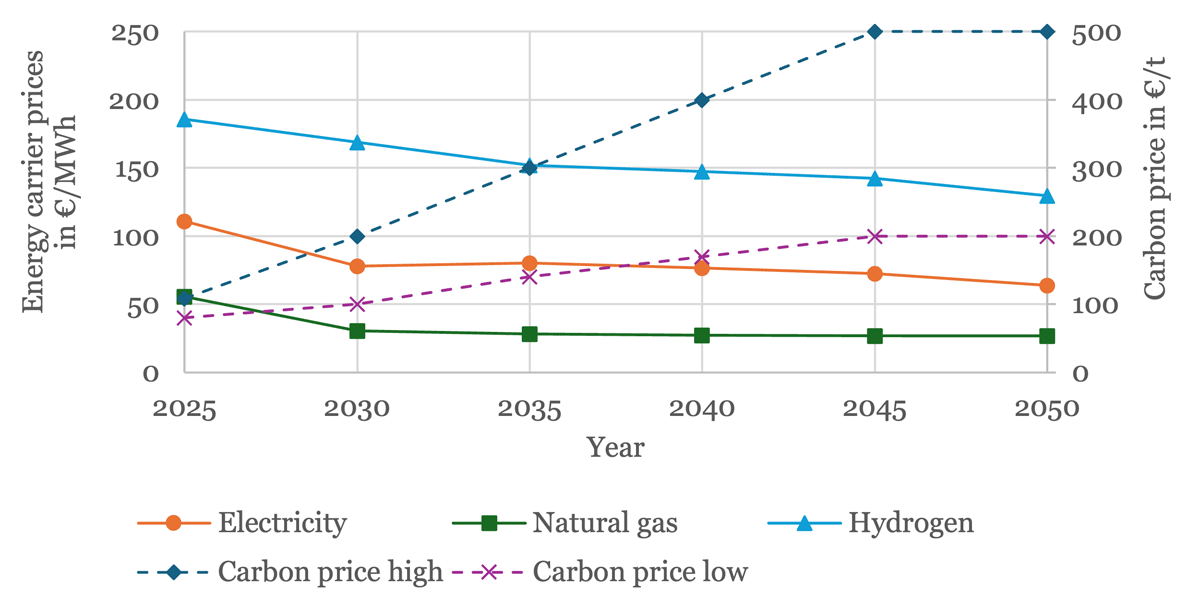
Figure 4
Price trajectories for CO2 and energy carriers.
Table 7 summarises the price inputs used in the model. The prices of electricity, natural gas, hydrogen, and CO2 vary over time. Material-feedstock prices remain constant because consistent pathway-specific long-term trajectories were not available. The naphtha value of €600/t is retained as a rounded and deliberately conservative market proxy; BASF reported an average naphtha price of US$567/t for 2025 (BASF, 2026). The common processed-PCW price of €125/t is applied to all recycling routes. This preserves comparability but does not represent differences in waste quality or pre-treatment requirements; the limitation is discussed below (Cimpan et al., 2016; Garcia-Gutierrez et al., 2023).
Table 7
Energy, carbon, and material-feedstock price assumptions used in the model.Note: Hydrogen prices in €/MWh are expressed on a lower-heating-value basis of 33.3 kWh/kg.
| INPUT | UNIT | 2025/2035/2045 | SOURCE OR MODEL SCENARIO |
|---|---|---|---|
| Electricity | €/MWh | 110.8/80.2/69.8 | Treibhausgas-Projektionen 2026 |
| Natural gas | €/MWh | 55.73/28.22/26.99 | Treibhausgas-Projektionen 2026 |
| Hydrogen | €/MWh | 185.98/152.01/133.24 | Treibhausgas-Projektionen 2026 |
| €/kg | 6.19/5.06/4.44 | ||
| CO2 price, high | €/t CO2 | 108.84/300/500 | Ariadne KN2045_Mix |
| CO2 price, low | €/t CO2 | 80.27/140/200 | Ariadne ExPol |
| Naphtha | €/t | 600/600/600 | US$567/t average in 2025 (BASF, 2026), rounded |
| Processed PCW | €/t | 125/125/125 | Author assumption for processed PCW delivered to recycling; collection, sorting, and washing costs embodied in price based on (Cimpan et al., 2016; Garcia-Gutierrez et al., 2023) |
| Dry biomass | €/t (dry) | 71.2/71.2/71.2 | (Haro et al., 2013) |
| Renewable naphtha | €/t | 1,350/1,350/1,350 | market-based and rounded baseline value (S&P Global Commodity Insights, 2025) |
| Renewable propane | €/t | 1,200/1,200/1,200 | market-based and rounded baseline value (S&P Global Commodity Insights, 2025) |
Renewable naphtha and renewable propane are represented as purchased feedstocks at €1,350/t and €1,200/t, respectively. These prices are based on S&P Global Commodity Insights (2025) and are held constant in the baseline. Collection, sorting, and washing are not represented as separate unit processes for mechanical recycling. Processed PCW is defined as material delivered to the recycling process, and the associated upstream costs are assumed to be embodied in the €125/t input price.
A one-at-a-time price sensitivity analysis is conducted for electricity, natural gas, hydrogen, PCW, biomass, renewable naphtha, and renewable propane. Each price is varied separately by ±20% around its baseline while all other techno-economic parameters remain constant. The low and high CO2 trajectories are reported as alternative exogenous scenarios rather than as one-at-a-time sensitivities. Interaction effects are not captured.
Results
Overall cost comparison of production pathways
Figure 5 presents levelised production costs for 2025, 2035, and 2045 under the high carbon-price trajectory, which is used as the main-text case to illustrate the stronger carbon-price signal. The selected years represent the baseline, an intermediate transformation point, and the target year; annual results are provided in the Supporting Information. The low carbon-price case is also provided as a supplementary result. The figure retains all 14 configurations but groups them into fossil primary, recycling, power-to-X, and renewable feedstock pathways.
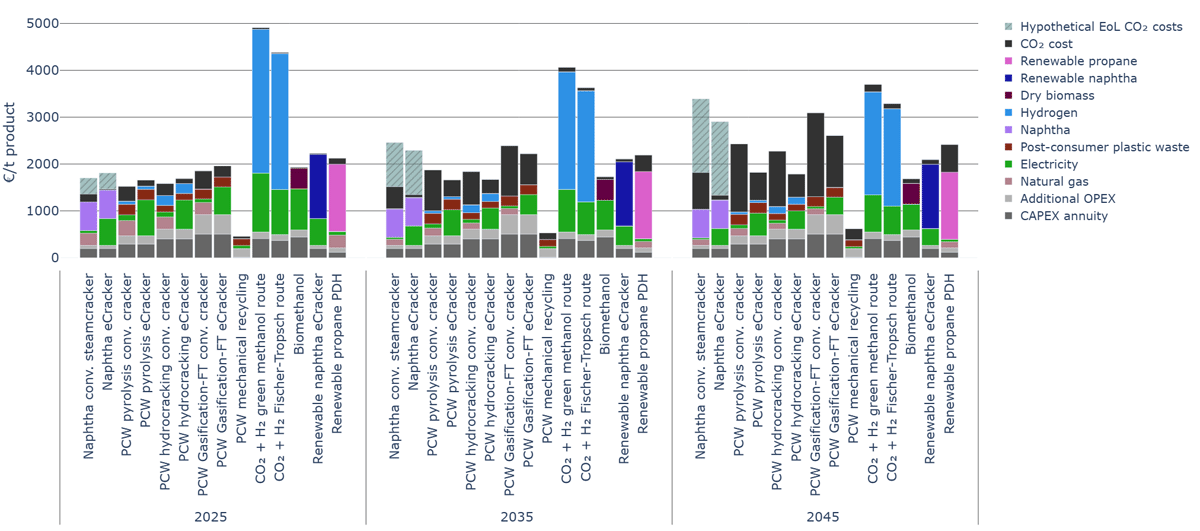
Figure 5
Levelised polypropylene production costs in 2025, 2035 and 2045 under the high carbon-price trajectory. Hypothetical fossil end-of-life CO2 costs are shown as a separate component.
For the two fossil primary routes, the stacked bars distinguish current regulatory costs from an additional hypothetical end-of-life component based on 3.14 t CO2 per tonne of PP. The grey hatched component is not currently charged to the producer and is therefore not included when the text refers to current regulatory cost. The analytical total including this component is used only to illustrate how product-level attribution of fossil end-of-life emissions would change the comparison. To avoid double counting, no new end-of-life charge is assigned to the recycling routes; the model does not track fossil carbon over multiple recycling cycles.
Mechanical recycling remains the least-cost pathway, with analytical costs of approximately €460/t PP in 2025 and €620/t PP in 2045 under the high carbon-price trajectory. The short process chain, low energy demand, and limited capital requirements dominate its cost structure.
The levelised cost of production for fossil naphtha-based PP is approximately €1,360/t PP for the conventional cracker and €1,467/t PP for the electric cracker in 2025. By 2045, the corresponding current regulatory costs are approximately €1,820/t and €1,334/t. Electrification lowers exposure to direct carbon costs at the expense of greater electricity dependence. When the separate hypothetical end-of-life component is added, the 2045 analytical totals rise to approximately €3,390/t and €2,904/t, respectively.
Chemical-recycling costs depend strongly on both conversion losses and the energy supply to downstream processing. In 2045, production costs for the electric-cracker variants of pyrolysis and hydrocracking are approximately €1,823/t and €1,788/t PP, whereas their conventionally heated counterparts reach approximately €2,431/t and €2,275/t because of higher direct emissions. Gasification–Fischer–Tropsch remains more costly because of its longer conversion chain.
The biomass-based and renewable-hydrocarbon routes remain less costly than the assessed CO2/H2 routes, although their cost trajectories differ. Production costs for biomethanol-to-propylene decline from approximately €1,933/t PP in 2025 to €1,729/t in 2035 and €1,687/t in 2045 as electricity prices fall. Production costs for renewable naphtha with electric steam cracking similarly decline from approximately €2,228/t to €2,109/t and €2,095/t. Production costs for renewable propane via conventional PDH increase from approximately €2,124/t in 2025 to €2,193/t in 2035 and €2,416/t in 2045 because its residual natural-gas use and direct process emissions increase its exposure to the high carbon-price trajectory.
The two CO2/H2-based primary routes have the highest costs throughout the period, although declining electricity and hydrogen prices reduce their analytical totals from approximately €4,384–4,911/t in 2025 to €3,289–3,700/t in 2045. The low carbon-price trajectory reduces costs most strongly for emissions-intensive fossil and chemical-recycling configurations but does not change the finding that mechanical recycling is the lowest-cost route, and the PtX routes are the highest-cost routes under the selected assumptions.
The comparison therefore depends on the carbon-accounting boundary. Electrified fossil production remains cost-competitive on a current regulatory basis because it reduces direct emissions while retaining fossil carbon in the product. Adding the hypothetical end-of-life component substantially changes its apparent long-term position, but this is an analytical construct rather than a representation of current regulation.
Pathway emissions
Table 8 reports the aggregated direct process emissions used in the cost model and the separately attributed hypothetical end-of-life emissions.
Table 8
Aggregated direct process emissions and separately attributed hypothetical fossil end-of-life emissions (t CO2/t PP).
| NUMBER | PATHWAY | DIRECT PROCESS | HYPOTHETICAL EoL | TOTAL INCL. EoL |
|---|---|---|---|---|
| 1 | Fossil naphtha conv. | 1.57 | 3.14 | 4.71 |
| 2 | Fossil naphtha electric | 0.20 | 3.14 | 3.34 |
| 3 | PCW pyrolysis conv. | 2.91 | 0.00 | 2.91 |
| 4 | PCW pyrolysis electric | 1.19 | 0.00 | 1.19 |
| 5 | PCW hydrocr. conv. | 2.36 | 0.00 | 2.36 |
| 6 | PCW hydrocr. electric | 0.99 | 0.00 | 0.99 |
| 7 | PCW gasif.–FT conv. | 3.58 | 0.00 | 3.58 |
| 8 | PCW gasif.–FT electric | 2.21 | 0.00 | 2.21 |
| 9 | PCW mechanical recycling | 0.47 | 0.00 | 0.47 |
| 10 | CO2/H2 methanol to propylene | 0.32 | 0.00 | 0.32 |
| 11 | CO2/H2 FT electric | 0.22 | 0.00 | 0.22 |
| 12 | Biomass methanol to propylene | 0.20 | 0.00 | 0.20 |
| 13 | Renewable naphtha, electric cracker | 0.20 | 0.00 | 0.20 |
| 14 | Renewable propane, conventional PDH | 1.18 | 0.00 | 1.18 |
Electrification reduces direct emissions for all cracker-based configurations, while the product-level fossil carbon term remains unchanged for the fossil-naphtha routes. No hypothetical fossil end-of-life term is assigned to the renewable-feedstock routes. The methodological scope of these emission indicators is defined in the Methods section.
Sensitivity and key cost drivers
Table 9 reports the full change in 2045 production cost between the –20% and +20% price cases for energy, PCW, and renewable feedstocks, and between the low and high CO2 trajectories. For the two fossil-naphtha pathways, the CO2 range includes both direct process emissions and the separately reported hypothetical end-of-life component; for all other pathways, it reflects direct process emissions only. Carbon-price exposure is largest for conventionally heated fossil and chemical-recycling routes. Electricity is a material cost driver for electric steam-cracker variants and the PtX pathways, while hydrogen is the dominant tested price driver for the two CO2/H2 routes.
Table 9
Full range of 2045 production costs between the –20% and +20% price cases and between the low and high CO2 trajectories (€/t PP).
| NO. | PATHWAY | ELECTRICITY | NATURAL GAS | H2 | PCW | RENEW. FEEDSTOCK | CO2 |
|---|---|---|---|---|---|---|---|
| 1 | Fossil naphtha, conventional | 14 | 50 | – | – | – | 1,413 |
| 2 | Fossil naphtha, electric | 144 | – | – | – | – | 1,002 |
| 3 | Pyrolysis, conventional | 31 | 63 | 19 | 90 | – | 872 |
| 4 | Pyrolysis, electric | 193 | – | 19 | 90 | – | 358 |
| 5 | Hydrocracking, conventional | 27 | 50 | 60 | 56 | – | 708 |
| 6 | Hydrocracking, electric | 157 | – | 60 | 56 | – | 297 |
| 7 | Gasification–FT, conventional | 19 | 50 | – | 84 | – | 1,074 |
| 8 | Gasification–FT, electric | 149 | – | – | 84 | – | 663 |
| 9 | Mechanical recycling | 16 | – | – | 59 | – | 141 |
| 10 | CO2/H2 methanol route | 317 | – | 880 | – | – | 96 |
| 11 | CO2/H2 FT route | 242 | – | 832 | – | – | 65 |
| 12 | Biomethanol route | 221 | – | – | – | 177 (dry biomass) | 60 |
| 13 | Renewable naphtha, electric cracker | 144 | – | – | – | 548 (renew. naphtha) | 60 |
| 14 | Renewable propane, conventional PDH | 20 | 53 | – | – | 573 (renew. propane) | 354 |
Mechanical recycling has comparatively low energy-price sensitivity. This does not extend to chemical-recycling configurations with electric steam cracking, for which the electricity-price range reaches approximately €149–193/t PP. For the renewable-carbon routes, the full feedstock-price ranges are approximately €177/t PP for dry biomass in the biomethanol route, €548/t PP for renewable naphtha, and €573/t PP for renewable propane. The renewable-naphtha route also has an electricity-price range of approximately €144/t PP, while the PDH route has natural-gas and CO2 ranges of approximately €53/t and €354/t PP, respectively.
Discussion
The cost comparison shows that pathway architecture is a major determinant of polypropylene production costs. Short process chains with high material yields tend to be less costly, whereas multi-stage routes accumulate conversion losses, capital requirements, and energy demand. More fundamentally, the ranking reflects how much of the existing molecular structure and previously invested processing effort is retained. Mechanical recycling largely preserves the polymer, whereas chemical recycling decomposes it and primary routes build the polypropylene value chain from less processed carbon carriers. The more molecular structure must be (re)built, the more conversion stages, losses, and energy inputs are generally required. The pathways should therefore not be regarded simply as competing alternatives for the same material flow. They differ in feedstock requirements, achievable product quality, and their function within a circular polymer system.
Mechanical recycling is the least-cost route in all reported cases and has comparatively low direct process emissions. It illustrates how lower modelled process emissions can coincide with production-cost savings relative to conventional fossil primary production, provided that the recyclate meets the requirements of the intended application. Its practical contribution is constrained by contamination, polymer degradation, additives, fillers, and downstream product specifications (Jin et al., 2012; Schyns and Shaver, 2021). An estimated 7.5 Mt of polypropylene waste was generated in the EU-27 in 2022. Estimated quantities of polypropylene recyclate produced, waste incinerated, and waste landfilled were 1.4, 4.4, and 2.0 Mt, respectively (Amadei et al., 2025). These reported quantities indicate substantial additional material potential, but the incinerated and landfilled quantities are not a homogeneous pool that can be transferred directly into mechanical recycling.
Significant losses occur during collection, sorting, and reprocessing, with comparatively low recovery reported for polypropylene; improvements are required in collection systems, product design, plant performance, and markets for lower-value fractions (Antonopoulos et al., 2021). European mechanical-recycling capacity has been reported as sufficient to process the plastic waste currently sent for recycling. However, large quantities of plastic waste are not separately collected or directed to recycling. Only about 65% of the material entering recycling facilities becomes recyclate (European Environment Agency, 2024). Taken together, these findings indicate that the expansion of mechanical recycling depends not only on additional processing capacity, but also on increasing the quantity and quality of material reaching recycling facilities and on creating applications for the resulting recyclate. Quality further limits the extent to which recyclate can replace primary polypropylene in specific applications. Sorting has been shown to affect recyclate consistency (Mager et al., 2026). The economic advantage identified in the mass-based comparison can therefore be realised most directly where recyclate of sufficient and consistent quality can substitute primary polypropylene.
Chemical-recycling routes require more conversion steps and are therefore more energy- and capital-intensive. In contrast to mechanical recycling, they relinquish much of the molecular structure and processing value already embodied in the polymer and subsequently rebuild chemical intermediates from the resulting products. Their cost disadvantage is therefore linked to their fundamental pathway architecture rather than solely to the performance of an individual process step. They can nevertheless complement mechanical recycling for suitable waste fractions that cannot meet its technical or quality requirements. Their system function is consequently not to compete with mechanical recycling for readily recyclable material, but to recover carbon from fractions that would otherwise require other treatment while providing feedstocks suitable for producing virgin-grade polymers. Their performance depends on feedstock specifications, conversion yields, upgrading requirements, and integration into the existing chemical-industry infrastructure (Biessey et al., 2023; Garcia-Gutierrez et al., 2023).
The renewable-carbon primary routes show two distinct patterns. The CO2/H2-based routes remain the most expensive pathways because their process chains combine substantial electricity demand with high hydrogen requirements. This common cost penalty arises primarily in the upstream construction of the carbon carrier. Both routes start from fully oxidised CO2 and require hydrogen to produce energy-rich methanol or hydrocarbon intermediates before propylene production can begin. The dominant hydrogen-price sensitivity therefore indicates a structural cost driver shared by the two route architectures. Reductions in individual downstream capital or operating costs alone are unlikely to eliminate this disadvantage.
Biogenic feedstocks offer economically promising sources of renewable primary carbon, especially compared with the assessed CO2/H2 routes. Biomethanol-to-propylene provides a direct feedstock comparison with the corresponding power-to-X methanol route. Because the subsequent methanol-to-propylene and polymerisation steps are common to both routes, their cost difference is generated largely upstream of propylene production. Biomass supplies reduced biogenic carbon, whereas the power-to-X route must provide the energy required to reduce CO2 through electrolytic hydrogen. The comparison thus demonstrates that the origin and energetic state of the carbon feedstock can be more important for production costs than the subsequent conversion of methanol into polypropylene.
The renewable-naphtha and renewable-propane routes use established electric steam-cracking and PDH process inventories with renewable feedstocks. These routes introduce renewable carbon at a later stage of the value chain and avoid several of the conversion steps required by the integrated biomass and CO2/H2 pathways. Much of the upstream production effort is consequently embodied in the purchased feedstock price rather than incurred within the modelled polypropylene-production chain. Their competitiveness is therefore determined less by a fundamentally new conversion process than by the price at which renewable drop-in feedstocks can be supplied. This interpretation is consistent with the strong sensitivity of the respective routes to renewable-naphtha and renewable-propane prices. The comparison consequently distinguishes two economic strategies for renewable primary production: integrated conversion of biomass or CO2 into chemical intermediates and the later substitution of fossil feedstocks by purchased renewable hydrocarbons. Feedstock availability, certification, competing uses, and upstream environmental performance remain decisive for the deployment of the latter strategy.
Electrification of steam cracking illustrates the difference between energy decarbonisation and feedstock defossilisation. Replacing fossil-fired process heat with electricity lowers direct emissions and exposure to installation-level carbon pricing, but it does not change the fossil origin of the carbon embedded in polypropylene. Electrified fossil production therefore remains comparatively attractive under current regulatory accounting. This creates a structural challenge for renewable-carbon routes: they incur the cost of replacing fossil feedstock carbon, whereas electrified fossil production can reduce its principal process emissions without bearing the cost associated with the subsequent release of embedded fossil carbon. The separate hypothetical end-of-life component demonstrates how product-level attribution of fossil carbon would change this comparison, while remaining distinct from costs currently borne by producers.
The cost advantage of mechanical recycling supports prioritising separate collection, sorting into consistent polymer fractions, and product design that facilitates recycling. These measures address the quantity and quality constraints identified above. Recycled-content requirements can complement them by supporting demand for secondary polymers. Regulation (EU) 2025/40 (European Parliament and Council, 2025) provides a concrete example for packaging applications. For chemical recycling, improvements in conversion yields, feedstock selection, and integration with existing chemical production are more directly relevant than measures aimed at mechanically recyclable material. Product-level fossil-carbon accounting or end-of-life pricing could address the release of fossil product carbon. Such measures would target a different cost asymmetry from those addressed by support for recycling or low-carbon process energy. For electric and power-to-X pathways, access to sufficiently low-carbon electricity and hydrogen remains an important condition for both economic and environmental performance.
For biomass, the results support prioritising material use over direct energy use where feedstocks are sustainably available and technically suitable. This material use should be followed by reuse and recycling wherever feasible. Energy and raw-material strategies should explicitly account for the carbon demand of chemical production, and support schemes should avoid diverting suitable biomass from material applications towards direct combustion. EU renewable-energy legislation already provides a basis through the cascading-use principle, particularly its provisions on support schemes and the priority order for woody biomass, while allowing specified derogations (European Parliament and Council, 2023; Justen et al., 2026). The recommendation is therefore to implement and strengthen material-use prioritisation; the optimal allocation of biomass across all competing applications is outside the scope of this study.
The sensitivity analysis confirms these distinct economic regimes. Carbon-price variation has the largest tested effect on conventionally heated fossil and chemical-recycling routes; electricity is particularly important for electric-cracker and PtX configurations; and hydrogen dominates the price exposure of the two CO2/H2-based primary routes. PCW prices affect all recycling routes, while prices for dry biomass, renewable naphtha, and renewable propane materially influence their respective renewable-carbon routes. Consequently, there is no common cost-reduction lever across all pathway classes. Carbon pricing primarily changes the position of routes with substantial direct emissions, whereas closing the cost gap for CO2/H2-based production requires reductions in electricity and hydrogen costs and greater recognition of the fossil carbon embedded in products.
The high costs of the assessed CO2/H2 routes also warrant scrutiny of the hydrogen demand attributed to domestic polypropylene production in infrastructure planning. In the July 2024 application for Germany’s hydrogen core network, the chemical sector accounts for 32 TWh of the 278 TWh of annual withdrawals assumed for 2032 on a higher-heating-value basis, equivalent to approximately 11.5% (FNB Gas e. V., 2024). Lower-than-planned hydrogen demand from these polypropylene routes could reduce network utilisation, but would not, by itself, demonstrate that the entire network is uneconomic.
Conclusion
This study compares 14 fossil-carbon, renewable-carbon, and recycling-based polypropylene configurations under German industrial price assumptions and European carbon-price trajectories. Across these configurations, production costs generally increase with the extent to which molecular structures must be broken down and rebuilt, reflecting differences in processing effort, conversion losses, and energy requirements. Mechanical recycling has the lowest costs and comparatively low direct process emissions. Where recyclate meets the requirements for replacing primary polypropylene, it can reduce process emissions while lowering production costs relative to conventional fossil primary production. Chemical recycling occupies an intermediate cost range and can complement mechanical recycling by recovering carbon from suitable waste fractions that do not meet its requirements. Electrification of downstream steam cracking reduces direct emissions and carbon-price exposure. The two CO2/H2-based primary routes remain the most costly because of the electricity and hydrogen required to produce energy-rich carbon carriers from fully oxidised CO2.
Biogenic feedstocks are economically promising sources of renewable primary carbon, particularly compared with the assessed CO2/H2 routes. Renewable naphtha and renewable propane remain more expensive than the fossil-naphtha routes under the selected baseline assumptions, whereas biomethanol-to-propylene approaches the fossil cost range as electricity prices decline. The sensitivity analysis identifies renewable-naphtha and renewable-propane prices as major cost drivers. Deployment also depends on sustainable supply, certification, competing uses, and upstream life-cycle performance, which are not quantified in this study.
Fossil primary production remains competitive on a current regulatory cost basis, particularly when steam-cracker heat is electrified. However, electrification reduces process emissions without replacing fossil carbon in the product. The separate hypothetical end-of-life component illustrates how attributing emissions from this carbon to the product would change the cost comparison. It therefore highlights the distinction between decarbonising process energy and replacing fossil feedstocks, and the potential role of product-level carbon pricing in recognising that distinction.
Industrial transformation and infrastructure planning should explicitly consider the cost advantages of recycling and biogenic carbon. Priorities are improved collection and sorting, recycling-oriented product design, and material use of sustainably available, suitable biomass before direct energy use. Hydrogen-demand assumptions for polypropylene should be tested against these alternatives and their supply constraints. PtX may still be required for residual demand.
Future research should distinguish current first-of-a-kind costs from mature-plant estimates, develop dynamic and quality-specific feedstock-price scenarios, assess carbon flows over multiple recycling cycles, and determine system-optimal combinations of mechanical recycling, chemical recycling, and renewable primary production. Particular priorities are transparent market-price and life-cycle inventories for renewable naphtha and propane, application-specific substitution of recycled polypropylene, and system-integration analysis of the availability, cost, and life-cycle emissions of electricity and hydrogen.
Additional Files
The additional files for this article can be found as follows:
Supporting Information Overview
Process-step inventories, allocation and aggregation calculations, pathway inputs, price assumptions, model results and sensitivity analyses. DOI: https://doi.org/10.66506/ed.14.s1
Supporting Information Data
Machine-readable datasets underlying the process inventories, pathway aggregation, price scenarios, annual results and sensitivity analyses. DOI: https://doi.org/10.66506/ed.14.s2
Data Accessibility Statement
The modified CaCoCa model code is available via GitHub and is archived on Zenodo (DOI: https://doi.org/10.5281/zenodo.18694649). The archive contains the pathway inputs, high- and low-carbon-price outputs, the ±20% one-at-a-time sensitivity results, pathway-level emissions data, and the scripts required to reproduce the CaCoCa calculations.
The accompanying Supporting Information provides the individual process-step assumptions, allocation and aggregation calculations, pathway-level inputs, annual results, and a data dictionary. The curated process-step and aggregation tables provide the information required to reconstruct the pathway aggregation.
Use of generative AI tools
OpenAI ChatGPT was used during manuscript preparation and revision as an assistive tool for language editing and restructuring, consolidation of responses to reviewers, consistency checking across the manuscript, model outputs and Supporting Information, and assistance with code-related consistency checks and machine-readable documentation.
No AI-generated figures or images are included in the manuscript. All data sources were selected by the author, and all assumptions, methodological decisions and interpretations were made by the author. The final model inputs and calculations were reviewed, rerun and verified by the author, who also checked the references and numerical results and takes full responsibility for the content of the manuscript.
Author Contributions
The author is solely responsible for conceptualisation, methodology, data analysis, and writing.