
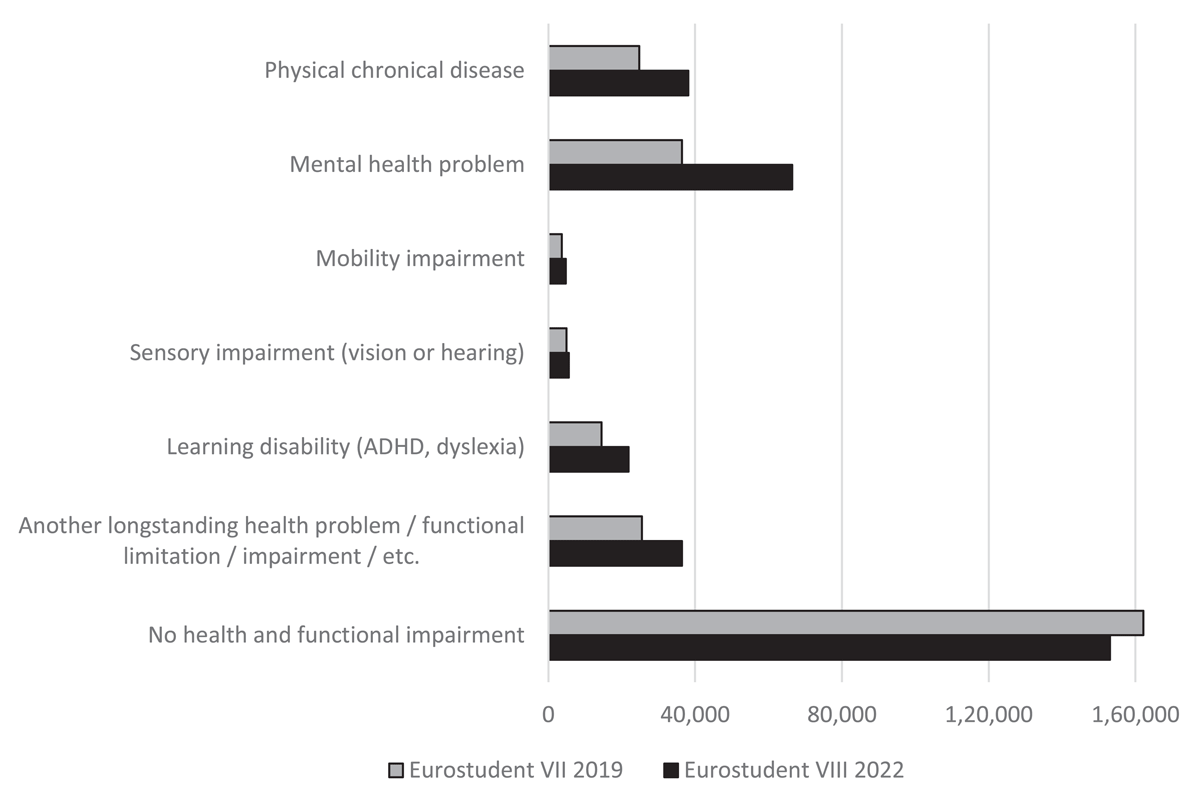
Figure 1
Health and functional impairments reported by students and estimated population size in EUROSTUDENT surveys in Finland in 2019 and 2022.
Table 1
Descriptive sample statistics (n = 6,839).
| VARIABLE | % |
|---|---|
| Type of HEI | |
| University | 47.6 |
| University of Applied Sciences | 52.4 |
| Age | |
| under 21 | 12.3 |
| 22–25 | 26.9 |
| 26–29 | 26.9 |
| 30–39 | 19.6 |
| over 40 | 14.4 |
| Enrolled at HEI | |
| before COVID-19 outbreak | 55.9 |
| after COVID-19 outbreak | 43.9 |
| Field of education (ISCED-10) | |
| Education | 5.5 |
| Humanities and arts | 14.4 |
| Social sciences, journalism, and information | 6.1 |
| Business, administration, and law | 13.5 |
| Natural sciences, mathematics, and statistics | 4.5 |
| Information and Communication Technologies | 8.3 |
| Engineering, manufacturing, and construction | 14.5 |
| Agriculture, forestry, fisheries, and veterinary | 10.1 |
| Health and welfare | 17.3 |
| Services | 5.9 |
| Health and functional impairment | |
| Yes | 46.6 |
| No | 53.4 |
| Type of health and functional impairment | |
| Physical chronic disease | 13.3 |
| Mental health problem | 23.1 |
| Mobility impairment | 1.7 |
| Sensory impairment (vision or hearing) | 2.0 |
| Learning disability (ADHD, dyslexia) | 7.6 |
| Another longstanding health problem/functional limitation/impairment/etc. | 12.7 |
| Parent of a child younger than 18 years old | |
| Yes | 18.4 |
| No | 81.6 |
Table 2
Groups of explanatory background variables.
| GROUP NAME | VARIABLES |
|---|---|
| Digitalization of teaching, learning, and student life | Importance of computers, digital devices, and tools in studies Importance of computers, digital devices, and tools in everyday life Sufficiency of professional digital skills in studies Desire for in-person or online teaching and learning Satisfaction with the digital availability of administrative services Satisfaction with the digital availability of counselling services Satisfaction with the digital availability of online exams Satisfaction with the digital availability of recorded courses/lectures Satisfaction with the digital availability of required study materials Weekly personal study time (e.g., preparation, studying, and homework) Weekly time on taught studies (lessons, seminars, labs, tests, live online courses of study program, etc.) |
| External factors | Balancing studies with other responsibilities Financing living expenses Employment/paid work situation Financing studies |
| Demographic factors | Age Field of study Type of HEI Enrolled as a student in higher education before/after pandemic Health and functional impairment Child under 18 years of age |
Table 3
Research questions and methods used.
| RESEARCH QUESTION | VARIABLES | METHOD | RESULTS |
|---|---|---|---|
| RQ1: How students perceived the digitalization of studies during the pandemic? | Study variables
| Hierarchical cluster analysis | Clusters A, B, and C |
| RQ2: What characterizes the positive and negative perceptions on digitalization of studies? RQ3: How perceptions of students with health and functional impairments differ from other students? | Background variables, i.e., selected variables of following groups:
| Binary logistic regression (method: enter) | Significant predictors for clusters A and C |
| Significant predictors of the background variables | Binary logistic regression (method: forward stepwise) | Final results for clusters A and C |
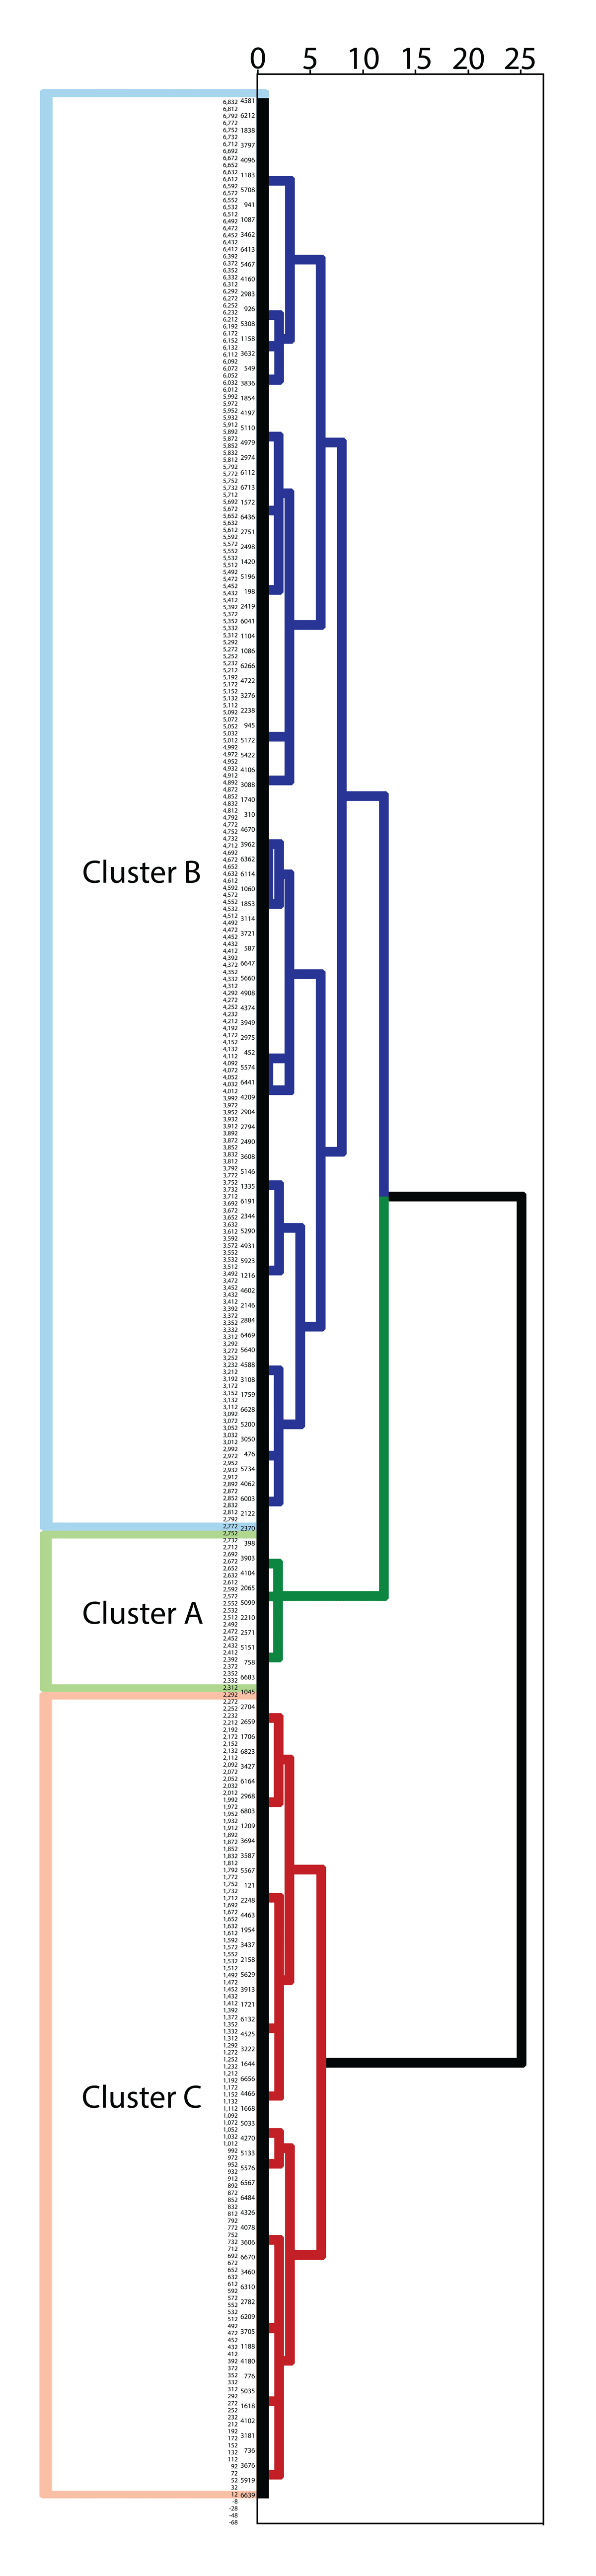
Figure 2
Dendrogram of the clusters.
Table 4
Variables associated with profile memberships.
| POSITIVE EFFECT ON STUDIES (A) | GENERAL (CLOSE TO AVERAGE) EFFECT ON STUDIES (B) | NEGATIVE EFFECT ON STUDIES (C) | TOTAL | |
|---|---|---|---|---|
| Study duration* | 4.6 | 3 | 2.1 | 2.9 |
| Academic achievement* | 4.8 | 3.2 | 2 | 2.9 |
| Study motivation* | 4.6 | 2.7 | 1.6 | 2.5 |
| Teaching quality* | 3.8 | 2.6 | 1.7 | 2.4 |
| Contacts with fellow students* | 2.8 | 2 | 1.4 | 1.8 |
| n | 448 | 4,259 | 2,132 | 6,839 |
| % of n | 6.6% | 62.3% | 31.2% | 100.0% |
| Population estimate | 19,000 | 180,000 | 90,000 | 289,000 |
| % of total population | 6.6% | 62.3% | 31.1% | 100.0% |
[i] *Average population means of the profiles.
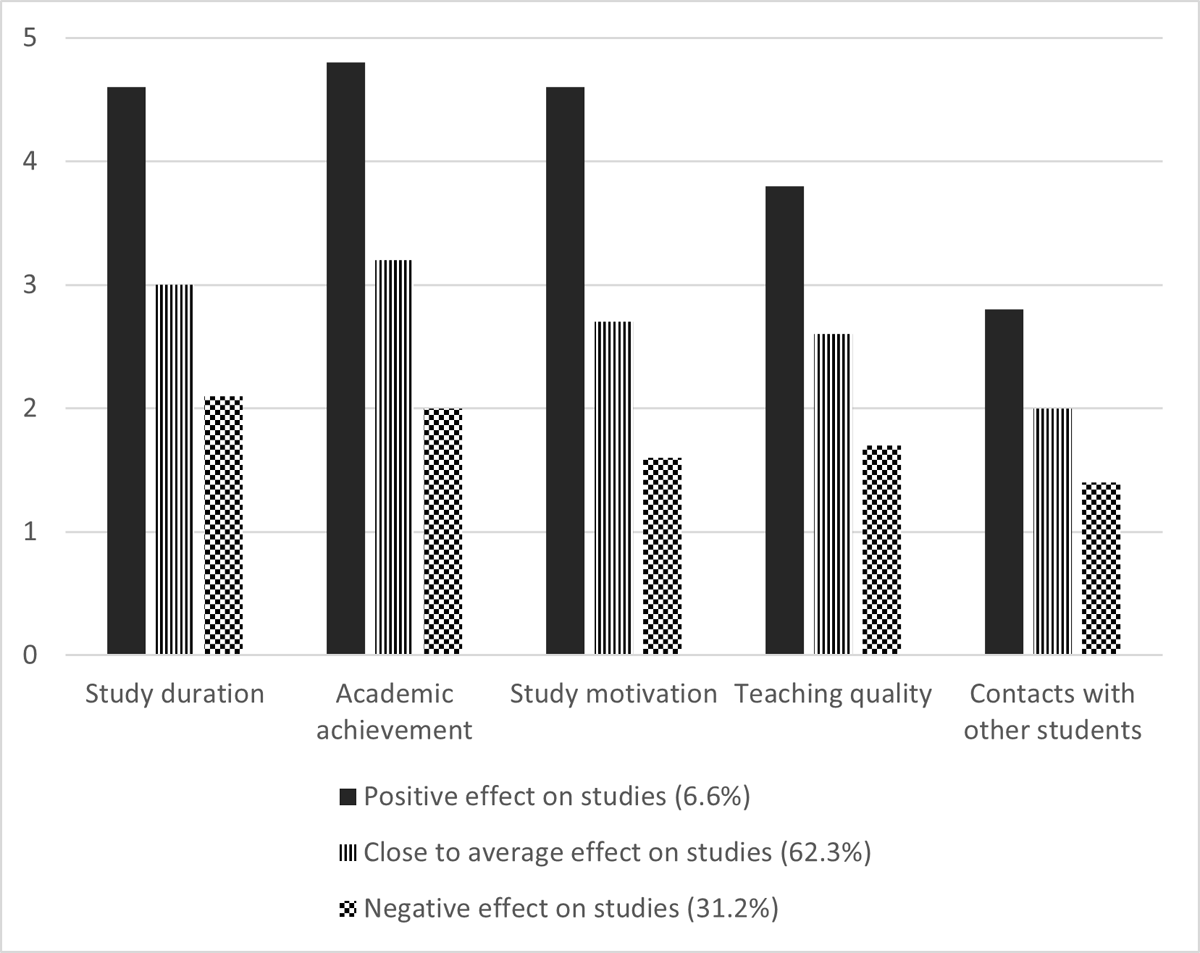
Figure 3
Profile differences in students’ perceptions on effects of the COVID-10 pandemic on study duration, academic achievement, study motivation, quality of teaching, and contacts with other students.
Table 5
Results of forward stepwise binary logistic regression of the profile Positive effect on studies.
| FACTOR STEP 12 R2 (NAGELKERKE) = 0.214 (N = 4,250) | REGRESSION COEFFICIENT B | SE | ODDS RATIO (OR) | 1/OR |
|---|---|---|---|---|
| Desire for online teaching and learning | –1.42*** | 0.14 | 0.24 | 4.15 |
| Balancing studies with other responsibilities | 1.65*** | 0.19 | 5.19 | 0.19 |
| Satisfaction with digital availability of counselling services | 0.50*** | 0.12 | 1.64 | 0.61 |
| Experiencing professional digital skills sufficient compared to what is required in studies | –0.78*** | 0.13 | 0.46 | 2.18 |
| Using 0–10 hours per week on personal study timea | –0.89*** | 0.14 | 0.41 | 2.44 |
| Using 11–20 hours per week on personal study timea | –0.72*** | 0.13 | 0.49 | 2.05 |
| Financing living expanses | 0.70*** | 0.18 | 2.01 | 0.50 |
| Satisfaction with digital availability of required study materials | 0.49*** | 0.13 | 1.64 | 0.61 |
| Satisfaction with digital availability of recorded courses/lectures | –0.29* | 0.12 | 0.75 | 1.34 |
| Age under 21 years | –0.63** | 0.23 | 0.53 | 1.88 |
| Studying education | –0.70* | 0.28 | 0.50 | 2.02 |
| Studying in a university | –0.23* | 0.12 | 0.80 | 1.26 |
[i] aPreparation, studying, and homework.
*p < 0.05; **p < 0.01; ***p < 0.001.
All variables used in the analysis were dichotomous. The variables are presented in descending order of importance, based on the sequence in which the variables were included in the forward stepwise binary logistic regression.
Table 6
Results of forward stepwise binary logistic regression of the profile Negative effect on studies.
| FACTOR STEP 17 R2 (NAGELKERKE) = 0.314 (N = 6,114) | REGRESSION COEFFICIENT B | SE | ODDS RATIO (OR) | 1/OR |
|---|---|---|---|---|
| Balancing studies with other responsibilities | –1.22*** | 0.07 | 0.30 | 3.38 |
| Desire for in-person teaching and learning | 1.00*** | 0.07 | 2.72 | 0.37 |
| Financing ones’ studies | –0.52*** | 0.08 | 0.59 | 1.68 |
| Satisfaction with digital availability of administrative services | 0.38*** | 0.07 | 1.47 | 0.68 |
| Satisfaction with digital availability of recorded courses/lectures | 0.24** | 0.07 | 1.27 | 0.78 |
| Studying in a UAS | 0.56*** | 0.07 | 1.75 | 0.57 |
| Enrolled as a student in higher education in the lecture period 2019/20 (i.e., last period before pandemic) | –0.42*** | 0.07 | 0.66 | 1.52 |
| Age over 40 years | –0.71*** | 0.11 | 0.49 | 2.04 |
| Mental health problem | 0.28*** | 0.07 | 1.32 | 0.76 |
| Learning disability (e.g., dyslexia) | 0.46*** | 0.11 | 1.58 | 0.00 |
| Studying business, administration, or law | –0.32*** | 0.09 | 0.73 | 1.38 |
| Finding computers, digital devices, and tools important in studies | –0.58** | 0.17 | 0.56 | 1.79 |
| Satisfaction with digital availability of online exams | 0.25*** | 0.07 | 1.28 | 0.78 |
| Satisfaction with digital availability of counselling services | 0.23** | 0.07 | 1.25 | 0.80 |
| Age 30–39 years | –0.28** | 0.09 | 0.75 | 1.33 |
| Experiencing professional digital skills sufficient compared to what is required in studies | –0.22** | 0.08 | 0.80 | 1.25 |
| Financing living expenses | –0.19* | 0.08 | 0.83 | 1.21 |
[i] *p < 0.05; **p < 0.01; ***p < 0.001.
All variables used in the analysis were dichotomous. The variables are presented in descending order of importance, based on the sequence in which the variables were included in the forward stepwise binary logistic regression.