
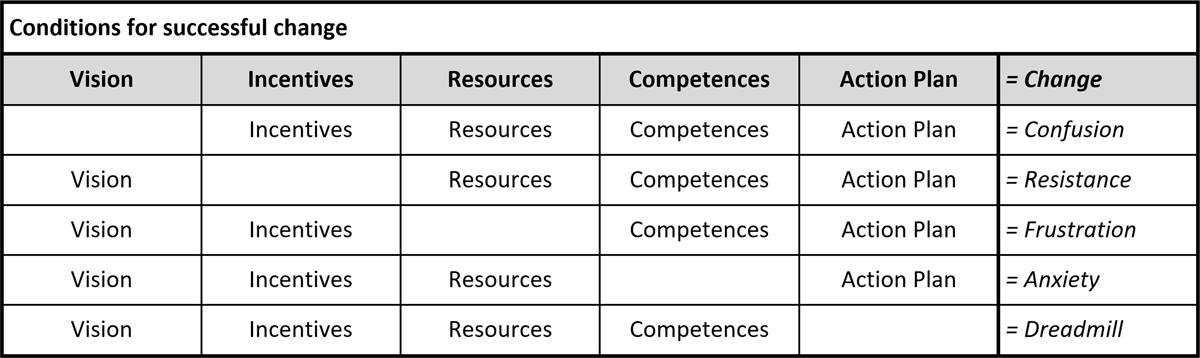
Figure 1
Dimensions of the Knoster educational change matrix.
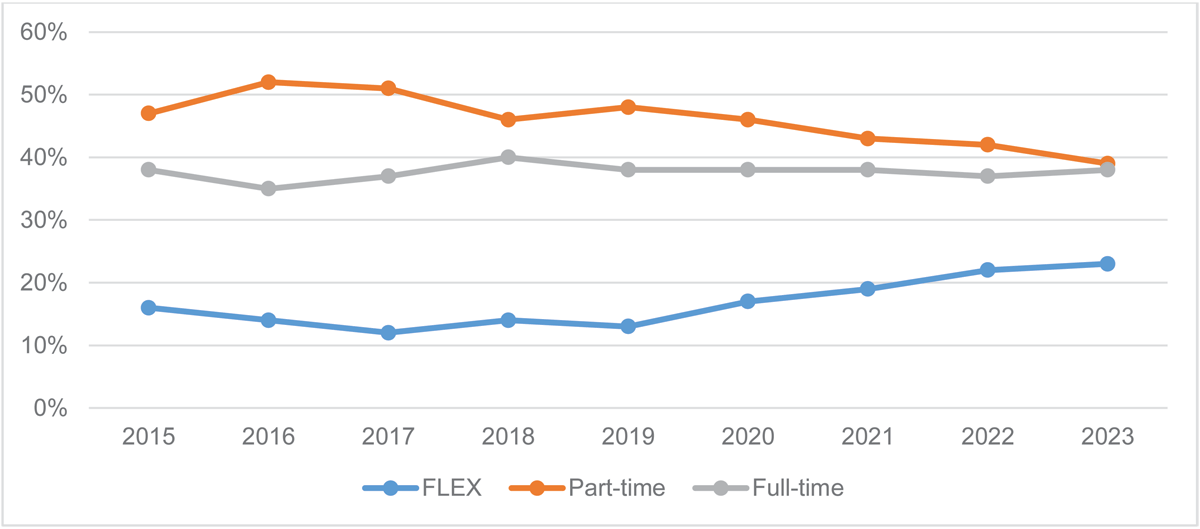
Figure 2
Proportion of students enrolled in formats full-time, part-time, and FLEX.
Table 1
Characteristics of qualitative data collection and analysis.
| STAKEHOLDERS | SOURCES | SEGMENTS (AGREEMENT/DISAGREEMENT) | AGREEMENT RATE | KAPPA |
|---|---|---|---|---|
| Students (N = 278) |
| 1,444 (1,226/218) | 84.90% | 0.84 |
| Lecturers (N = 35) |
| 540 (356/184) | 65.93% | 0.63 |
| Employers (N = 4) |
| 423 (326/97) | 77.07% | 0.75 |
| Total | 2,407 (1,908/499) | 79.26% | 0.78 |
Table 2
Results of the student evaluations of the FLEX format.
| TOTAL | ASSESSMENT LEVEL | MAIN STUDY LEVEL | t-TEST | |||||||
|---|---|---|---|---|---|---|---|---|---|---|
| N | MEAN | STD | N | MEAN | STD | N | MEAN | STD | ||
| Usability: The learning environment is technically easy to use. | 287 | 4.40 | 0.64 | 221 | 4.41 | 0.66 | 66 | 4.38 | 0.57 | t(285) = 0.37, p = .71 |
| Motivation: I found the studies motivating. | 287 | 4.00 | 0.82 | 221 | 4.05 | 0.78 | 66 | 3.80 | 0.91 | t(285) = 2.22, p = .03 |
| Learning Outcomes: I learn a lot in my studies. | 287 | 4.07 | 0.86 | 221 | 4.11 | 0.85 | 66 | 3.92 | 0.99 | t(285) = 1.49, p = .14 |
| Satisfaction: I like the study program. | 291 | 4.14 | 0.86 | 225 | 4.26 | 0.78 | 66 | 3.73 | 0.99 | t(289) = 4.54, p < .01 |
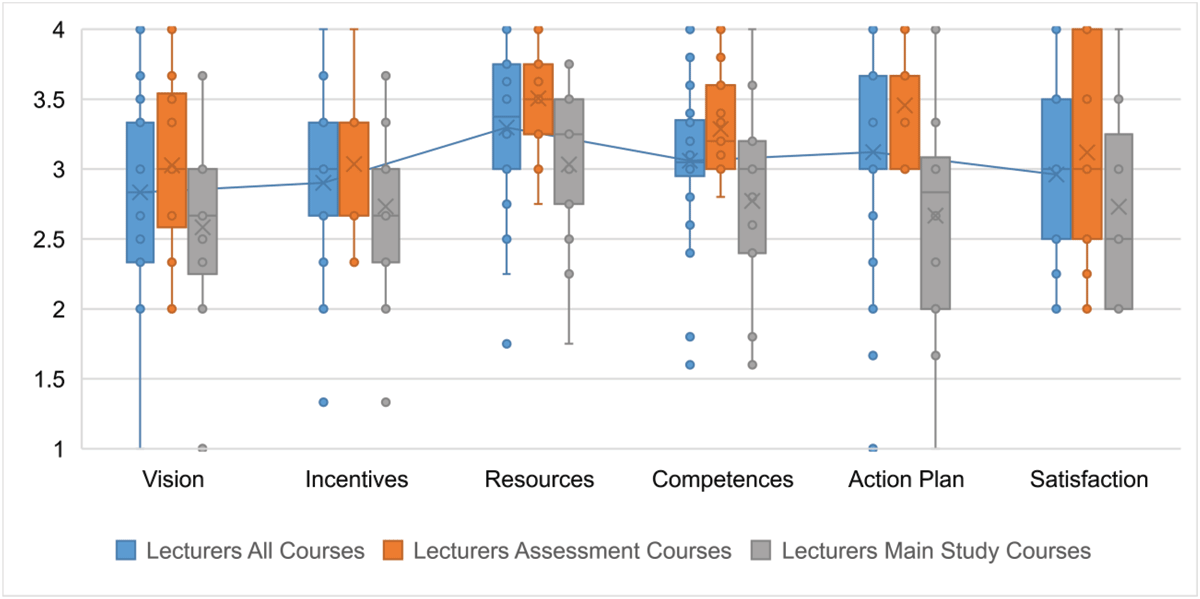
Figure 3
Lecturers’ perceptions of the educational change matrix dimension.