
Engaging in stories in the form of books, films, or TV series is a common leisure time activity for many children, adolescents, and adults. These stories typically include several fictitious or non-fictitious characters who interact with each other and who are situated in a web of more or less complex interpersonal relationships (Hogan, 2003). Apart from the actual plot (i.e., what is happening in a story), stories contain the inner workings of their characters such as their thoughts, beliefs, and feelings (Bruner, 1986). Given the social content of stories as well as the opportunity to infer mental states (i.e., thoughts, beliefs, emotions) of the characters, several theories assume that exposure to stories, which feature human interaction, thoughts, and feelings, as well as interpersonal relationships, might also train people’s real-world social cognitive abilities: for example, understanding others’ mental states (i.e., theory of mind) and their own ability to feel with others (i.e., empathy) (e.g., Hakemulder, 2000; Koopman & Hakemulder, 2015; Mar, 2018a; Oatley, 1999; for an overview, see Black et al., 2021). Although reading fictional stories has shown to result in better social-cognitive abilities in a recent meta-analysis of experimental studies (Dodell-Feder & Tamir, 2018), the research picture is decidedly mixed with some studies showing positive effects (e.g., Kidd & Castano, 2013) whereas others found no effects (e.g., Lenhart & Richter, 2022; Panero et al., 2016).
Although a steadily increasing number of studies have examined the effects of reading stories on social-cognitive abilities (e.g., Kidd & Castano, 2013, 2019; Panero et al., 2016; Samur et al., 2018), research is still needed to assess the durability of these effects as well as factors that might affect the magnitude of story effects (i.e., moderator effects; Dodell-Feder & Tamir, 2018). Narrative processes such as transportation into the story world or identification with story characters are promising avenues to pursue (Mar, 2018a, 2018b). Furthermore, only very few studies (Black & Barnes, 2015) have targeted the effects of audiovisual stories such as films and TV series on social-cognitive skills, which might be especially suited for learning how to decode subtle nonverbal social information because of their multisensory nature (Mar & Oatley, 2008). Two lab studies found that directly after watching either an excerpt or a full episode of a fictional TV series, participants’ theory-of-mind performance improved (Black & Barnes, 2015). Given these initial results, fictional TV series seem a promising avenue for future research.
Against this background, the present study pursued three goals. First, we examined whether watching several episodes of fictional TV series influenced social-cognitive abilities. Second, we examined whether any potential beneficial effects on social-cognitive abilities represented longer-lasting improvements. Third, we examined whether the effects of audiovisual stories depended on the recipients’ narrative transportation into the story and their identification with its characters.
Effects of Stories on Social-Cognitive Abilities
Several theories propose that engaging in stories has beneficial effects on their recipients’ social-cognitive abilities (e.g., Hakemulder, 2000; Koopman & Hakemulder, 2015; Mar, 2018a; Oatley, 1999). The common core of these theories is the assumption that stories provide social information or stimulate their recipients to engage in social processes that are useful for social interactions in the real world. Some theories assume that story readers (or listeners or watchers) simulate characters’ cognitions and emotions continuously during story engagement (Mar, 2018a; Oatley, 1999). Other theories emphasize that stories present many situations from different points of view, providing divergent information in knowledge, beliefs, and preferences. Encountering these salient divergences throughout the story helps to improve perspective taking and emotion understanding (Mumper & Gerrig, 2019). Additionally, a number of theories emphasize that story characters represent role models, providing information on actions and their consequences (Bandura, 1986; Hakemulder, 2000; Mar, 2018a; Mumper & Gerrig, 2019). Finally, some authors assume that a short exposure to stories that features human interaction and interpersonal relationships might resonate with content in long-term memory and thus prime subsequent processing of social information (Mumper & Gerrig, 2019; Panero et al., 2016). Thus, different mechanisms might drive the effects of story exposure and it is quite possible that several mechanisms work simultaneously. Importantly, all the proposed mechanisms might explain short-term effects measured directly after story exposure. Long-term effects, in contrast, cannot be explained by priming but might be explained by any of the other mechanisms.
Overall, the empirical evidence for the beneficial effects of stories on social-cognitive abilities is decidedly mixed (e.g., Kidd & Castano, 2013, 2019; Lenhart & Richter, 2022; Panero et al., 2016; Samur et al., 2018; van Kuijk et al., 2018). Recent meta-analyses of correlational (Mumper & Gerrig, 2017) and experimental research (Dodell-Feder & Tamir, 2018) have reported small effects. Though correlational studies examine habitual story exposure, they cannot determine causality. Experimental studies, in contrast, allow drawing causal conclusions. Unfortunately, these studies were mostly limited to a short narrative exposure (i.e., a single short story that took only a few minutes to read) and did in most cases include only posttest measures that were conducted directly or shortly after the narrative exposure (e.g., Kidd & Castano, 2013; Lenhart & Richter, 2022; Panero et al., 2016). Accordingly, we know little about the durability of effects following a limited amount of narrative exposure, and the few studies that included delayed posttests or follow-up measures reported mixed findings (Bal & Veltcamp, 2013; Pino & Mazza, 2016). Finally, particularly Dodell-Feder and Tamir’s (2018) findings indicate considerable heterogeneity between studies, underlining the need to assess the moderating role of factors (such as narrative processes) on the magnitude of story effects (see also Koopman & Hakemulder, 2015; Mar, 2018a, 2018b).
TV Series as a Multisensory Narrative Form
According to extant theories, story content and complexity should be the most important features in a story for fostering social-cognitive abilities. However, the format in which a story is told (i.e., book, audiobook, film) might affect social-cognitive outcomes. For example, literature is considered the most abstract of narrative forms, providing readers with a purely symbolic and nonrepresentational portrayal of the social world. Therefore, literature might require recipients to actively construct the social world more than with, for example, the multisensory and immersive nature of films and TV series, which might be especially suited for learning how to decode subtle nonverbal information (Mar & Oatley, 2008).
Only few studies have empirically examined the effects of films and TV series on social-cognitive skills. In a correlational study with preschool children, Mar et al. (2010) found that parents’ knowledge of children’s books and their knowledge of children’s films (but not of children’s TV series) were correlated with children’s theory-of-mind performance. In an experimental study with adults, Black and Barnes (2015) compared the effects of watching fictional TV series and documentaries. They found that participants who had watched a part of a fictional TV series episode outperformed (d = 0.43) those who had watched a part of a documentary episode on the Reading the Mind in the Eyes Test (RMET; Baron-Cohen et al., 2001). The RMET requires participants to gauge the mental or emotional state of a person based on the eyes section of a person’s face, which is assumed to measure theory of mind. In a second experiment, Black and Barnes (2015) replicated this finding conceptually using a full episode of other fictional TV series and documentaries (d = 0.43).
Interestingly, the effect sizes found in both experiments were almost three times as large as the average effect size for experimental studies reported in Dodell-Feder and Tamir’s (2018) meta-analysis. One explanation might be that the stimulus type fit the outcome measure better in Black and Barnes’s (2015) study, whereas Dodell-Feder and Tamir’s (2018) meta-analysis included only studies using text stimuli, but many of those studies used the RMET as an outcome measure. Another possibility might be that audiovisual material might be better suited for improving social-cognitive skills than written material. However, being based on only two experiments, the evidentiary basis for positive effects of TV series on social-cognitive skills is still small, and especially their generalizability to different sets of stimuli and samples of participants is unclear. Moreover, given that the posttest in Black and Barnes’ (2015) studies was administered directly after watching the episode, the extent that the performance improvements represent real learning effects or (just) short-lived priming effects is unclear.
Narrative Engagement with Stories and Identification with Story Characters as Moderator Variables
The results of Dodell-Feder and Tamir’s (2018) meta-analysis of experimental studies indicate considerable heterogeneity between studies. Among other factors, narrative engagement with stories and its characters have been proposed as important moderator variables (e.g., Dodell-Feder & Tamir, 2018; Mar, 2018a, 2018b). Narrative engagement with a story or transportation into a story refers to “a convergent process, where all mental systems and capacities become focused on events occurring in the narrative” (Green & Brock, 2000, p. 701). Identification refers to adopting a character’s view, goals, and plans as if they were one’s own. That is, one literally feels as if one is standing in the character’s shoes (Cohen, 2006).
Empirical studies across a wide range of topics have found that higher degrees of transportation and identification are linked to a higher likelihood of persuasion and personal change through stories (e.g., Appel & Richter, 2010; Green & Brock, 2000; Richter et al., 2014; van Laer et al., 2014). Moreover, numerous studies have provided evidence of effects on social-cognitive abilities (e.g., Bal & Veltkamp, 2013; Johnson, 2012; Johnson et al., 2013; Schwerin & Lenhart, 2022). Johnson (2012), for example, reported that participants who were more transported into a fictional story scored higher on affective empathy and showed more prosocial behavior after reading the story. Bal and Veltkamp (2013) found that transportation moderated the effect of reading a fictional story versus a nonfiction text. Across two experiments, participants who experienced high emotional transportation reported an increase in empathy at the delayed posttest one week after reading the fictional stories. In addition, Schwerin and Lenhart (2022) could show that participants showed better theory-of-mind performance (on the RMET) after reading a literary compared to a popular story, when they were deeply transported into the story and strongly identified with its main character.
Purpose of the Present Studies
The present studies built on previous experimental research (e.g., Black & Barnes, 2015; Kidd & Castano, 2013; Panero et al., 2016, Samur et al., 2018) and were conducted to extend our knowledge on the effects of fictional TV series on social-cognitive abilities, a prevalent type of media for which only few studies have been conducted so far (Black & Barnes, 2015). More precisely, we pursued three interrelated research goals. Our first goal was to examine whether watching a fictional TV series compared to a documentary had a positive impact on participants’ social-cognitive skills. Given the positive findings in two previous lab studies (Black & Barnes, 2015) and positive findings from experimental research on self-paced reading at home (Pino & Mazza, 2016), we assumed that watching several episodes of fictional TV series, which present human interaction and the inner workings of their characters, at home and at participants’ convenience might equally result in social-cognitive improvements. A second goal was to examine whether any potential beneficial effects on social-cognitive abilities represented longer-lasting improvements. To do so, we included a follow-up test in Study 2. Finally, a third goal was to examine whether the effects of fictional TV series depended on the recipients’ transportation into the story and their identification with its characters (i.e., moderator effect; Dodell-Feder & Tamir, 2018; Mar 2018a, 2018b). Accordingly, the present study examined the following three hypotheses:
Participants who watch a fictional TV series, which feature human interaction, thoughts, and feelings, should outperform those who watch a documentary (without human interaction) on social-cognitive abilities at the posttest (Study 1 and 2).
Participants who watch a fictional TV series, which features human interaction, thoughts, and feelings, should outperform those who watch a documentary (without human interaction) on social-cognitive abilities at the follow-up test (Study 2).
Narrative transportation into the story and identification with story characters should moderate the effect of stories on social-cognitive abilities, with stronger transportation and identification increasing the effect of fictional TV series (Study 1 and 2).
To examine these hypotheses, we conducted two online experiments that approximated naturalistic reception of TV series. The design was oriented at Pino and Mazza’s (2016) study in which participants were pretested, then read a book at their own convenience during the span of a week, and finally took a posttest one week after the pretest. In Study 1, participants watched three episodes of either a documentary (without human interaction) or a fictional TV series (with human interaction, thoughts, and feelings) across one week, which was followed by a posttest. In Study 2, participants received the link to the posttest after watching the last of the three episodes and again approximately one week later to gauge the stability of any changes in social-cognitive abilities.
Finally, to address a limitation of the naturalistic online studies, namely that we could not directly control that participants had paid attention to the content of the fictional and documentary TV material, data from a smaller, well-controlled lab study were added as Study 3.
Study 1
Method
Sample
Participants were recruited online by advertising in social media and the University of Würzburg’s online systems for study participation. Participants received 30 Euro or study credits for their participation. The credit option was only available for students in specific study courses at the University of Würzburg. All participants consented to participate and confirmed by ticking several boxes that they had read and understood the study information (e.g., procedure, data protection, voluntary participation) before they started the study. The project was approved by the Ethics Committee of the Institute for Psychology of the Faculty for Human Sciences at the University of Würzburg (GZEK 2020-92).
After applying several exclusion criteria (see Data Preparation and Statistical Analyses), the final sample consisted of 201 participants (157 females, 43 males, and 1 person who identified as non-binary) with a mean age of 22.49 years (SD = 5.25; range = 18 to 59 years; 2 missing values) (see Table 1). Most participants reported a higher education entrance qualification (85%) or a university degree (12%) as their highest educational level.
Table 1
Descriptive Statistics in Study 1.
| VARIABLES | FINAL SAMPLE (N = 201) | TV SERIES (n = 73) | DOCUMENTARY (n = 128) | |||
|---|---|---|---|---|---|---|
| M | SD | M | SD | M | SD | |
| Gender (female) | 157 (78%) | 52 (71%) | 105 (82%) | |||
| Education | ||||||
| Low track | 0 (0%) | 0 (0%) | 0 (0%) | |||
| Middle track | 2 (1%) | 0 (0%) | 2 (2%) | |||
| High track | 170 (85%) | 64 (88%) | 106 (83%) | |||
| University degree | 24 (12%) | 9 (12%) | 15 (12%) | |||
| Other | 5 (2%) | 0 (0%) | 5 (4%) | |||
| Age (years) | 22.49 | 5.25 | 21.93 | 3.44 | 22.80 | 6.04 |
| ART | 13.27 | 7.61 | 13.37 | 7.45 | 13.22 | 7.73 |
| Identification | 2.79 | 0.93 | 3.07 | 0.87 | 2.63 | 0.94 |
| Transportation | 3.10 | 0.86 | 3.12 | 0.82 | 3.09 | 0.88 |
| Theory of Mind (t1) | 25.76 | 2.89 | 25.73 | 2.79 | 25.78 | 2.96 |
| Theory of Mind (t2) | 26.14 | 3.17 | 26.45 | 2.90 | 25.96 | 3.31 |
| Empathy (t1) | 3.75 | 0.42 | 3.72 | 0.43 | 3.77 | 0.42 |
| Empathy (t2) | 3.71 | 0.45 | 3.65 | 0.46 | 3.75 | 0.44 |
| Other TV series/films (number) | 1.16 | 1.10 | 1.33 | 1.14 | 1.06 | 1.07 |
| Other TV series/films (hours) | 3.73 | 4.48 | 4.55 | 5.04 | 3.26 | 4.07 |
| Time pre- to posttest (hours) | 171.70 | 9.02 | 171.40 | 8.90 | 171.80 | 9.12 |
[i] Note. The educational system in Germany comprises three high-school tracks in secondary school: Haupt-/Mittelschule (low track), Realschule (middle track), Gymnasium (high track), with only the latter track qualifying for university entrance. ART = Author Recognition Test (Grolig et al., 2020; checklist B). Other TV series/films refer to other TV series and films watched during the period of the study.
Orienting at the only effect size available for TV stimuli (d = 0.43, reported in Black & Barnes, 2015, Study 1 and Study 2), a power analysis with PANGEA (Westfall, 2016) indicated that 58 participants per condition or 116 participants in total were needed to detect differential effects depending on the experimental condition (2 × 2 design; α = .05, 1–β = .80). An additional post-hoc sensitivity analysis with G*Power (version 3.1.9.7; Faul et al., 2009; α = .05, 1–β = .80) for the moderator analyses of transportation and identification indicated that the sample size of 201 participants was sufficient to detect small moderator effects, with an effect size for the single regression coefficient of f2 = .03 or higher.
Design
Study 1 was based on a 2 × 2 mixed quasi-experimental design, with measurement point (pre- vs. posttest) representing a within-subjects factor and experimental condition (documentary vs. fictional TV series) representing a between-subjects factor. Narrative transportation and identification were included as continuous moderator variables.
Experimental Stimuli
In the fictional TV series condition, participants watched either three episodes of The Expanse (Season 1, Episodes 1 to 3), which is an American science fiction TV series, or Dietland (Season 1, Episodes 1 to 3), which is an American dark comedy series. Both fictional TV series received critical acclaim and were selected to portray interpersonal relationships and the inner workings of the protagonists. Dietland portrays the main character’s (Plum Kettle) struggles with issues of modern societies such as patriarchy, misogyny, and unrealistic standards for women’s physical appearances. The Expanse portrays social classes, social conflict, and consequences of actions and convictions in a futuristic setting. In the documentary condition, participants watched either three episodes of the documentary Der Dino-Planet (The Dino Planet, Episodes 1 to 3), which is a documentary about the age of dinosaurs, or the episodes Der Urknall – Das Rätsel des Anfangs (The Big Bang – The Mystery of the Beginning), Kosmisches Schicksal (Cosmic Destiny), and Im Sog des schwarzen Lochs (In the Maelstrom of the Black Hole) of the astrophysics documentary Faszination Universum mit Harald Lesch (Fascination Universe presented by Harald Lesch). The topics of the documentaries were selected so that they avoided portraying humans or anthropomorphic interactions between animals. The episodes of the fictional TV series condition were available on Amazon Prime, the documentaries were accessible in the ZDF media library, which is an asynchronous public broadcasting service available on the Internet for all residents in Germany. The duration of the episodes ranged between 45 and 50 min.
Measures
Demographics
Participants provided information on their age (in years), their gender, and their highest educational level.
Leisure Reading
The German Author Recognition Test (ART; Grolig et al., 2020; checklist B) was used to assess narrative leisure reading. Participants are required to indicate whether they know an author or not by ticking a box. The ART consists of 26 highbrow and 24 popular authors (predominantly fiction) and contains 25 foils. For each correctly chosen author one point is awarded, resulting in scores ranging 0 to 50. Foil items were not included in the analyses but were used to check for individuals whose responses might be distorted by false alarms. None of the participants showed a conspicuous response pattern. In addition, to check for the possibility that the ART was inadvertently skipped, participants were required to tick at least one of the boxes per page or to indicate that they did not know any of the names. Internal consistency was excellent (Cronbach’s α = .90).
Theory of Mind
For comparability with previous research (e.g., Black & Barnes, 2015; see meta-analyses: Dodell-Feder & Tamir, 2018; Mumper & Gerrig, 2017), a German adaption (Bölte, 2005) of the widely used Reading the Mind in the Eyes Test (RMET; Baron-Cohen et al., 2001) was used to assess theory of mind. The RMET consists of 36 items that require participants to gauge the mental or emotional state of a person in a photo that depicts only the person’s eyes. For each photo, four response options are given, with one correct answer and three distractors. The RMET score ranges between 0 and 36, with higher scores reflecting better theory of mind. Internal consistency was low at the pretest (Cronbach’s α = .25) and the posttest (Cronbach’s α = .40).
Empathy
For comparability with previous research (see meta-analyses: Dodell-Feder & Tamir, 2018; Mumper & Gerrig, 2017), the Saarbrücker Persönlichkeitsfragebogen (IRI-S D, V 7.0; Paulus, 2019), a German adaption of the Interpersonal Reactivity Index (IRI; Davis, 1980), was used to assess trait empathy. The IRI-S D consists of 16 items that are answered on a 5-point Likert scale (1 = never to 5 = always), with four items assessing Personal Distress, Perspective Taking, Empathic Concern, and Fantasy respectively. Following recommendations from Paulus (2012) for the German adaption of the IRI, the latter three subscales are combined to form the Empathy scale, with mean scores ranging from 1 to 5 and higher scores reflecting higher empathy. Internal consistency was acceptable at the pretest (Cronbach’s α = .72) and the posttest (Cronbach’s α = .77).
Transportation
To assess the degree of transportation into the TV series/documentary, we used the German version of the Transportation Scale – Short Form (TS-SF; Appel et al., 2015). The TS-SF consists of six items on a 7-point response scale from 1 (not at all) to 7 (very much). Instead of the original 7-point scale, we used a shorter version of the response scale (from 1 to 5). In the current study, the last two items that ask about two characters of the respective story were subsumed into a single item by asking about the main character. The items were averaged to obtain a value for transportation, and the internal consistency was good (Cronbach’s α = .81).
Identification
A German adaption (Isberner et al., 2019) of the identification items from Sestir and Green (2010) was used to measure identification with story characters. In the present study, the three items were answered on a 6-point rating scale (1 = not at all to 6 = very much). The items were averaged to obtain a value for identification, and the internal consistency was acceptable (Cronbach’s α = .75).
Control Questions
To ensure that participants had watched the episodes of the fictional TV series or the documentary that was assigned to them, three easy comprehension questions relating to the episodes were asked in the posttest. The questions were presented in the single-response format with three options, with one correct guess representing the chance level. In addition, participants were asked to indicate if they had watched exactly the three episodes that were assigned to them or if they had deviated in any way from the assignment (e.g., by watching more or fewer episodes or by watching other episodes). Participants were encouraged to tell the truth by explicitly stating that the full amount of course credits and payment would be awarded irrespective of their answer.
Procedure
The pre- and posttest, which took each approximately 20 to 30 min to complete, were conducted with the online tool SoSci Survey (www.soscisurvey.de). Before the study started, participants received information about the study (procedure, data protection, voluntary participation, etc.) and were required to consent to participate by ticking several boxes. At the beginning of the pretest, participants were asked demographic questions. Then they were pretested on the RMET and the IRI-S D, which was followed by the assessment of the ART and audiovisual media consumption. The documentaries were available in the ZDF media library and thus accessible for all participants, whereas the fictional TV series were only available on Amazon Prime. If participants indicated that they had no access to Amazon Prime, they were automatically assigned to the documentary condition and then randomly assigned to one of the documentaries. Otherwise, participants were randomly assigned to one of the two conditions and to one of the two TV series/documentaries within each condition. During the next seven days, they either watched three episodes of one of the two documentaries (documentary condition) or three episodes of one of the two fictional TV series (fictional TV series condition). After seven days, they received the link to the posttest comprising the control questions, the dependent variables (RMET and IRI-S D), the transportation and identification questionnaires, and questions about other kinds of media consumption during the study.
Data Preparation and Statistical Analyses
Exclusion Criteria
We used several exclusion criteria given that participants’ behavior in online experiments cannot be controlled to the same extent in the lab. In a first step, we excluded data entries that were incomplete (no data, data only for pre- or posttest) or that were contaminated (multiple data entries per measurement point). In a second step, we checked for non-adherence and outliers. The study sample consisted of 263 participants after excluding data of participants who entered no data (n = 42 data entries), entered incomplete data (i.e., only pre- or posttest; n = 16 data entries), or provided more than one data entry for pretest or posttest (n = 75 data entries). Of this sample, participants were excluded if they failed to comply with the experimental instruction according to their self-report (i.e., they neglected to watch the episodes that they were assigned or they watched more or fewer episodes of the TV series; n = 18) or if they could not answer at least two of the three easy comprehension questions related to the content of the episodes (n = 5). In addition, data entries were excluded if the time period between pretest and posttest (n = 39), identification (n = 1), transportation (n = 0), empathy (n = 2), or theory-of-mind scores (n = 10) were outliers: that is, if the values exceeded three median absolute deviations (Leys et al., 2019). After applying these exclusion criteria, the final sample consisted of 201 participants (fictional TV series condition: n = 73; documentary condition: n = 128). A subset of 57 participants from the final sample were assigned non-randomly to the documentary condition because they had no access to Amazon Prime, which was required to watch the episodes of the fiction condition. We conducted all analyses twice, once with the non-randomly assigned participants included, and a second analysis with these same participants excluded. As the results were similar, we chose not to exclude the non-randomly assigned participants (for the results including only randomized participants, see supplemental materials Table S1).
Statistical Analyses
All statistical analyses were conducted with R (R Core Team, 2021; Version 4.3.0). We used the R package Routliers (Version 0.0.0.3; Delacre & Klein, 2019) for detecting outliers, and we employed mixed-effects modeling (lmer) provided in the R packages lme4 (Version 1.1–33; Bates et al., 2015) to test the hypotheses and lmerTest (Version 3.1–3; Kuznetsova et al., 2017) to obtain p values for the coefficients. The R package emmeans (Version 1.8.6; Lenth, 2023) was used to compare individual groups by calculating pairwise interaction contrasts on the mixed-effects models and to calculate effect sizes (Cohen’s d; Cohen, 1988) for pairwise comparisons. The package sjPlot (Version 2.8.14; Lüdecke, 2023) was used to create tables. For mixed-effects analyses, categorical variables were effect-coded and continuous predictor variables were mean-centered.
In addition to classical hypothesis tests, we conducted tests of inferiority for non-significant results following guidelines provided in Lakens et al. (2018). The rationale of employing inferiority tests in this situation is that they allow testing whether a population effect, should it exist at all, is smaller than the minimal effect size considered of interest. Using the small-telescopes approach (Simonsohn, 2015) to determine the bound of inferiority (i.e., the effect size of interest), we tested against an effect size of d = 0.235, which represents the mean effect size that could have been detected with a power of .33 (d33%) in the studies reported by Black and Barnes (2015). Inspection of the data indicated that all variables with the exception of the ART scores were normally distributed. The ART scores were positively skewed, which was corrected by applying a square root transformation. The α level was set to p < .05. All tests with the exception of the inferiority tests were two-tailed.
A considerable number of participants were excluded because of the conservative use of exclusion criteria. Therefore, we additionally ran the main analyses on the sample comprising the participants with full and interpretable data sets (N = 263). Results were highly similar and thus only the analyses using the final sample with exclusion criteria (N = 201) are reported (for results of the full sample, see supplemental materials Table S2).
Results
Preliminary Analyses
Descriptive statistics for the whole sample and the experimental conditions are displayed in Table 1. We found no indication of floor or ceiling effects in any of the dependent or moderator variables and no statistically significant differences between the experimental conditions in any of the demographic variables (gender: χ2 = 4.38, p = .072, Cramer’s V = .15, educational background: χ2 = 8.10, p = .138, Cramer’s V = .20, age: t = –1.13, p = .261, d = –0.17, 95% CI [–0.46; 0.13]), cumulative reading experience (t = 0.14, p = .887, d = 0.02, 95% CI [–0.27; 0.31]), the dependent variables at the pretest (theory of mind: t = –0.13, p = .897, d = –0.02, 95% CI [–0.31; 0.27]; empathy: t = –0.91, p = .367, d = –0.13, 95% CI [–0.42; 0.16]), or the time between pre- and posttest (t = –0.30, p = .762, d = –0.04, 95% CI [–0.33; 0.25]). In addition, there was no statistically significant difference regarding the number of additional TV series or films watched during the study (t = 1.65, p = .100, d = 0.24, 95% CI [–0.05; 0.53]). However, there was a small difference regarding the duration of other audiovisual media consumption during the study (t = 1.97, p = .050, d = 0.29, 95% CI [–0.00; 0.58]), with participants in the fictional TV series condition watching somewhat more than their peers in the documentary group.
We also checked whether participants who were excluded due to outliers or non-adherence to the experimental instruction (n = 62) differed from participants who were included in the final sample (n = 201). No significant differences were found in participants’ gender (χ2 = 0.87, p = .710, Cramer’s V = .06), education (χ2 = 10.64, p = .057, Cramer’s V = .20), age (t = 0.62, p = .533, d = 0.09, 95% CI [–0.20; 0.38]), or prior cumulative reading experience (t = –0.52, p = .607, d = –0.07, 95% CI [–0.36; 0.21]). Taking experimental condition and time between pre- and posttest into account, there was also no significant difference in character identification (t = –0.86, p = .391, d = –0.15, 95% CI [–0.50; 0.20]) or in transportation at the posttest (t = –1.58, p = .115, d = –0.28, 95% CI [–0.63; 0.07]).
Theory-of-mind performance and self-reported empathy were weakly correlated at pre- (r = .11, p = .110, 95% CI [–.03;.25]) and posttest (r = .14, p = .042, 95% CI [.01; .28]). Both showed moderate to high stability (theory of mind: r = .53, p < .001, 95% CI [.42; .62]; empathy: r = .85, p < .001, 95% CI [.81; .89]). The pretest scores in both variables were not significantly correlated with cumulative reading experience (theory of mind: r = –.01, p = .876, 95% CI [–.15; .13]; empathy: r = .11, p = .116, 95% CI [–.03; .25]). As expected, identification and transportation were highly correlated (r = .70, p < .001, 95% CI [.63; .77]).
Effects on Theory of Mind
As can be seen from Table 2 (ToM Model 1) and Figure 1, a significant effect of time emerged, with RMET scores increasing slightly from pretest to posttest, d = 0.15, 95% CI [0.01; 0.29]. However, the interaction effect between time and condition was not significant, d = 0.18, 95% CI [–0.10; 0.46]. The test of inferiority against the smallest effect size of interest (d = 0.235) was not significant for the interaction effect between time and condition (p = .349), indicating that the null hypothesis that the effect size was smaller than the effect size of interest could not be rejected.
Table 2
Effects of Experimental Condition on Theory of Mind and Empathy in Study 1.
| PREDICTORS | ToM MODEL 1 | ToM MODEL 2 | ToM MODEL 3 | EMP MODEL 1 | EMP MODEL 2 | EMP MODEL 3 | ||||||||||||
|---|---|---|---|---|---|---|---|---|---|---|---|---|---|---|---|---|---|---|
| ESTIMATES (CI) | t (df) | p | ESTIMATES (CI) | t (df) | p | ESTIMATES (CI) | t (df) | p | ESTIMATES (CI) | t (df) | p | ESTIMATES (CI) | t (df) | p | ESTIMATES (CI) | t (df) | p | |
| (Intercept) | 25.98 (25.60–26.36) | 133.39 (199) | <.001 | 26.01 (25.61–26.41) | 128.16 (197) | <.001 | 25.98 (25.60–26.37) | 133.10 (197) | <.001 | 3.72 (3.66–3.78) | 120.87 (199) | <.001 | 3.69 (3.63–3.75) | 127.80 (197) | <.001 | 3.72 (3.66–3.78) | 127.49 (197) | <.001 |
| Condition | 0.11 (–0.28–0.49) | 0.56 (199) | .576 | 0.14 (–0.26–0.54) | 0.70 (197) | .486 | 0.11 (–0.27–0.50) | 0.57 (197) | .567 | –0.04 (–0.10–0.02) | –1.29 (199) | .199 | –0.09 (–0.15––0.03) | –3.16 (197) | .002 | –0.04 (–0.10–0.02) | –1.45 (197) | .148 |
| Time | 0.23 (0.01–0.44) | 2.10 (199) | .037 | 0.20 (–0.03–0.42) | 1.74 (197) | .083 | 0.22 (0.01–0.44) | 2.07 (197) | .039 | –0.02 (–0.04––0.01) | –2.80 (199) | .006 | –0.03 (–0.04––0.01) | –2.80 (197) | .006 | –0.02 (–0.04––0.01) | –2.79 (197) | .006 |
| Condition × Time | 0.14 (–0.08–0.35) | 1.27 (199) | .207 | 0.11 (–0.11–0.33) | 0.97 (197) | .331 | 0.13 (–0.08–0.35) | 1.25 (197) | .214 | –0.01 (–0.03–0.01) | –1.34 (199) | .182 | –0.01 (–0.03–0.01) | –1.33 (197) | .184 | –0.01 (–0.03–0.01) | –1.35 (197) | .178 |
| Identification | –0.12 (–0.56–0.31) | –0.56 (197) | .577 | 0.21 (0.15–0.28) | 6.82 (197) | <.001 | ||||||||||||
| Condition × Identification | –0.10 (–0.53–0.34) | –0.44 (197) | .659 | 0.08 (0.02–0.15) | 2.65 (197) | .009 | ||||||||||||
| Time × Identification | 0.09 (–0.15–0.33) | 0.76 (197) | .446 | 0.00 (–0.02–0.02) | 0.08 (197) | .938 | ||||||||||||
| Condition × Time × Identification | 0.12 (–0.12–0.36) | 0.96 (197) | .340 | 0.00 (–0.01–0.02) | 0.47 (197) | .640 | ||||||||||||
| Transportation | –0.22 (–0.68–0.24) | –0.93 (197) | .355 | 0.17 (0.10–0.24) | 4.91 (197) | <.001 | ||||||||||||
| Condition × Transportation | 0.05 (–0.41–0.52) | 0.23 (197) | .816 | 0.03 (–0.03–0.10) | 0.99 (197) | .325 | ||||||||||||
| Time × Transportation | 0.08 (–0.17–0.34) | 0.65 (197) | .515 | 0.01 (–0.01–0.03) | 0.90 (197) | .368 | ||||||||||||
| Condition × Time × Transportation | 0.10 (–0.15–0.36) | 0.80 (197) | .427 | –0.00 (–0.02–0.02) | –0.34 (197) | .737 | ||||||||||||
| Random Effects | ||||||||||||||||||
| Residual Variance | 4.33 | 4.35 | 4.36 | 0.03 | 0.03 | 0.03 | ||||||||||||
| Intercept Variance | 4.89 id | 4.94 id | 4.90 id | 0.16 id | 0.13 id | 0.14 id | ||||||||||||
| ICC | .53 | .53 | .53 | .85 | .82 | .84 | ||||||||||||
| N | 201 id | 201 id | 201 id | 201 id | 201 id | 201 id | ||||||||||||
| Observations | 402 | 402 | 402 | 402 | 402 | 402 | ||||||||||||
| Marginal R2/Conditional R2 | .007/.534 | .010/.536 | .012/.535 | .011/.854 | .183/.854 | .111/.855 | ||||||||||||
[i] Note. CI = 95% confidence interval. Categorical variables were effect-coded (Time: pretest = –1, posttest = 1; Condition: documentary = –1, TV series = 1). Continuous predictors were mean-centered.
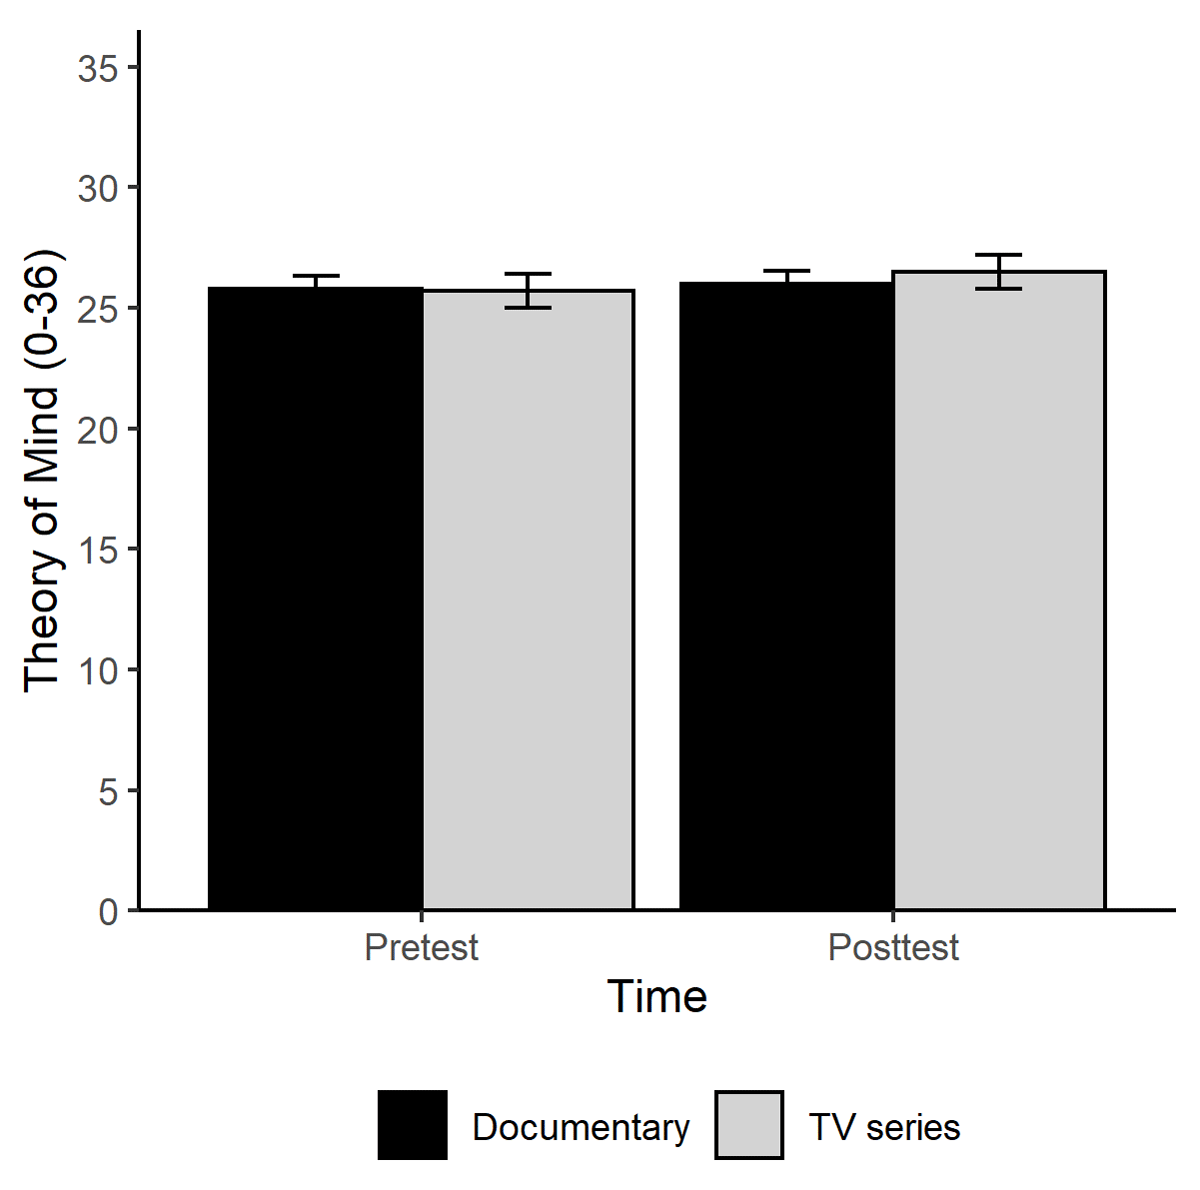
Figure 1
Effect of Experimental Condition on Theory of Mind in Study 1.
Note: Error bars represent 95% confidence intervals.
Effects on Empathy
We found a significant effect of time in self-reported empathy (Table 2: Empathy Model 1 and Figure 2), with self-reported empathy decreasing slightly from pretest to posttest, d = –0.11, 95% CI [–0.19; –0.03]. However, the interaction effect between time and condition was again not significant, d = –0.11, 95% CI [–0.26; 0.05]. The test of inferiority against the smallest effect size of interest (d = 0.235) was significant for the interaction between time and condition (p < .001), indicating that the effect size was significantly smaller than the effect size of interest.
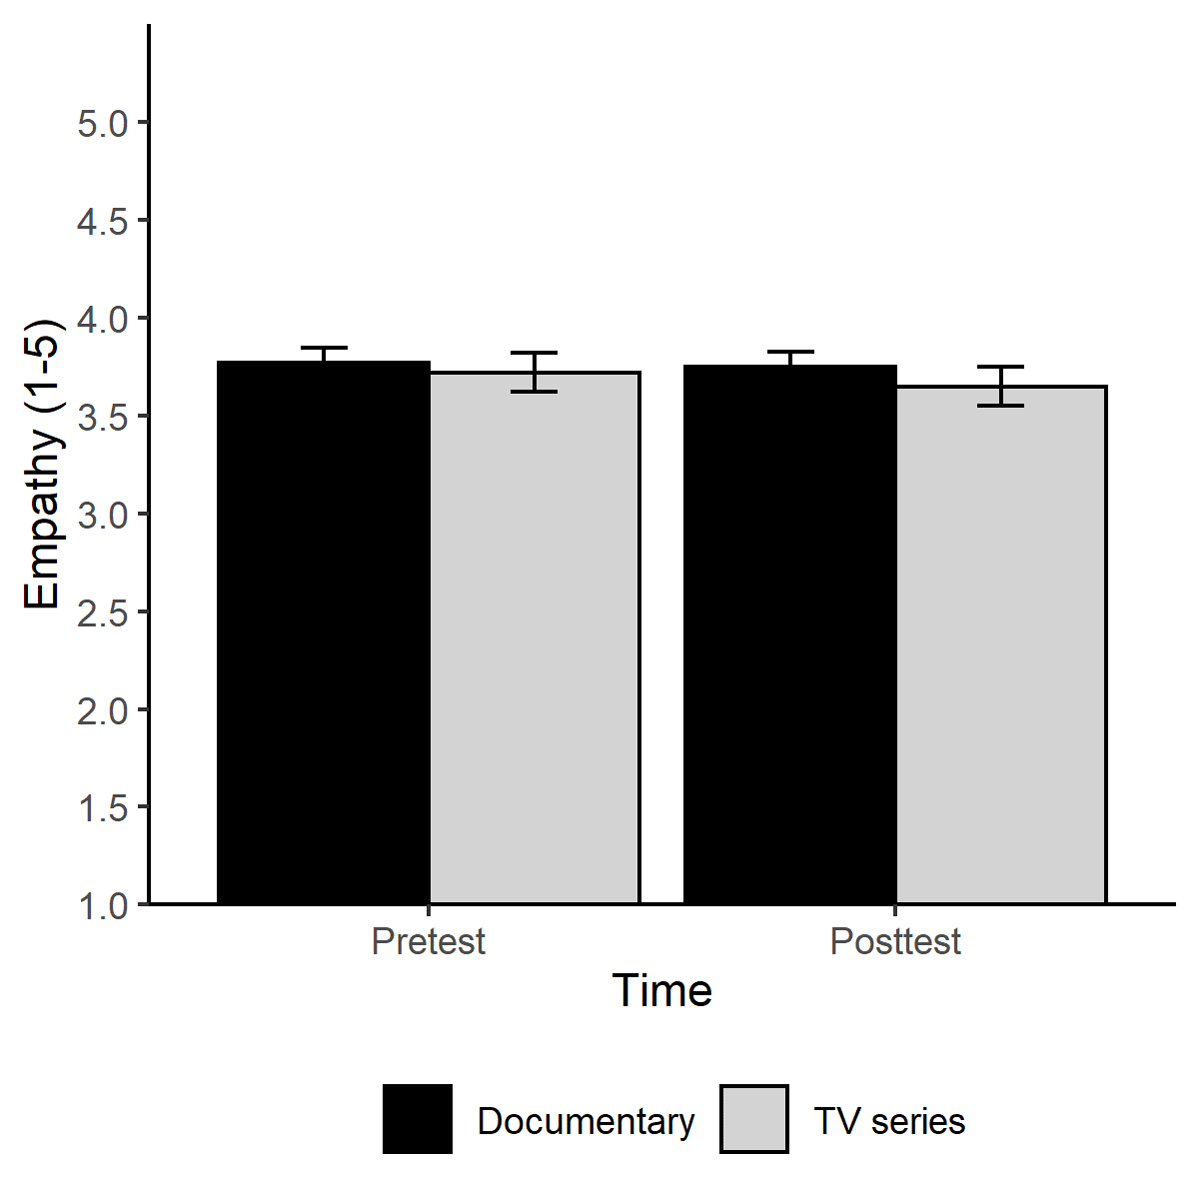
Figure 2
Effect of Experimental Condition on Empathy in Study 1.
Note: Error bars represent 95% confidence intervals.
Examining Transportation and Identification as Moderator Variables
The moderator effects of transportation and identification on theory-of-mind performance were not significant (see Table 2, ToM Model 1 and ToM Model 2). A similar picture emerged with self-reported empathy. Although both transportation and identification significantly predicted self-reported empathy, neither transportation nor identification represented significant moderator variables (see Table 2, Empathy Model 2, Empathy Model 3).
Exploratory Analyses: Participants’ Attention to the Experimental Stimuli
To check for the possibility that participants’ attention to the experimental stimuli might have affected the outcomes, we reran all analyses with the score on the control questions included as additional factor (2 vs. 3 control questions solved correctly; note that only participants who answered at least 2 out of 3 control questions correctly were included in the final sample). The score on the control questions did not significantly affect the interaction effect condition × time (ToM: p = .971; Empathy: p = .593) or the three-way interactions with transportation (ToM: p = .276; Empathy: p = .759) or identification (ToM: p = .076; Empathy: p = .585).
Discussion
In Study 1, we used a naturalistic pre-post design to investigate the effects of watching several episodes of a fictional TV series (The Expanse or Dietland) compared to a nonfiction documentary and to examine transportation and identification as potential moderators of this effect. We found that performance in the theory-of-mind task slightly increased and that self-reported empathy slightly decreased from pre- to posttest irrespective of the condition. In addition, we found no evidence for a moderating role of identification with story characters or transportation into the stories in the effects on theory-of-mind performance and self-reported empathy. To control for the possibility that our experimental approach (e.g., selection of TV series, time period between stimulus exposure and posttest, no follow-up testing, dependent measures) might not have been well-suited for detecting beneficial effects of fictional TV series on social-cognitive skills, we conducted a second experiment based on a modified experimental approach.
Study 2
Similar to Study 1, in Study 2 the participants watched either three episodes of a fictional TV series or of a nonfiction documentary at home and at their convenience. However, Study 2 had five main differences in the experimental approach: (a) for generalizability, we exchanged the experimental stimuli, using different fictional TV series and different nonfictional documentaries in the control condition; (b) an additional measure for media-based empathy was included; (c) we modified the procedure to obtain a more consistent time period between exposure to the experimental stimuli and posttest; (d) we added a follow-up test to assess the stability of any effects; and, (e) identification and transportation were highly correlated (r = .70) and behaved very similar in the moderator analyses in Study 1. Thus, we included only transportation in Study 2.
Method
Sample
As in Study 1, participants were recruited online by advertising in social media and the University of Würzburg’s online systems for study participation. Participants could receive study credits for their participation. All participants consented to participate and confirmed by ticking several boxes that they had read and understood the study information (procedure, data protection, voluntary participation, etc.) before they started the study. The project was approved by the Ethics Committee of the Institute for Psychology of the Faculty for Human Sciences of the University of Würzburg (GZEK 2020-92).
After the application of several exclusion criteria (see Data Preparation and Statistical Analyses), the final sample consisted of 165 participants (142 females, 23 males) with a mean age of 21.99 years (SD = 6.21; range = 18 to 59 years) (see Table 3). Most participants reported a higher education entrance qualification (96%) as their highest educational level.
Table 3
Descriptive Statistics in Study 2.
| VARIABLES | FINAL SAMPLE (N = 165) | TV SERIES (n = 84) | DOCUMENTARY (n = 81) | |||
|---|---|---|---|---|---|---|
| M | SD | M | SD | M | SD | |
| Gender (female) | 142 (86%) | 73 (87%) | 69 (85%) | |||
| Education | ||||||
| High track | 158 (96%) | 79 (94%) | 79 (98%) | |||
| Other Tracks | 7 (4%) | 5 (6%) | 2 (2%) | |||
| Age (years) | 21.99 | 6.21 | 22.00 | 6.29 | 21.98 | 6.17 |
| ART | 12.82 | 6.93 | 12.96 | 7.26 | 12.68 | 6.62 |
| Transportation | 4.95 | 1.07 | 5.50 | 0.76 | 4.38 | 1.04 |
| Theory of Mind (t1) | 24.47 | 3.02 | 24.35 | 2.98 | 24.60 | 3.08 |
| Theory of Mind (t2) | 24.81 | 3.30 | 24.37 | 3.36 | 25.26 | 3.19 |
| Theory of Mind (t3) | 25.14 | 3.77 | 24.88 | 4.03 | 25.41 | 3.50 |
| Empathy (t1) | 3.72 | 0.42 | 3.69 | 0.42 | 3.75 | 0.42 |
| Empathy (t2) | 3.78 | 0.40 | 3.76 | 0.41 | 3.79 | 0.40 |
| Empathy (t3) | 3.76 | 0.42 | 3.75 | 0.44 | 3.77 | 0.41 |
| Media-based empathy (t1) | 3.92 | 0.45 | 3.87 | 0.46 | 3.97 | 0.45 |
| Media-based empathy (t2) | 3.91 | 0.44 | 3.92 | 0.47 | 3.90 | 0.40 |
| Media-based empathy (t3) | 3.86 | 0.46 | 3.83 | 0.48 | 3.88 | 0.45 |
| Other TV genres (number) | 2.60 | 1.25 | 2.62 | 1.18 | 2.58 | 1.32 |
| Other TV episodes (number) | 2.87 | 1.86 | 2.95 | 1.94 | 2.78 | 1.78 |
| Time pre- to posttest (hours) | 98.75 | 56.46 | 87.94 | 54.38 | 110.00 | 56.71 |
| Time posttest to follow-up (hours) | 169.20 | 26.24 | 165.30 | 27.95 | 173.20 | 23.85 |
[i] Note. The educational system in Germany comprises three high-school tracks in secondary school: Haupt-/Mittelschule (low track), Realschule (middle track), Gymnasium (high track), with only the latter track qualifying for university entrance. ART = Author Recognition Test (Grolig et al., 2020; checklist B). Other TV genres/episodes refer to other TV genres and episodes watched during the period from pre- to posttest.
Orienting again at an effect size of d = 0.43 (Black & Barnes, 2015, Study 1 and Study 2), a power analysis with PANGEA (Westfall, 2016) indicated that 58 participants per condition or 116 in total were needed to detect differential effects depending on experimental condition (2 × 3 design; α = .05, 1–β = .80). An additional post-hoc sensitivity analysis with G*Power (version 3.1.9.7; Faul et al., 2009; α = .05, 1–β = .80) for the moderator analysis of transportation indicated that the sample size of 165 participants was sufficient to detect small moderator effects, with an effect size for the single regression coefficient of f2 = .04 or higher.
Design
Study 2 was based on a 3 × 2 mixed experimental design, with measurement point (pre- vs. posttest vs. follow-up) representing a within-subjects factor and experimental condition (documentary condition vs. fictional TV series condition) representing a between-subjects factor. Narrative transportation was included as a continuous moderator variable.
Experimental Stimuli
In the fictional TV series condition, participants watched three episodes of This Is Us (Season 1, Episodes 1 to 3). In the non-fictional documentary condition, participants watched three episodes of Wildes Bayern (Wild Bavaria, Episodes 1 to 3). The stimuli were available on Amazon Prime, access to which was required to participate in the present study. The duration of the episodes ranged between 41 and 44 minutes. The fictional TV series received critical acclaim and was selected because of its focus on interpersonal relationships and the inner workings of the protagonists. This Is Us is an emotional drama in which the members of a family (the Pearson family) experience moments of triumph, joy, love, and heartbreak as well as deeper meaning in their lives. For the non-fictional documentary condition, the documentary Wildes Bayern was selected because no human interaction was portrayed.
Measures
Demographics
Participants provided information on their age (in years), their gender, and their highest educational level.
Leisure Reading
Again, the German Author Recognition Test (ART) by Grolig et al. (2020; checklist B) was used to assess narrative leisure reading. Internal consistency was good (Cronbach’s α = .88).
Theory of Mind
Like in Study 1, the German adaption by Bölte (2005) of the Reading the Mind in the Eyes Test (RMET; Baron-Cohen et al., 2001) was used to assess theory of mind. Internal consistency was low at the pretest (Cronbach’s α = .30), at the posttest (Cronbach’s α = .42), and at the follow-up (Cronbach’s α = .57).
Empathy
Like in Study 1, the Saarbrücker Persönlichkeitsfragebogen (IRI-S D, V 7.0; Paulus, 2019), a German adaption of the Interpersonal Reactivity Index (IRI; Davis, 1980), was used to assess trait empathy. Internal consistency was acceptable at the pretest (Cronbach’s α = .71), at the posttest (Cronbach’s α = .73), and at the follow-up (Cronbach’s α = .76).
Media-Based Empathy
To assess empathic reactions when using media, we used the questionnaire Medienbasierte Empathie (MBE; Happ & Pfetsch, 2018). The MBE consists of the four subscales media sympathy, affective media empathy, cognitive media empathy, and immersion in video games, which are answered on a 5-point Likert-scale (1 = never to 5 = always). Only the first three subscales were averaged to obtain a mean score for media-based empathy because video games were not relevant for the present study, and internal consistency is higher without the immersion in video game subscale (Happ & Pfetsch, 2015). The first item of the subscale media sympathy (which normally has five items) was not included in the online questionnaire because of a technical error. Thus, each of the three subscales consisted of four items. Internal consistency was acceptable at the pretest (Cronbach’s α = .77) and at the posttest (Cronbach’s α = .77), and good at the follow-up (Cronbach’s α = .80).
Transportation
To assess the degree of transportation into the series/ documentary, the German version of the Transportation Scale – Short Form (TS-SF; Appel et al., 2015) with six items was used (1 = not at all to 7 = very much). The scale had good internal consistency (Cronbach’s α = .84) for the documentary and acceptable internal consistency for the fictional TV series (Cronbach’s α = .71).
Control Questions
To ensure that participants had watched the episodes of the fictional TV series or the documentary that was assigned to them, three easy comprehension questions relating to the episodes were asked in the posttest. The questions were presented in the single-response format with two options, with 1.5 representing the chance level. In addition, participants were asked to indicate if they had watched exactly the three episodes that were assigned to them or if they had deviated in any way from the assignment (e.g., by watching more or fewer episodes or by watching other episodes). Participants were encouraged to tell the truth by explicitly stating that the full amount of course credits and payment would be awarded irrespective of their answer.
Procedure
The pretest, the posttest, and the follow-up, which took each approximately 20 to 30 min to complete, were conducted with the online tool SoSci Survey. Before the study started, participants received information concerning the study (procedure, data protection, voluntary participation, etc.) and were required to consent to participate by ticking several boxes, which was followed by demographic questions, the assessment of leisure reading (ART), and several questions concerning their media consumption. Then they were pretested on the RMET, IRI-S D, and the MBE. Participants were randomly assigned to one of the two conditions. During the next five days, they either watched three episodes of the documentary or three episodes of the fictional TV series. After informing the experimenter that they had watched the episodes, they received the link to the posttest comprising the transportation scale, the control questions, the dependent variables (RMET, IRI-S D, and MBE), and questions about other kinds of media consumption during the study. Seven days after the posttest, the participants were asked to complete the follow-up test, which included the dependent variables (RMET, IRI-S D, and MBE).
Data Preparation and Statistical Analyses
Exclusion Criteria
As in Study 1, we used several exclusion criteria because we could not control participants’ behavior in our online experiment as well as in experiments in the lab. The study sample consisted of 233 participants after excluding those data from participants who entered no data or incomplete data (i.e., missing data for the pretest, posttest, or follow-up) or submitted more than one data set for pretest or posttest (n = 99 data entries removed). Of this initial sample, participants were excluded if they failed to comply with the experimental instruction according to their self-report (i.e., they neglected to watch the episodes that they were assigned to, or they watched more or fewer episodes of the TV series; n = 5), if they could not answer at least two of the three easy comprehension questions related to the content of the episodes (n = 13). In addition, participants were excluded if time period between pretest and posttest or between posttest and follow-up (n = 50), transportation (n = 0), empathy (n = 4), media-based empathy (n = 1), or theory-of-mind scores (n = 16) were outliers at the respective measurement points, that is, values exceeded three median absolute deviations (Leys et al., 2019). After applying these exclusion criteria, the final sample consisted of 165 subjects (fiction condition: n = 84; non-fiction condition: n = 81).
Statistical Analyses
The approach to data analysis was the same as in Study 1. In addition, time between pre- and posttest was positively skewed and thus a square-root transformation was applied. Many participants were excluded because of the conservative use of exclusion criteria. Therefore, we additionally ran the main analyses on the sample comprising the participants with full data sets (N = 233). Results were similar and thus only the analyses using the final sample with exclusion criteria (N = 165) is reported (for the results of the full sample, see supplemental materials Table S3).
Results
Preliminary Analyses
Descriptive statistics for the whole sample and the experimental conditions are displayed in Table 3. We found no indication of floor or ceiling effects in any of the dependent or moderator variables and no statistically significant differences between the experimental conditions in any of the demographic variables (gender: χ2 = 0.10, p = .825, Φ = .02, 95% CI [–.13;.18], educational background: χ2 = 1.61, p = .680, age: t = 0.03, p = .980, d = 0.00, 95% CI [–0.30; 0.31]), cumulative reading experience (t = 0.06, p = .956, d = 0.01, 95% CI [–0.30; 0.32]), the dependent variables at the pretest (theory of mind: t = –0.06, p = .583, d = –0.09, 95% CI [–0.39; 0.22]; empathy: t = –0.91, p = .366, d = –0.14, 95% CI [–0.45; 0.17], media-based empathy: t = –1.33, p = .184, d = –0.21, 95% CI [–0.52; 0.10]), the time between posttest and follow-up (t = –1.95, p = .053, d = –0.30, 95% CI [–0.61; 0.01]), or the number of different genres and episodes watched outside the experiment during the time from pre- to posttest (genres: t = 0.20, p = .843, d = 0.03, 95% CI [–0.28; 0.34]; episodes: t = 0.60, p = .548, d = 0.09, 95% CI [–0.21; 0.40]). However, we found a significant difference between the experimental conditions on the time between pretest and posttest t = –1.95, p = .009, d = –0.41, 95% CI [–0.72; –0.10]), with participants in the documentary group showing a longer time lapse between pre- and posttest. Accordingly, all analyses were conducted with and without time between pre- and posttest as a covariate. Although time between pre- and posttest was not significantly related to any of the dependent variables (pretest: r = –.01 to .13, all p ≥ .086; posttest: r = –.05 to .07, all p ≥ .382; follow-up: r = –.02 to .07, all p ≥ .346) and the results of the two approaches were highly similar, the more conservative approach including time between pre- and posttest as covariate is reported (for the results of the approach without the time covariate, see supplemental materials Table S4).
We also checked whether participants who were excluded due to outliers or non-adherence to the experimental instruction (n = 68) differed from those participants who were included in the final sample (n = 165). No statistically significant differences were found in participants’ education (χ2 = 5.35, p = .136, Cramer’s V = .15), and age (t = 1.74, p = .083, d = 0.25, 95% CI [–0.03; 0.54]), or prior cumulative reading experience (t = –1.55, p = .124, d = –0.22, 95% CI [–0.51; 0.06]). However, we found a significant difference in gender (χ2 = 6.39, p = .015, Φ–.17, 95% CI [–.31; –.02]) between the two groups, with men being over-represented in the group of participants who were excluded due to non-adherence or outliers (28% to 13%). Importantly, gender was equally distributed across experimental conditions and was thus not included as a covariate in the analyses. For transparency, the results of the analysis including gender as an additional factor are included as supplemental materials (see Table S5).
Taking experimental condition and time between pre- and posttest into account, there was also a significant difference in transportation at the posttest (t = –2.49, p = .014, d = –0.39, 95% CI [–0.70; –0.08]), with non-adherent participants and participants removed due to outliers showing lower transportation (M = 4.55 vs. M = 4.94). Importantly, however, this difference did not interact with experimental condition (t = –0.30, p = .768, d = –0.09, 95% CI [–0.66; 0.49]), with excluded participants reporting lower transportation in the fictional TV series condition (M = 5.07 vs. M = 5.50) and the documentary condition (M = 4.04 vs. M = 4.38).
All three social-cognitive measures showed moderate to high stability (theory of mind: r12 = .54, p < .001, 95% CI [.42; .64], r13 = .51, p < .001, 95% CI [.39; .62], r23 = .55, p < .001, 95% CI [.43; .65]; empathy: r12 = .80, p < .001, 95% CI [.73; .85], r13 = .77, p < .001, 95% CI [.70; .83], r23 = .89, p < .001, 95% CI [.85; .91]; media-based empathy: r12 = .89, p < .001, 95% CI [.85; .92], r13 = .84, p < .001, 95% CI [.78; .88], r23 = .88, p < .001, 95% CI [.84; .91]). Self-reported empathy and self-reported media-based empathy were strongly correlated at pretest (r = .67, p < .001, 95% CI [.57; .74]), posttest (r = .69, p < .001, 95% CI [.60; .76]), and follow-up (r = .71, p < .001, 95% CI [.63; .78]). In contrast, theory-of-mind performance and self-reported empathy were not significantly and only weakly correlated at pretest (r = .09, p = .260, 95% CI [–.07; .24]), posttest (r = .12, p = .128, 95% CI [–.03; .27]), and follow-up (r = .12, p = .141, 95% CI [–.04; .26]). A similar pattern emerged for the correlation between theory-of-mind performance and self-reported media-based empathy at pretest (r = .09, p = .259, 95% CI [–.07; .24]), posttest (r = .16, p = .041, 95% CI [.01; .30]), and follow-up (r = .07, p = .404, 95% CI [–.09; .22]).
Self-reported empathy was not significantly correlated with cumulative reading experience (r = .10, p = .213, 95% CI [–.06; .25]) but theory-of-mind performance and self-reported media-based empathy showed small correlations (theory of mind: r = .17, p = .026, 95% CI [.02; .32]; empathy: r = .18, p = .019, 95% CI [.03; .33]).
Effects on Theory of Mind
We found a significant effect of time (Table 4: ToM Model 1 and Figure 3). Pairwise contrasts indicated that theory-of-mind performance increased slightly from pretest to follow-up, t(324) = 2.61, p = .010, d = 0.20, 95% CI [0.05; 0.35], whereas no significant differences were found between pretest and posttest, t(324) = 1.32, p = .187, d = 0.10, 95% CI [–0.05; 0.25], or posttest and follow-up, t(324) = 1.29, p = .199, d = 0.10, 95% CI [–0.05; 0.25]. However, contrary to the hypothesis, the interaction effect between time and condition was not significant, dpost-pre = –0.16, 95% CI [–0.47; 0.14], dfol-pre = –0.04, 95% CI [–0.35; 0.26], dfol-post = 0.12, 95% CI [–0.19; 0.42] (fictional TV series minus documentary). The test of inferiority against the smallest effect size of interest (d = 0.235) was significant for the interaction between time and condition (pretest to posttest: p = .005; pretest to follow-up: p = .036), indicating that the effect sizes were significantly smaller than the effect size of interest.
Table 4
Effects of Experimental Condition on Theory of Mind, Empathy, and Media-Based Empathy in Study 2, Controlling for Time between Pretest and Posttest.
| PREDICTORS | ToM MODEL 1 | ToM MODEL 2 | EMP MODEL 1 | EMP MODEL 2 | MEDIA EMP MODEL 1 | MEDIA EMP MODEL 2 | ||||||||||||
|---|---|---|---|---|---|---|---|---|---|---|---|---|---|---|---|---|---|---|
| ESTIMATES (CI) | t (df) | p | ESTIMATES (CI) | t (df) | p | ESTIMATES (CI) | t (df) | p | ESTIMATES (CI) | t (df) | p | ESTIMATES (CI) | t (df) | p | ESTIMATES (CI) | t (df) | p | |
| (Intercept) | 24.80 (24.36–25.25) | 111.09 (161) | <.001 | 24.76 (24.25–25.28) | 95.22 (157) | <.001 | 3.75 (3.69–3.82) | 120.04 (161) | <.001 | 3.68 (3.61–3.75) | 104.06 (157) | <.001 | 3.90 (3.83–3.96) | 112.66 (161) | <.001 | 3.80 (3.72–3.88) | 96.50 (157) | <.001 |
| Condition | –0.26 (–0.70–0.18) | –1.15 (161) | .251 | –0.72 (–1.24––0.21) | –2.78 (157) | .006 | –0.02 (–0.08–0.05) | –0.52 (161) | .605 | –0.10 (–0.17––0.03) | –2.84 (157) | .005 | –0.02 (–0.08–0.05) | –0.44 (161) | .664 | –0.09 (–0.17––0.01) | –2.30 (157) | .022 |
| Time2 | 0.00 (–0.29–0.29) | 0.02 (324) | .984 | –0.02 (–0.37–0.34) | –0.09 (316) | .932 | 0.02 (0.00–0.04) | 2.06 (324) | .040 | 0.02 (–0.01–0.04) | 1.32 (316) | .189 | 0.01 (–0.01–0.03) | 1.13 (324) | .260 | 0.01 (–0.01–0.04) | 0.90 (316) | .371 |
| Time3 | 0.33 (0.04–0.62) | 2.25 (324) | .025 | 0.29 (–0.06–0.65) | 1.61 (316) | .108 | 0.01 (–0.01–0.03) | 0.69 (324) | .490 | 0.00 (–0.02–0.03) | 0.36 (316) | .717 | –0.04 (–0.06––0.02) | –3.67 (324) | <.001 | –0.05 (–0.08––0.03) | –4.16 (316) | <.001 |
| Condition × Time 2 | –0.16 (–0.46–0.14) | –1.05 (324) | .293 | –0.10 (–0.45–0.26) | –0.55 (316) | .586 | –0.00 (–0.02–0.02) | –0.10 (324) | .919 | –0.00 (–0.03–0.02) | –0.13 (316) | .895 | 0.03 (0.01–0.05) | 2.57 (324) | .011 | 0.01 (–0.01–0.04) | 1.18 (316) | .240 |
| Condition × Time 3 | 0.04 (–0.26–0.34) | 0.28 (324) | .782 | 0.04 (–0.32–0.39) | 0.21 (316) | .833 | 0.00 (–0.02–0.03) | 0.36 (324) | .719 | –0.00 (–0.03–0.02) | –0.30 (316) | .764 | –0.00 (–0.03–0.02) | –0.42 (324) | .676 | –0.01 (–0.03–0.02) | –0.64 (316) | .520 |
| Transportation | 0.88 (0.37–1.39) | 3.43 (157) | .001 | 0.15 (0.08–0.22) | 4.34 (157) | <.001 | 0.13 (0.06–0.21) | 3.42 (157) | .001 | |||||||||
| Condition × Transportation | 0.03 (–0.48–0.53) | 0.10 (157) | .919 | 0.12 (0.05–0.19) | 3.54 (157) | .001 | 0.16 (0.09–0.24) | 4.21 (157) | <.001 | |||||||||
| Time 2 × Transportation | –0.09 (–0.43–0.25) | –0.54 (316) | .591 | 0.00 (–0.02–0.03) | 0.17 (316) | .864 | 0.02 (–0.00–0.05) | 1.97 (316) | .050 | |||||||||
| Time 3 × Transportation | 0.02 (–0.32–0.36) | 0.11 (316) | .909 | 0.02 (–0.01–0.04) | 1.16 (316) | .245 | 0.01 (–0.02–0.03) | 0.46 (316) | .646 | |||||||||
| Condition × Time 2 × Transportation | 0.06 (–0.29–0.41) | 0.32 (316) | .752 | 0.01 (–0.01–0.04) | 0.87 (316) | .388 | –0.00 (–0.03–0.02) | –0.08 (316) | .938 | |||||||||
| Condition × Time 3 × Transportation | 0.04 (–0.31–0.39) | 0.20 (316) | .842 | 0.00 (–0.02–0.03) | 0.35 (316) | .726 | 0.03 (0.00–0.05) | 2.10 (316) | .036 | |||||||||
| Random Effects | ||||||||||||||||||
| Residual Variance | 5.40 | 5.46 | 0.03 | 0.03 | 0.03 | 0.03 | ||||||||||||
| Intercept Variance | 6.08 id | 5.47 id | 0.14 id | 0.12 id | 0.18 id | 0.16 id | ||||||||||||
| ICC | .53 | .50 | .83 | .80 | .87 | .86 | ||||||||||||
| N | 165 id | 165 id | 165 id | 165 id | 165 id | 165 id | ||||||||||||
| Observations | 495 | 495 | 495 | 495 | 495 | 495 | ||||||||||||
| Marginal R2/Conditional R2 | .017/.537 | .084/.542 | .011/.828 | .137/.830 | .012/.874 | .133/.878 | ||||||||||||
[i] Note. CI = 95% confidence interval. Time span between pre- and posttest and all two-way and three-way interactions with the predictors (condition, time, and transportation) were included in the model but are not displayed to enhance readability of the table. Categorical variables were effect-coded (Time: pretest = –1, posttest = 1, follow-up = 1; Condition: documentary = –1, fictional TV series = 1). Continuous predictors (transportation, time between pre- and posttest) were mean-centered. A square-root transformation was applied to time between pre- and posttest because the data were positively skewed.
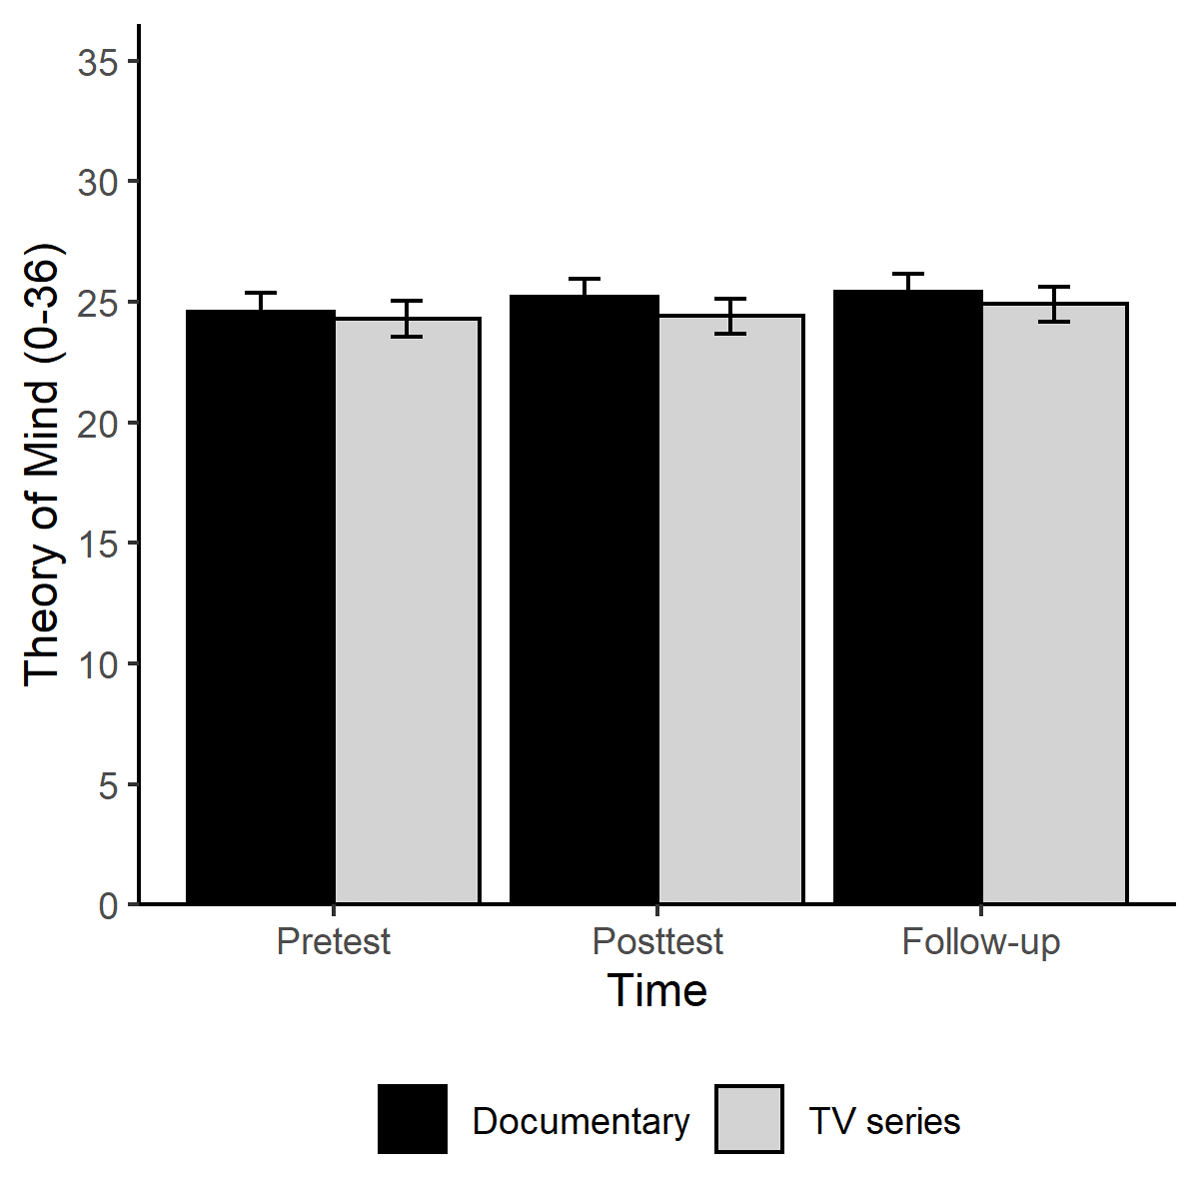
Figure 3
Effect of Experimental Condition on Theory of Mind in Study 2.
Note: Error bars represent 95% confidence intervals. Time span between pre- and posttest and all two-way and three-way interactions with the predictors are included as covariates.
Effects on Empathy
As can be seen from Table 4 (Empathy Model 1) and Figure 4, there was a significant effect of time in self-reported empathy. Pairwise contrasts indicated that self-reported empathy increased slightly from pretest to posttest, t(324) = 2.78, p = .006, d = 0.13, 95% CI [0.04; 0.22] and from pretest to follow-up, t(324) = 1.99, p = .048, d = 0.09, 95% CI [–0.00; 0.18], whereas no significant difference was found between posttest and follow-up, t(324) = –0.79, p = .429, d = –0.04, 95% CI [–0.13; 0.05]. However, the hypothesized interaction effect between time and condition was not significant: dpost-pre = 0.01, 95% CI [–0.18; 0.19], dfol-pre = 0.03, 95% CI [–0.15; 0.22], dfol-post = 0.03, 95% CI [–0.16; 0.21] (fictional TV series minus documentary). The test of inferiority against the smallest effect size of interest (d = 0.235) was significant for the interaction effect between time and condition (from pretest to posttest: p = .008; from pretest to follow-up: p = .016), indicating that the effect sizes were significantly smaller than the effect size of interest.
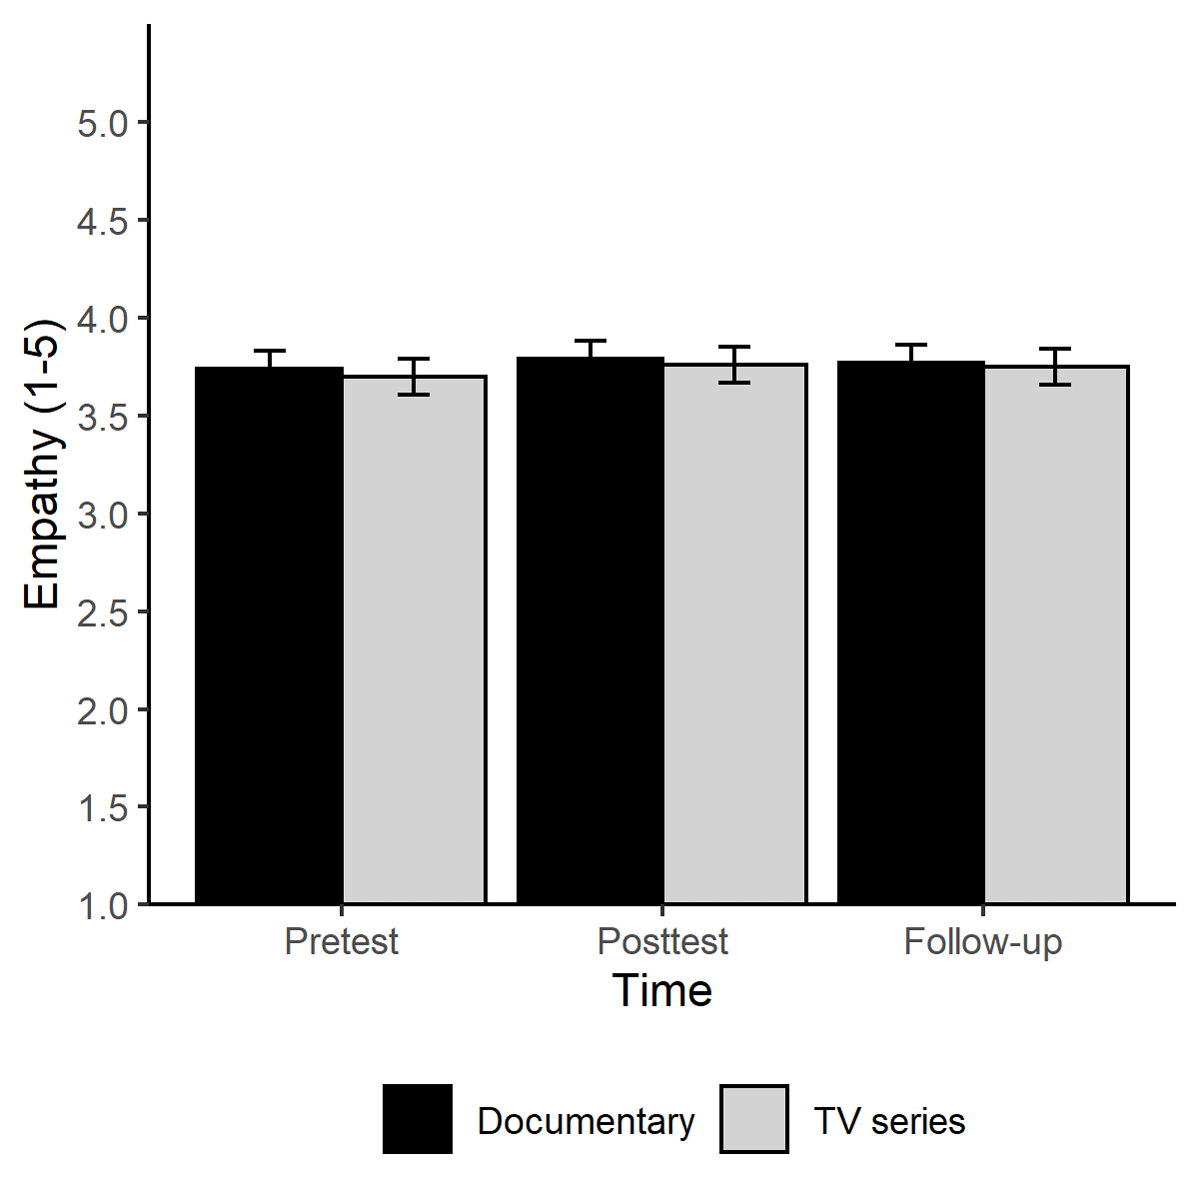
Figure 4
Effect of Experimental Condition on Empathy in Study 2.
Note: Error bars represent 95% confidence intervals. Time span between pre- and posttest and all two-way and three-way interactions with the predictors are included as covariates.
Effects on Media-Based Empathy
We found a significant effect of time in media-based empathy (Table 4: Media-Based Empathy Model 1 and Figure 5). Pairwise contrasts indicated that self-reported media-based empathy decreased slightly from pretest to follow-up, t(324) = –3.58, p < .001, d =–0.14, 95% CI [–0.22; –0.06], and from posttest to follow-up, t(324) = –2.77, p = .006, d = –0.11, 95% CI [–0.19; –0.03], whereas no significant difference was found between pretest and posttest, t(324) = –0.81, p = .416, d = –0.03, 95% CI [–0.11; 0.05]. In addition, we found a significant interaction effect between time and condition for the time span from pretest to posttest favoring the fictional TV series condition, t(324) = 2.73, p = .007, d =0.22, 95% CI [0.06; 0.38], but the other comparisons were statistically not significant, dfol-pre = 0.08, 95% CI [–0.08; 0.24], dfol-post = –0.14, 95% CI [–0.30; 0.02] (fictional TV series minus documentary). However, contrary to the hypothesis, pairwise contrasts indicated that no significant change occurred in self-reported media-based empathy in the fictional TV series condition from pretest to posttest, t(324) = 1.39, p = .165, d = 0.08, 95% CI [–0.03; 0.19] but media-based empathy slightly decreased in the documentary condition in this time span, t(324) = –2.50, p = .013, d = –0.14, 95% CI [–0.25; –0.03] (see Figure 5). The test of inferiority against the smallest effect size of interest (d = 0.235) was not significant for the interaction effect between time and condition from pretest to posttest (p = .421), but a significant interaction effect between time and condition was found from pretest to follow-up (p = .027), indicating that the latter effect size was significantly smaller than the effect size of interest.
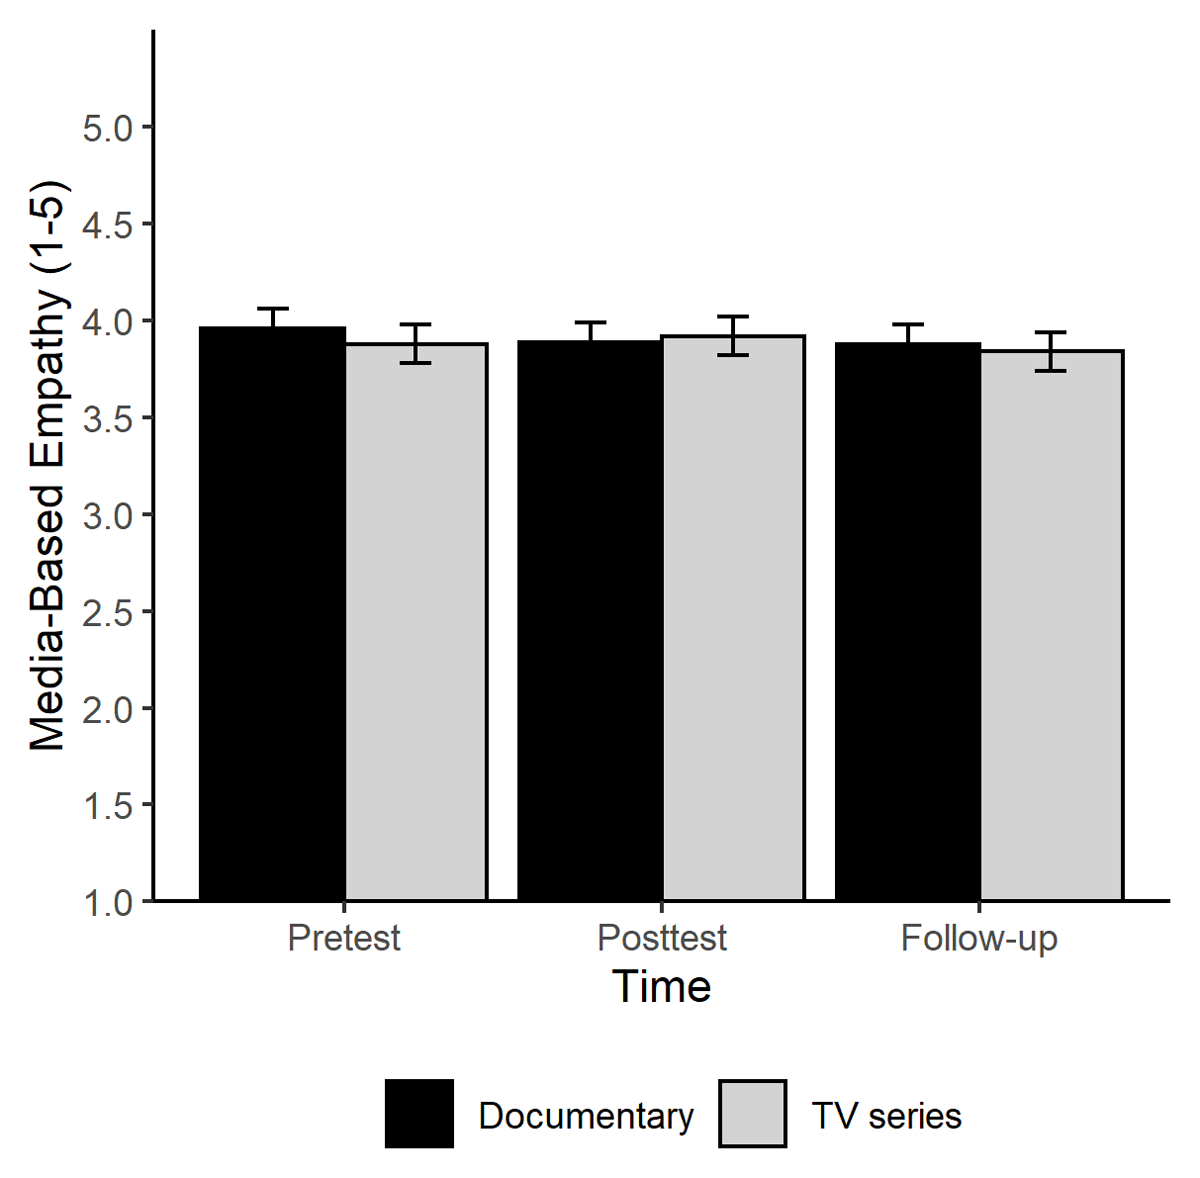
Figure 5
Effect of Experimental Condition on Media-Based Empathy in Study 2.
Note: Error bars represent 95% confidence intervals. Time span between pre- and posttest and all two-way and three-way interactions with the predictors are included as covariates.
Examining Transportation as Moderator Variable
Transportation had a main effect on theory-of-mind performance and self-reported empathy (see Table 4, ToM Model 2 and Empathy Model 2). However, transportation had no moderating effect. A different pattern emerged with self-reported media-based empathy. Again, transportation had a significant main effect on self-reported media-based empathy. However, a significant three-way interaction emerged between condition, time, and transportation (see Table 4, Media-Based Empathy Model 2). Transportation moderated the effect of condition over time on self-reported media-based empathy, with highly transported participants in the fictional TV series condition showing a less pronounced decrease (but no increase) of self-reported media-based empathy from pretest to follow-up.
Exploratory Analyses: Participants’ Attention to the Experimental Stimuli
To check for the possibility that participants’ attention to the experimental stimuli might have affected the outcomes, we reran all analyses with the score on the control questions included as additional factor (2 vs. 3 control questions solved correctly; note that only participants who answered at least 2 out of 3 control questions correctly were included in the final sample). The score on the control questions did not significantly affect the interaction effect condition × time (ToM: posttest: p = .439, follow-up: p = .473; Empathy: posttest: p = .656, follow-up: p = .152; Media-Based Empathy: posttest: p = .905, follow-up: p = .958) or the three-way interaction with transportation (ToM: posttest: p = .959, follow-up: p = .107; Empathy: posttest: p = .439, follow-up: p = .307; Media-Based Empathy: posttest: p = .918, follow-up: p = .971).
Discussion
In Study 2, we used a naturalistic pre-post follow-up design to investigate the effects of watching a fictional TV series (This Is Us) compared to a nonfiction documentary and to examine transportation as a moderator variable. We found that performance in the theory-of-mind task slightly increased from pretest to follow-up irrespective of condition. In addition, self-reported empathy slightly increased from pre- to posttest irrespective of the condition. In contrast, self-reported media-based empathy slightly decreased from pretest to follow-up. Although we found no general decrease from pre- to posttest in media-based empathy, the scores were modified by an interaction with condition. Participants in the fictional TV series condition showed stable values whereas participants in the nonfiction documentary reported slightly lower values in this time span. Again, we found no evidence for a moderator effect of transportation into the stories on theory-of-mind performance and self-reported empathy. However, transportation moderated the effect of condition on self-reported media-based empathy across time, with highly transported participants showing no decrease in media-based empathy in the fictional TV series condition.
Study 3
Although the two naturalistic online studies used controls to ensure that the participants had watched the fictional TV series or documentaries as instructed, namely comprehension questions and self-report questions on adherence, we could not directly ensure that participants had paid attention to the content of the fictional and documentary TV material. Therefore, we added data from a third study, which had already been conducted in a controlled lab setting, to address this problem of the naturalistic online studies.1 In addition, the lab study measured the social-cognitive measures directly after presenting the last episode and increased the amount of TV exposure from three to five episodes to increase any potentially differential effects of exposure to fictional TV series.
Method
Sample
Participants were recruited by advertising in social media and by flyers at the University of Würzburg. Participants could receive study credits for their participation. All participants consented to participate and confirmed by signature that they had read and understood the study information (procedure, data protection, voluntary participation, etc.) before they started the study.
After excluding two participants who had already watched either the fictional TV series or the documentary and one participant who could only participate at the pretest, the final sample consisted of 46 participants (36 females, 10 males) with a mean age of 25.41 years (SD = 8.79; range = 18 to 58 years) (see Table 5). Most participants reported a higher education entrance qualification or university degree (87%) as their highest educational level.
Table 5
Descriptive Statistics in Study 3.
| VARIABLES | FINAL SAMPLE (N = 46) | TV SERIES (n = 23) | DOCUMENTARY (n = 23) | |||
|---|---|---|---|---|---|---|
| M | SD | M | SD | M | SD | |
| Gender (female) | 36 (78%) | 18 (78%) | 18 (78%) | |||
| Education | ||||||
| High track | 40 (87%) | 21 (91%) | 19 (83%) | |||
| Other Tracks | 6 (13%) | 3 (9%) | 5 (17%) | |||
| Age (years) | 25.41 | 8.80 | 23.78 | 8.10 | 27.04 | 9.33 |
| Theory of Mind RMET (t1) | 26.52 | 3.78 | 26.83 | 3.10 | 26.22 | 4.41 |
| Theory of Mind RMET (t2) | 27.00 | 3.20 | 26.57 | 3.26 | 27.43 | 3.16 |
| Theory of Mind MASC (t2) | 36.33 | 3.43 | 35.83 | 3.56 | 36.83 | 3.28 |
| Empathy (t1) | 3.84 | 0.46 | 3.71 | 0.41 | 3.96 | 0.48 |
| Empathy (t2) | 3.89 | 0.46 | 3.83 | 0.46 | 3.95 | 0.45 |
| Enjoyment of Experimental Stimulus | 1.91 | 0.96 | 1.57 | 0.84 | 2.26 | 0.96 |
[i] Note. The educational system in Germany comprises three high-school tracks in secondary school: Haupt-/Mittelschule (low track), Realschule (middle track), Gymnasium (high track), with only the latter track qualifying for university entrance.
A post-hoc sensitivity analysis with G*Power (version 3.1.9.7; Faul et al., 2009; α = .05, 1–β = .80) indicated that 46 participants (23 per group) were sufficient to detect an interaction effect of f = 0.21 (which corresponds to d = 0.42) in a 2 × 2 mixed ANOVA. This corresponds to the effect size of d = 0.43, which was reported by Black and Barnes (2015) for their two lab studies. In addition, a post-hoc sensitivity analysis indicated that 46 participants were sufficient to detect an effect of d = 0.74 for a one-tailed two-independent-samples t-test, which is considerably larger than the effect size reported by Black and Barnes (2015).
Design
Study 3 was based on a 2 × 2 mixed experimental design, with measurement point (pre- vs. posttest) representing a within-subjects factor and experimental condition (documentary vs. fictional TV series) representing a between-subjects factor. However, one of the dependent variables (the Movie for the Assessment of Social Cognition; MASC; Dziobek et al., 2006) could only be assessed at the post-test, resulting in a one-factorial between-subjects (documentary vs. fictional TV series) design for this dependent variable.
Experimental Stimuli
In the fictional TV series condition, participants watched five episodes of This Is Us (Season 1, Episodes 1 to 5). In the non-fictional documentary condition, participants watched three episodes of Wildes Skandinavien (Wild Scandinavia, Episodes 1, 2, 3, 5, and 6).
Measures
Demographics
Participants provided information on their age (in years), their gender, and their highest educational level.
Theory of Mind
Like in Study 1 and 2, the German adaption by Bölte (2005) of the Reading the Mind in the Eyes Test (RMET; Baron-Cohen et al., 2001) was used to assess theory of mind. Internal consistency was low at the pretest (Cronbach’s α = .57) and at the posttest (Cronbach’s α = .42).
In addition, the Movie for the Assessment of Social Cognition (MASC; Dziobek et al., 2006) was used to assess theory of mind at the posttest. The participants watched a short film during which they had to answer 45 questions targeting the characters’ thoughts, intentions, and feelings. The questions were multiple-choice single-response items with four options and a single correct answer. Internal consistency was low (Cronbach’s α = .48).
Empathy
Like in Study 1 and 2, the Saarbrücker Persönlichkeitsfragebogen (IRI-S D, V 7.0; Paulus, 2019), a German adaption of the Interpersonal Reactivity Index (IRI; Davis, 1980) was used to assess trait empathy. Following the rationale in Mumper and Gerrig’s (2017) meta-analysis for the calculation of trait empathy, only the subscales Perspective Taking and Empathic Concern were collected. For distraction, the items were randomly mixed with items from the 10 item Big Five Inventory (BFI–10; Rammstedt & John, 2007), which were not further analyzed in the present study. Internal consistency was acceptable at the pretest (Cronbach’s α = .72) and at the posttest (Cronbach’s α = .74).
Control Questions and Enjoyment
To ensure that participants had diligently watched the episodes of the fictional TV series or the documentary that was assigned to them, nine easy comprehension questions relating to the episodes were asked. The questions were presented in the single-response format with two options (true-false), with 4.5 representing the chance level. In addition, we asked participants at the posttest how much they enjoyed watching the TV series or documentary that they had watched during the experiment (1 = very much to 5 = not at all).
Procedure
The study consisted of four sessions per participant, which took place in a quiet room at the University of Würzburg and spanned across 7 to 10 days. Importantly, all sessions were conducted individually and no distractions were allowed (e.g., cell phone had to be switched off). In the first session, the participants received information concerning the study (procedure, data protection, voluntary participation, etc.). This was followed by demographic questions. Then they were pretested with the IRI-S D and the RMET, after which they were randomly assigned to one of the two conditions. After one or two days, the second session took place, in which they watched the first two episodes of their condition and answered three control questions. After another one or two days, the third session took place, in which they watched the next two episodes and answered three control questions. Finally, after another one or two days, the fourth session took place, in which the participants watched a fifth episode, answered three control questions, completed the dependent variables (IRI-S D, RMET, and MASC), answered a question on their enjoyment of the episodes and were debriefed.
Data Preparation and Statistical Analyses
Participants were excluded if they had watched any of the two experimental stimuli prior to the study (n = 2), if they did not adhere to the study protocol or answered fewer than five control questions correctly (n = 0), or if they did not finish the study (n = 1). After applying these exclusion criteria, the final sample consisted of 46 subjects (fiction condition: n = 23; non-fiction condition: n = 23). The approach to data analysis was the same as in Study 1 and 2. However, due to the small sample size in Study 3, the tests of inferiority were not applied.
Results
Preliminary Analyses
Descriptive statistics for the whole sample and the experimental conditions are displayed in Table 5. We found no indication of floor or ceiling effects in any of the dependent or moderator variables and no statistically significant differences between the experimental conditions in any of the demographic variables (gender: χ2 = 0.00, p > .999, Φ = .00, 95% CI [–.30; .29], educational background: χ2 = 2.00, p > .999, age: t = –1.27, p = .212, d = –0.37, 95% CI [–0.97; 0.23]), and the dependent variables at the pretest (theory of mind RMET: t = 0.54, p = .591, d = 0.16, 95% CI [–0.44; 0.76]; empathy: t = –1.89, p = .065, d = –0.56, 95% CI [–1.16; 0.05]. However, the participants who watched the fictional TV series provided significantly higher ratings of enjoyment of the experimental stimuli at the posttest than the participants who watched the documentary, t = –2.61, p = .013, d = –0.77, 95% CI [–1.38; –0.15].
Effects on Theory of Mind
Concerning the RMET, we found no significant main effects of time or experimental condition and no significant interaction effect between time and condition (Table 6: ToM Model 1). Descriptively, the change from pretest to posttest was even larger in the documentary condition than in the fictional TV series condition, dpost-pre = –0.42, 95% CI [–1.00; 0.16] (fictional TV series minus documentary).
Table 6
Effects of Experimental Condition on Theory of Mind and Empathy in Study 3.
| PREDICTORS | ToM MODEL 1 (RMET) | ToM MODEL 2 (MASC) | EMP MODEL 1 | ||||||
|---|---|---|---|---|---|---|---|---|---|
| ESTIMATES (CI) | t (df) | p | ESTIMATES (CI) | t (df) | p | ESTIMATES (CI) | t (df) | p | |
| (Intercept) | 26.76 (25.85–27.67) | 59.05 (44) | <.001 | 36.33 (35.31–37.34) | 71.90 (44) | <.001 | 3.86 (3.73–3.99) | 59.58 (44) | <.001 |
| Condition | –0.07 (–0.98–0.85) | –0.14 (44) | .886 | –0.50 (–1.52–0.52) | –0.99 (44) | .328 | –0.09 (–0.22–0.04) | –1.45 (44) | .155 |
| Time | 0.24 (–0.27–0.75) | 0.94 (44) | .352 | 0.03 (–0.01–0.06) | 1.62 (44) | .112 | |||
| Condition × Time | –0.37 (–0.88–0.14) | –1.45 (44) | .153 | 0.03 (–0.00–0.06) | 1.96 (44) | .056 | |||
| Random Effects | |||||||||
| Residual Variance | 5.94 | 0.02 | |||||||
| Intercept Variance | 6.48 id | 0.18 id | |||||||
| ICC | .52 | .89 | |||||||
| N | 46 id | 46 id | |||||||
| Observations | 92 | 46 | 92 | ||||||
| Marginal R2/Conditional R2 | .016/.529 | .022/–.000 | .049/.892 | ||||||
[i] Note. RMET = Reading the Mind in the Eyes Test; MASC = Movie for the Assessment of Social Cognition; CI = 95% confidence interval. Categorical variables were effect-coded (Time: pretest = –1, posttest = 1; Condition: documentary = –1, fictional TV series = 1).
Concerning the MASC, there was no significant main effect of experimental condition (Table 6: ToM Model 2). Descriptively, the participants in the documentary condition had even higher MASC scores than the participants in fictional TV series condition, d = –0.29, 95% CI [–0.90; 0.31] (fictional TV series minus documentary).
Effects on Empathy
We found no significant main effects of time or experimental condition and no significant interaction effect between time and condition (Table 6: Emp Model 1). Descriptively, the change from pretest to posttest was larger in the fictional TV series condition than in the documentary condition, dpost-pre = 0.28, 95% CI [–0.01; 0.56] (fictional TV series minus documentary). Although this indicates a descriptive trend in the expected direction, it has to be noted that the participants in the narrative condition started at a lower level of trait empathy and did not reach the level of the participants in the documentary condition at the posttest (see Table 5).
Exploratory Analyses: Participants’ Attention to the Experimental Stimuli
To check for the possibility that participants’ attention to the experimental stimuli might have affected the outcomes, we checked the score on the control questions for each condition. As the score was perfect for all participants in the fictional TV series condition (M = 9) and nearly perfect in the documentary condition (M = 8.61, SD = 0.66, range: 7 to 9), participants’ attention measured via the control questions could not have affected the outcomes of the study. Moreover, we redid the analyses with participants’ ratings of enjoyment of the experimental stimuli. Participants’ enjoyment did not moderate the effect of watching fictional TV series on Theory of Mind (RMET: p = .314; MASC: p = .599) and empathy (p = .669).
Discussion
With Study 3, we added a small, well-controlled lab experiment to address a limitation of the naturalistic online studies, namely that these studies could not ascertain that the participants watched the TV series attentively. In addition, we increased the exposure from three to five episodes and conducted the posttest directly after watching the final episode. The results were similar to the naturalistic online studies. We found no statistically significant effect of watching several episodes of the fictional TV series This Is Us on participants’ social-cognitive competences.
General Discussion
In two naturalistic online studies and a small lab study, participants either watched several episodes of a fictional TV series or of a nonfiction documentary. We examined whether exposure to fictional narrative content in audiovisual form, which features human interaction, thoughts, and feelings, improves social-cognitive skills (empathy, theory of mind) in comparison to exposure to a nonfiction documentary control condition that features no human interaction. Additionally, we examined whether narrative processes such as transportation into the stories or identification with story characters would moderate any potential effects of fictional TV series. We found no statistically significant beneficial effects of exposure to selected fictional TV series (Study 1: Dietland or The Expanse, Study 2 and 3: This Is Us) in support of these hypotheses, neither as main effects nor in the form of interaction effects with narrative processes such as narrative transportation and identification. Furthermore, the effect sizes for differential effects of fictional TV series versus nonfiction documentaries were in the two naturalistic online studies descriptively only very small to small (d = –0.11 to d = 0.18 in Study 1; d = –0.16 to d = 0.22 in Study 2) and in lab studies small to medium (d = –0.42 to d = 0.28 in Study 3). They provided no consistent picture in favor of any of the two conditions. In addition, inferiority tests (Lakens et al., 2018) largely indicated that the effects in our studies were significantly smaller than those observed in previous laboratory studies (Black & Barnes, 2015). In Black and Barnes’s (2015) study, the participants showed higher theory-of-mind performance, as indicated by better results in the Reading the Mind in the Eyes Test (Baron-Cohen et al., 2001), after watching parts of episodes (Study 1) or a full episode (Study 2) of an award-winning TV series (in both experiments, d = 0.43).
At first glance, the results of the present study and the Black and Barnes (2015) study seem to be irreconcilable. However, a main difference between our naturalistic online studies and Black and Barnes’s study had been the interval between watching the TV stimuli and conducting the posttest. In Black and Barnes’s study, the posttest was conducted immediately (or only some minutes) after watching the TV stimuli, which might capture a so-called resonance or priming effect of social-cognitive skills that might influence subsequent processing of social stimuli (Mumper & Gerrig, 2019; Panero et al., 2016). Some authors argue that a limited exposure to a narrative stimulus cannot improve socio-cognitive skills, but when confronted with characters’ thoughts and feelings and their interactions with other individuals, corresponding content in long-term memory might become activated and influence subsequent processing of social information, resulting in a priming effect that only temporarily improves social-cognitive task performance (Mumper & Gerrig, 2019; Panero et al., 2016). In the present online studies, the posttest did not take place immediately after watching the last episode of the assigned TV stimulus because we were not interested in a short-lived priming effect but targeted improvements in social-cognitive skills that persist at least several hours to days after watching a fictional TV series. Accordingly, a brief narrative exposure in the form of a fictional TV series might temporarily increase social-cognitive skills in terms of a priming effect. However, contradicting this explanation for different findings in our online studies and Black and Barnes’ (2015) lab studies, we could not replicate a positive effect of watching fictional TV series in a well-controlled lab setting in Study 3. Taken together, our results suggest that a brief exposure or even an exposure of around two to three hours to the selected fictional TV series (Dietland, The Expanse, This Is Us) is unlikely to improve social-cognitive skills such as trait empathy or theory of mind in a consistent and stable manner.
Given the heterogeneity associated with findings in this research area (Dodell-Feder & Tamir, 2018), it is likely that findings are associated with characteristics of the stimuli used in the studies. Therefore, our results that are confined to three specific TV stimuli might not generalize to other fictional TV series. Accordingly, a plausible explanation for the different findings in our studies compared to the results reported by Black and Barnes (2015) might be that different stimuli were used. While Black and Barnes (2015) used only award-winning TV series, some of the TV series used in present studies did not win awards. For an effect to emerge, the effect might depend on a TV series that fulfills certain characteristics. Generic characteristics, narrativity, artistic quality (literariness, Appel et al., 2021), and psychological depth of characters and their interactions (Mar, 2018a) might all play a causal role, although all of these characteristics are complex and their effects might be difficult to disentangle. Literariness, for instance, has been suggested as a driving force in narrative effects on social-cognitive skills (e.g., Kidd & Castano, 2013). Among the features that are proposed to define literariness are high levels of phonetic, grammatical, or semantic foregrounding (i.e., striking textual features on each of these levels) that lead to a deautomatization of the reading process (Miall & Kuiken, 1994; Scapin et al., 2023), a polyphony of perspectives (Bakhtin, 2013, as cited in Lenhart et al., 2023), characters with high psychological complexity (Kidd & Castano, 2013), and meaningful gaps that need to be filled to make sense of the story (Bruner, 1986). As pointed out by Schwerin and Lenhart (2022), a common core of these perspectives is that literary stories are hypothesized to promote conscious and effortful processing of the text and its characters. However, the empirical research picture is decidedly mixed concerning potentially beneficial effects of award-winning literary fiction (e.g., Kidd & Castano, 2013, 2019; Lenhart & Richter, 2022; Lenhart et al., 2023; Panero et al., 2016; Pino & Mazza, 2016; Samur et al., 2018; van Kuijk et al., 2018), pointing to the need for a more fine-grained distinction than the often used award-winning vs. not award-winning comparison.
Currently, the standard approach in most experimental studies is to employ narrative stimuli that had been used in Kidd and Castano’s (2013) seminal Science paper (e.g., Lenhart & Richter, 2022; Panero et al., 2016; Samur et al., 2018; Schwerin & Lenhart, 2022; van Kujik et al., 2018). Kidd and Castano (2013) had selected their stimuli based on the criteria that the nonfiction condition should not feature human interaction, that the narrative stimuli featured at least two characters and represented a range of genres, and that the literary fiction texts or their authors had won awards. Similarly, Black and Barnes (2015) selected TV dramas whose first seasons had received Emmy nominations or wins across three major categories related to quality and execution of the story (i.e., writing, directing, and acting). A beneficial approach could be to conduct experiments by defining some pool of relevant narratives and sample randomly from that pool. Due to the random sampling, such methods would make it easier for studies to make claims of generality concerning their findings.
Interestingly, Pino and Mazza (2016) who used a design similar to the one used in our naturalistic online studies, in which participants were pretested, read a book at their convenience during the span of a week, and took a posttest a week after the pretest, found effects of a limited book exposure on several indicators of social-cognitive skills. As their posttest did not directly follow the book exposure, priming cannot explain the improvements. Accordingly, limited exposure might result in positive training effects on social-cognitive skills for written material. Literature is considered the most abstract of narrative forms, providing readers with a purely symbolic and nonrepresentational portrayal of the social world. Therefore, literature might require recipients to actively construct the social world more than with, for example, the multisensory and immersive nature of films and TV series (Mar & Oatley, 2008). This in turn might help better to develop competences for understanding others’ intentions, beliefs, and emotions.
Limitations and Directions for Future Research
Despite its clear and consistent results across two naturalistic online studies and a well-controlled lab study, the present work has limitations that raise questions to be clarified in future research. A first limitation, which our studies share with most other (quasi-)experiments in the field is that we used specific fictional TV series in the experimental condition and compared their effects to specific documentaries in the control condition. As already discussed, the extent that our results generalize to other audiovisual stimuli is therefore unclear.
A second limitation, which the present studies also share with most (quasi-)experimental studies in this field, is that the participants were not free to choose fictional TV series or documentaries according to their liking. This controlled method differs from so-called habitual media reception, which is typically measured with correlational approaches. In the real-world, people typically select the types and the amount of content according to their preferences, albeit with some restrictions such as access to content and time constraints. This self-selection might lead to differences in the amount and types of media exposure, with some people selecting more “beneficial” content than others. Moreover, self-selection of media might increase attention to the content and therefore help to elicit beneficial effects.
A third limitation is that we used only a limited set of measures to assess social-cognitive skills, namely two self-report measures of empathy (IRI-S D and MBE) and a performance measure of theory of mind (RMET). Although the RMET is widely used in experimental (e.g., Dodell-Feder & Tamir, 2018) and correlational research (e.g., Mumper & Gerrig, 2017), it has been repeatedly shown to have low internal consistency (e.g., Mar et al., 2006: α = .60; Meyer & Shean, 2006: α = .48; Schwerin & Lenhart, 2022: α = .40; for an extended discussion, see Black, 2019) as was found in the three (quasi-)experiments in the current study. The consistent reporting of low internal consistency calls for the development of more reliable measures to assess social-cognitive performance in adults.
A fourth limitation is that aside from instructing the participants not to watch more or fewer episodes of the fictional TV series or documentary, we had little control in the online studies over the participants’ experiences and activities between pretest, posttest, and follow-up, and we had no record of which time point they watched the experimental stimuli. Related to this issue, the levels of transportation and identification were assessed with individual varying temporal delays and not directly after watching the last episode. Thus transportation and identification reports might have been subject to memory effects. Finally, similar to most previous research (for an overview, see Dodell-Feder & Tamir, 2018), the samples in our studies were predominantly female and highly educated. Therefore, it is unclear whether our results would transfer to other populations such as males or less well-educated samples.
Conclusion
The present (quasi-)experiments found no evidence for the assumption that watching a limited amount of selected fictional TV series can reliably improve social-cognitive abilities such as trait empathy or theory of mind. Given the heterogeneity of the research field (Dodell-Feder & Tamir, 2018), it is unclear whether these findings generalize to other narrative stimuli. We believe that the research question should not be shelved just yet. In the era of Netflix and Amazon Prime, many people spend a major amount of their time watching TV series. Given the results from cross-sectional correlational research (Mumper & Gerrig, 2017) and the importance of narrative processes for story effects (Mar, 2018a), cumulative effects could occur over longer periods of time and narrative processes might help to elicit such effects. Research devoted to these questions, and preferably based on longitudinal designs, could provide meaningful answers to these open questions.
Data Accessibility Statement
The data of the three (quasi-)experiments are available in the Open Science Framework repository under this link: https://osf.io/szuw3/?view_only=1c2f9490bfce4e968abf179eccc15678.
Additional Files
The additional files for this article can be found as follows:
Table S1
Effects of Experimental Condition on Theory of Mind and Empathy in Study 1 (Only Randomized Participants). DOI: https://doi.org/10.61645/ssol.184.s1
Table S2
Effects of Experimental Condition on Theory of Mind and Empathy in Study 1 (Full Sample without Exclusion of Outliers and Non-Adherence to Instruction). DOI: https://doi.org/10.61645/ssol.184.s2
Table S3
Effects of Experimental Condition on Theory of Mind, Empathy, and Media-Based Empathy in Study 2 (Full Sample without Exclusions of Outliers and Non-Adherence to Instruction). DOI: https://doi.org/10.61645/ssol.184.s3
Table S4
Effects of Experimental Condition on Theory of Mind, Empathy, and Media-Based Empathy in Study 2 (Without covariates). DOI: https://doi.org/10.61645/ssol.184.s4
Table S5
Effects of Experimental Condition on Theory of Mind, Empathy, and Media-Based Empathy in Study 2, Including Gender as an Additional Factor. DOI: https://doi.org/10.61645/ssol.184.s5
Notes
Funding Information
Parts of this research were funded by the University of Würzburg’s internal research funding (“Anschubfinanzierung”).
Competing Interests
The authors have no competing interests to declare.
Author Contributions
JL: data curation, formal analysis, methodology, project administration, writing – original draft, writing – review & editing. TR: writing – review & editing.