
Table 1
Research Studies of Student Learning Outcomes Using OER
| College/Year | Study | Findings |
|---|---|---|
| Lovett et al. (2008) Online OER Component of Carnegie Mellon University | Measured the result of implementing an online OER component (2005-2006) | No statistically significant differences were noted. |
| Lovett et al. | Follow-up study (2007) | No statistically significant differences between traditional and online groups were noted. |
| Bowen et al. (2012) Six different undergraduate institutions | Extension of study just mentioned Note: largest of OER efficacy using randomization and comparisons of multiple learning outcomes | Students who used OER performed slightly better in terms of passing the course; differences were marginal and not statistically significant. |
| Hilton & Laman (2012) Houston Community College | Study conducted in 2011 | Students had a high GPA in the course, a lower withdrawal rate, and higher scores on the final exam; no analysis was performed to determine whether the results were statistically significant. |
| Feldstein et al. (2012) Virginia State University | Study conducted in 2010 | Students using OER had better grades and lower failure and withdrawal rates; results had statistical significance, but the two sets of courses were not the same. |
| Pawlyshyn et al. (2013) Mercy College | Study conducted in 2012 | Student learning outcomes appeared to increase; no statement of statistical significance was mentioned. |
| Hilton et al. (2013) Scottsdale Community College | Study conducted in 2012 | Differences were not statistically significant |
| Allen et al. (2015) University of California, Davis | Study conducted to test the efficacy of an OER in a general chemistry class | Researchers found no significant differences between the overall results of the two groups. |
| Robinson (2015) Seven different institutions | Study examined OER adoption, the differences in final course grade, the percentage of students who completed the course with a grade of C- or better, and the number of credit hours taken | In five of the courses, there were no statistically significant differences in terms of final grades or completion rates; students in the Business course using OER performed significantly worse, and those in a Psychology course also showed poorer results. |
| Fischer et al. (2015) | Follow-up research | In two of the 15 classes, students in the treatment group were significantly more likely to complete the course--there were no differences in the remaining 13. |
[i] Source: Hilton III, 2016
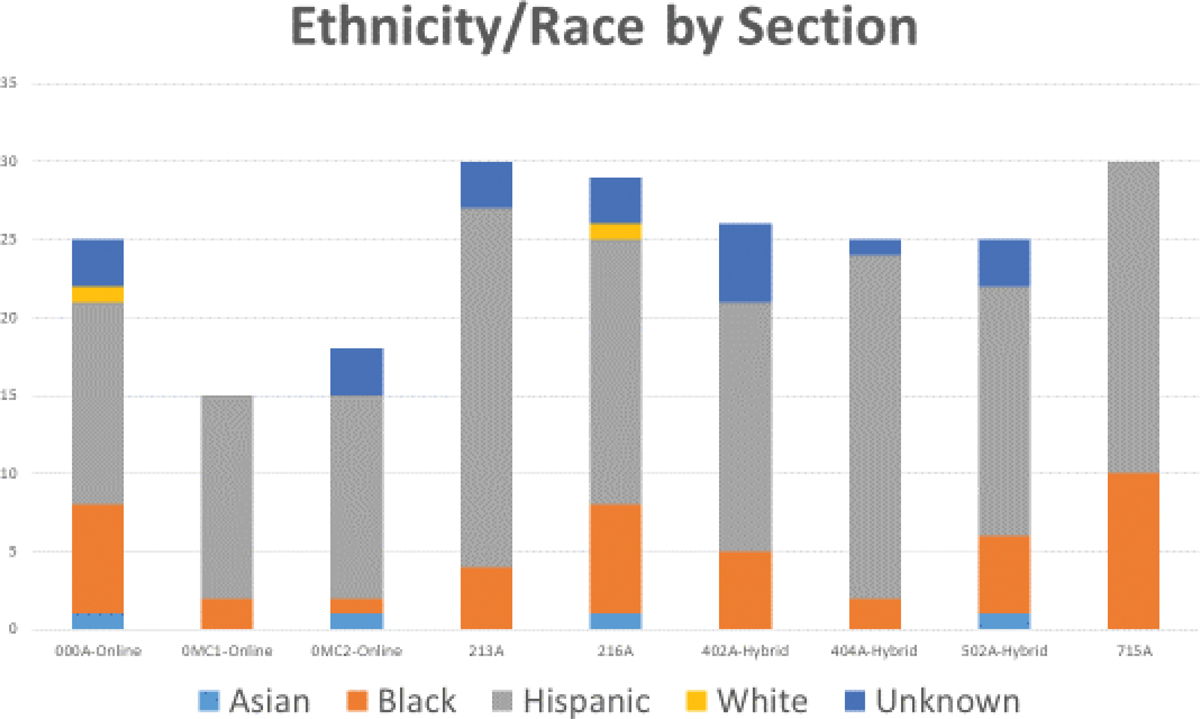
Figure 1
Ethnicity/Race by Section.
Table 2
Grading System
| Letter Grade | Range | Quantity Point Value | Explanation |
|---|---|---|---|
| A | 93 -100 | 4.0 | Exceeding Standard |
| A- | 90 - 92 | 3.7 | |
| B+ | 87 – 89 | 3.5 | Meeting Standard |
| B | 83 – 86 | 3.0 | |
| B- | 80 – 82 | 2.7 | |
| C+ | 77 – 79 | 2.3 | Approaching Standard |
| C | 70 – 76 | 2.0 | |
| D | 60 – 69 | 1.0 | Far Below Standard |
| F | Failure | 0 | Unacceptable |
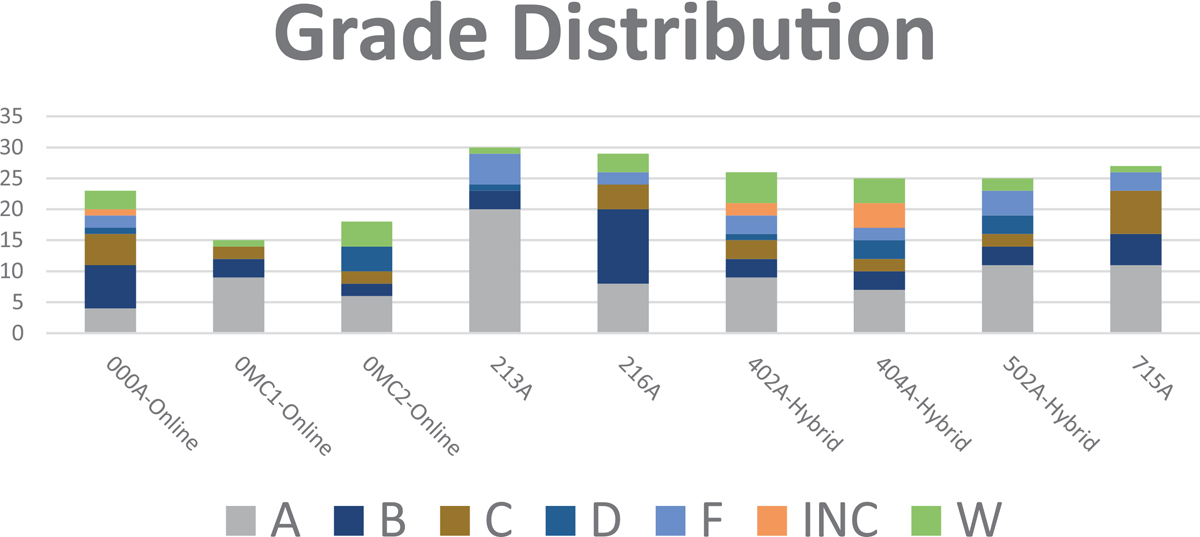
Figure 2
Grade Distribution Histogram