
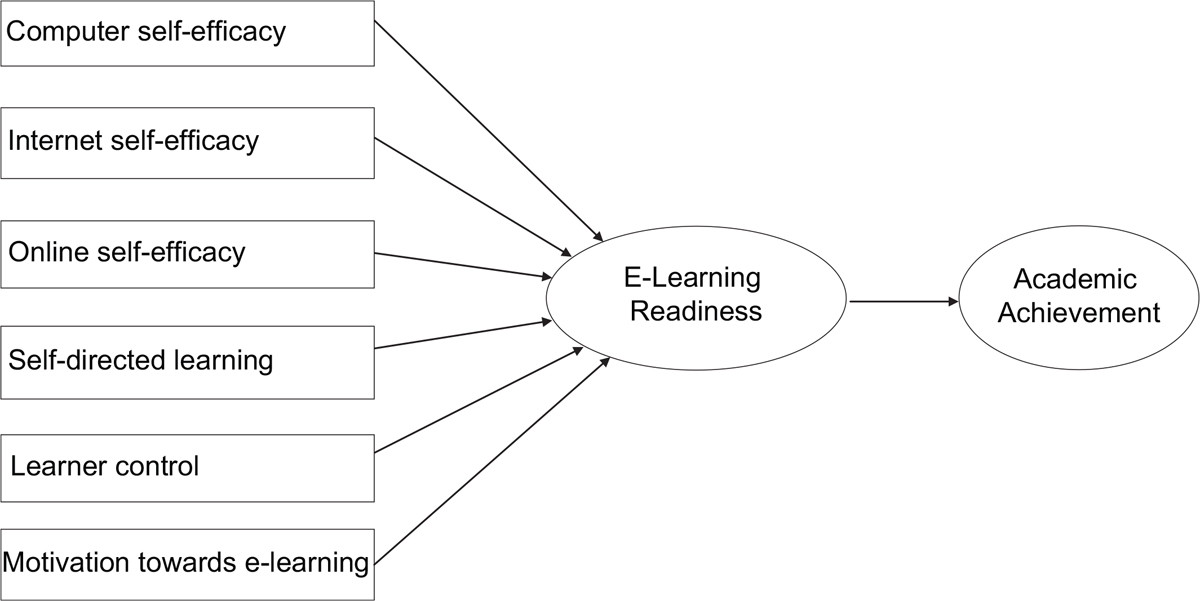
Figure 1
Hypothesized Model of Relations between E-learning Readiness and Academic Achievement.
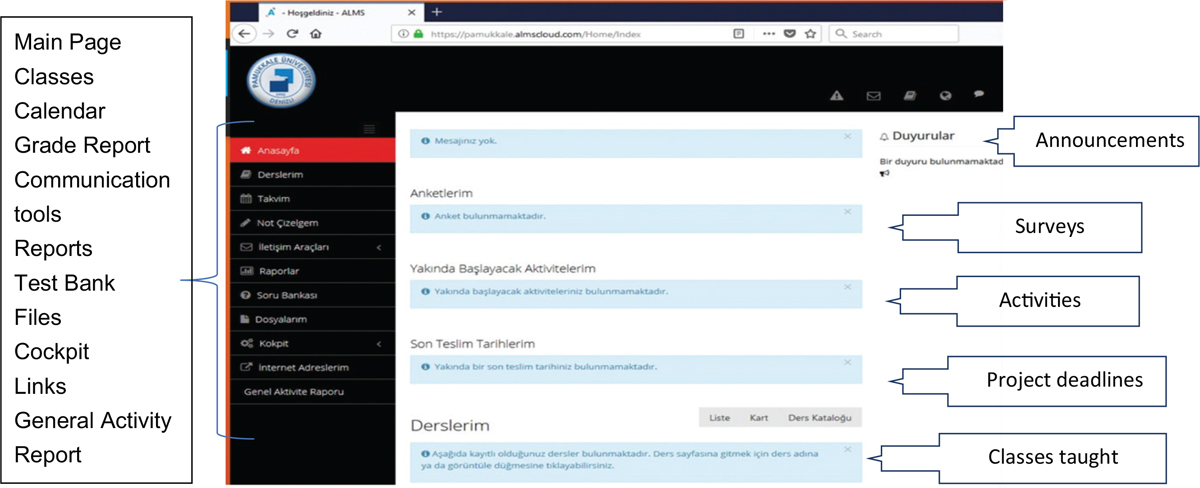
Figure 2
A Screenshot of the Online Distance Learning Student Portal.
Table 1
Demographics
| N | % | |
|---|---|---|
| Gender | ||
| Female | 79 | 51.63 |
| Male | 74 | 49.37 |
| Prior E-Learning/online course participation | ||
| None | 84 | 55.2 |
| At Least One | 69 | 44.8 |
| School | ||
| Communication | 54 | 35.29 |
| Business | 42 | 27.45 |
| Education | 34 | 22.22 |
| Engineering | 23 | 15.03 |
| Total | 153 | 100 |
Table 2
Reliability Analysis of the Subscales of the ELR
| Sub-dimensions | Cronbach’s alpha | Number of items |
|---|---|---|
| E-learning Readiness Scale | 0.81 | 33 |
| Computer self-efficacy | 0.79 | 5 |
| Internet self-efficacy | 0.86 | 4 |
| Online self-efficacy | 0.82 | 5 |
| Self-directed learning | 0.83 | 8 |
| Learner control | 0.78 | 4 |
| Motivation toward e-learning | 0.79 | 7 |
Table 3
Descriptive Statistics
| Scale | Number of items | Min. score | Max. score | X | SD | X/k |
|---|---|---|---|---|---|---|
| ELR | 33 | 33 | 231 | 153.68 | 1.12 | 4.66 |
| Computer self-efficacy | 5 | 5 | 35 | 21 | 1.36 | 4.20 |
| Internet self-efficacy | 4 | 4 | 28 | 19.08 | 1.16 | 4.77 |
| Online self-efficacy | 5 | 5 | 35 | 24.2 | 1.21 | 4.84 |
| Self-directed learning | 8 | 8 | 56 | 38.72 | 1.11 | 4.84 |
| Learner control | 4 | 4 | 28 | 15.12 | 1.27 | 3.78 |
| Motivation toward e-learning | 7 | 7 | 49 | 35.56 | 1.19 | 5.08 |
Table 4
Pearson Correlations Between Academic Achievement and E-Learning Readiness
| AA | ELR1 | ELR2 | ELR3 | ELR4 | ELR5 | ELR6 | ||
|---|---|---|---|---|---|---|---|---|
| AA | r | 1 | ||||||
| p | ||||||||
| ELR1 | r | 0.824** | 1 | |||||
| p | 0.000 | |||||||
| ELR2 | r | 0.508** | 0.492** | 1 | ||||
| p | 0.000 | 0.000 | ||||||
| ELR3 | r | 0.375** | 0.468** | 0.154 | 1 | |||
| p | 0.000 | 0.000 | 0.057 | |||||
| ELR4 | r | 0.225** | 0.283** | 0.319** | 0.391** | 1 | ||
| p | 0.005 | 0.000 | 0.000 | 0.000 | ||||
| ELR5 | r | 0.170* | 0.247** | 0.289** | 0.289** | 0.472** | 1 | |
| p | 0.036 | 0.002 | 0.000 | 0.000 | 0.000 | |||
| ELR6 | r | 0.095 | 0.112 | 0.320** | 0.085 | 0.579** | 0.498** | 1 |
| p | 0.241 | 0.169 | 0.000 | 0.295 | 0.000 | 0.000 |
ELR1: Self-directed learning, ELR2: Motivation toward e-learning, ELR3: Learner control, ELR4: Online self-efficacy, ELR5: Internet self-efficacy, ELR6: Computer self-efficacy, AA: Academic Achievement
Table 5
Pearson Correlations of AA and ELR Variables
Table 6
Regression Analysis for E-Learning Readiness in Predicting Academic Achievement
| Variables | B | SE | b | t | p |
|---|---|---|---|---|---|
| Constant | 0.249 | 0.235 | 1.057 | 0.292 | |
| Computer self-efficacy | 0.000 | 0.054 | 0.000 | 0.002 | 0.988 |
| Internet self-efficacy | -0.61 | 0.058 | -0.059 | -1.058 | 0.292 |
| Online self-efficacy | -0.20 | 0.062 | -0.020 | -3.20 | 0.750 |
| Self-directed learning | 0.820 | 0.064 | 0.758 | 12.841 | 0.000 |
| Learner control | 0.020 | 0.053 | 0.022 | 0.384 | 0.701 |
| Motivation toward e-learning | 0.157 | 0.056 | 0.155 | 2.790 | 0.006 |
Table 7
Perfect and Acceptable Fit Criteria for SEM
| Fit Index | Perfect Fit Criteria | Acceptable Fit Criteria | Reference Resource |
|---|---|---|---|
| x2/ SD | 0 ≤ x2/SD ≤ 2 | 2 ≤ x2/SD ≤ 3 | Hu and Bentler (1999) |
| GFI | 0.95 ≤GFI ≤ 1.00 | 0.90 ≤ GFI ≤ 0.95 | Marsch, Balla and Mcdonald (1988), Jöreskog and Sörbom (1993), Schermelleh-Engel and Moosbrugger (2003). |
| AGFI | 0.90 ≤ AGFI ≤ 1.00 | 0.85 ≤ AGFI ≤ 0.90 | |
| CFI | 0.95 ≤ CFI ≤ 1.00 | 0.90 ≤ CFI ≤ 0.95 | Bentler (1980), Bentler and Bonnett, (1980), Marsch, Hau, Artelt, Baumertv and Peschar, (2006). |
| NFI | 0.95 ≤ NFI ≤ 1.00 | 0.90 ≤ NFI ≤ 0.95 | |
| NNFI | 0.97 ≤ NNFI ≤ 1.00 | 0.95 ≤ NNFI ≤ 0.97 | |
| RMSEA | 0.00 ≤ RMSEA ≤ 0.05 | 0.05 ≤ RMSEA ≤ 0.08 | Browne and Cudeck (1993), Byrne and Campbell (1999), Hu and Bentler (1999), Schermelleh-Engel and Moosbrugger (2003). |
| SRMR | 0.00 ≤ SRMR ≤ 0.05 | 0.05 ≤ SRMR ≤ 0.10 |
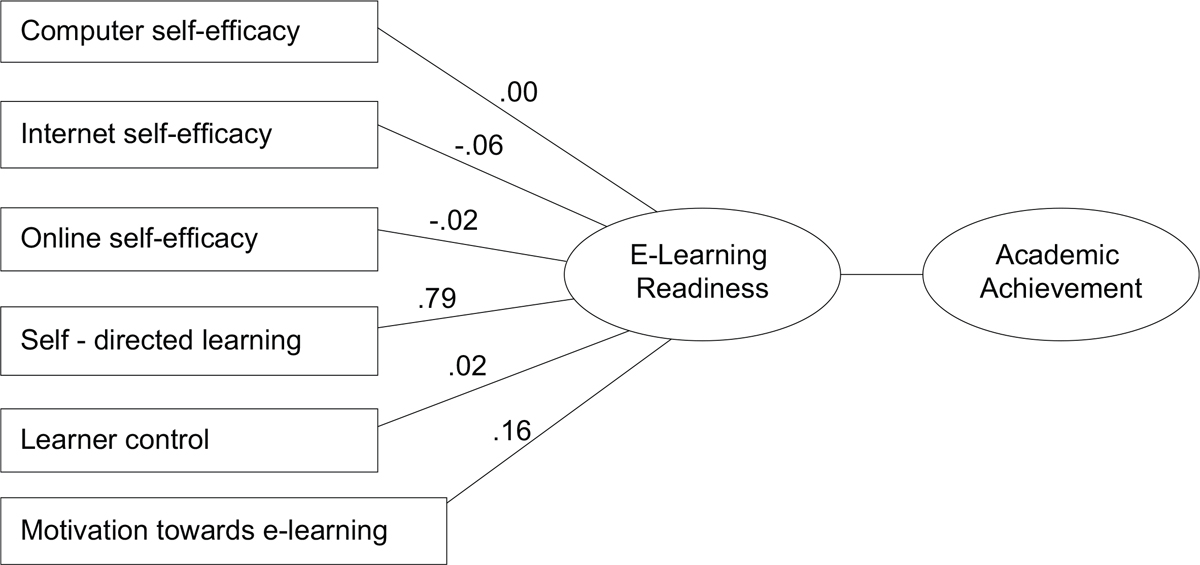
Figure 3
The Hypothesized Model for E-learning Readiness and Academic Achievement Generated by SEM