

Figure 1
Comparison of Course Delivery.
*Note: Some sections were listed as hybrid and met for 100 minutes per week and some sections met for 150 minutes per week. The control group included one 100-minute section and one 150-minute section. The treatment group included two 100-minute sections and one 150-minute section.
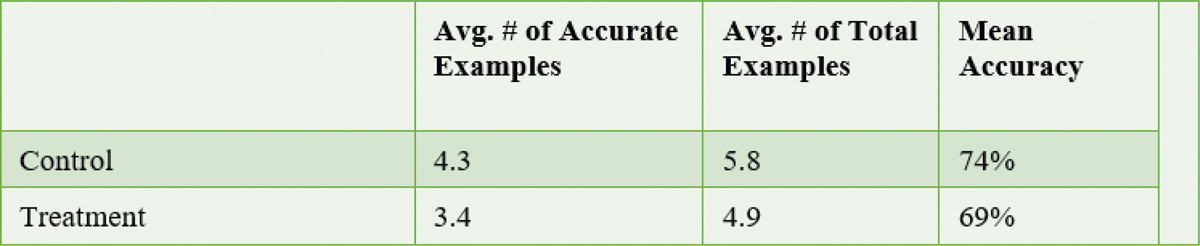
Figure 2
Comparison of mean accuracy of examples used between control and treatment groups.

Figure 3 and 4
Boxplots illustrating the range and distribution of student concept quiz scores in the treatment and control groups.

Figures 5 and 6
Boxplots illustrating final essay scores in the treatment and control groups.
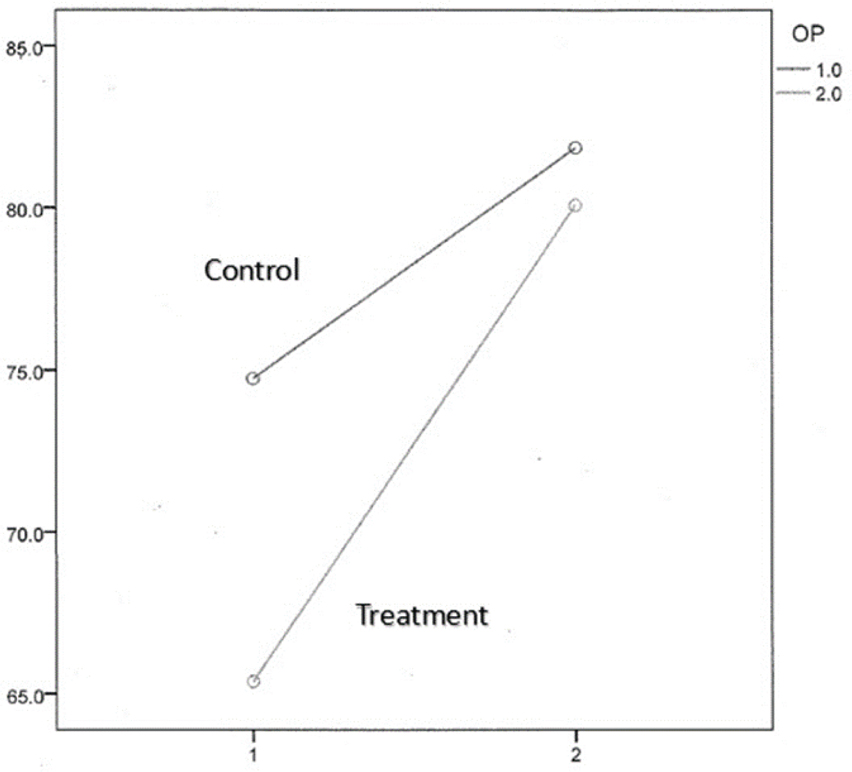
Figure 7
Graph comparing improvement in scores on the grammar diagnostic tool in treatment and control groups.